Learn everything you need to know about workflows, from history and use cases to symbols and tutorials. We'll show you how to create a professional workflow diagram using our workflow diagram software, which includes all the shapes, icons, and features you need to get started.
What is a workflow diagram?
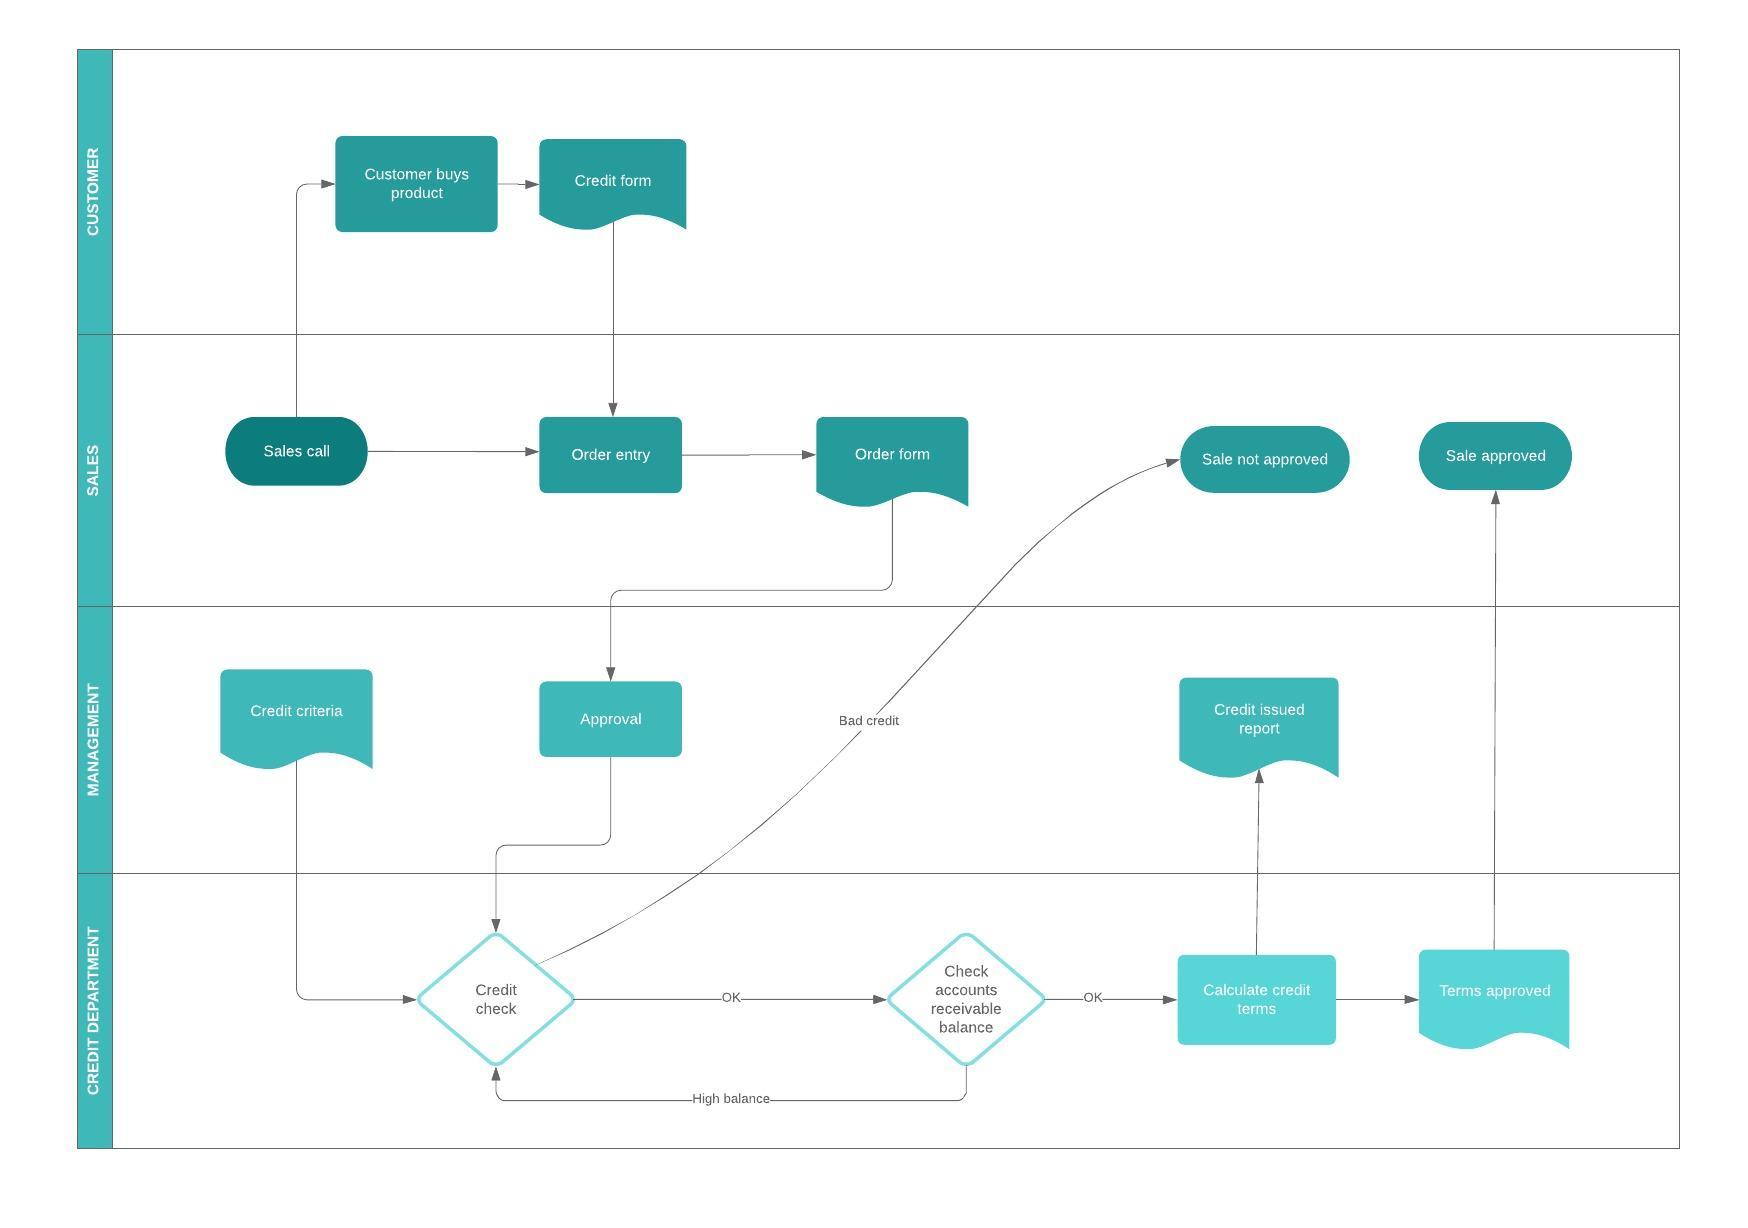
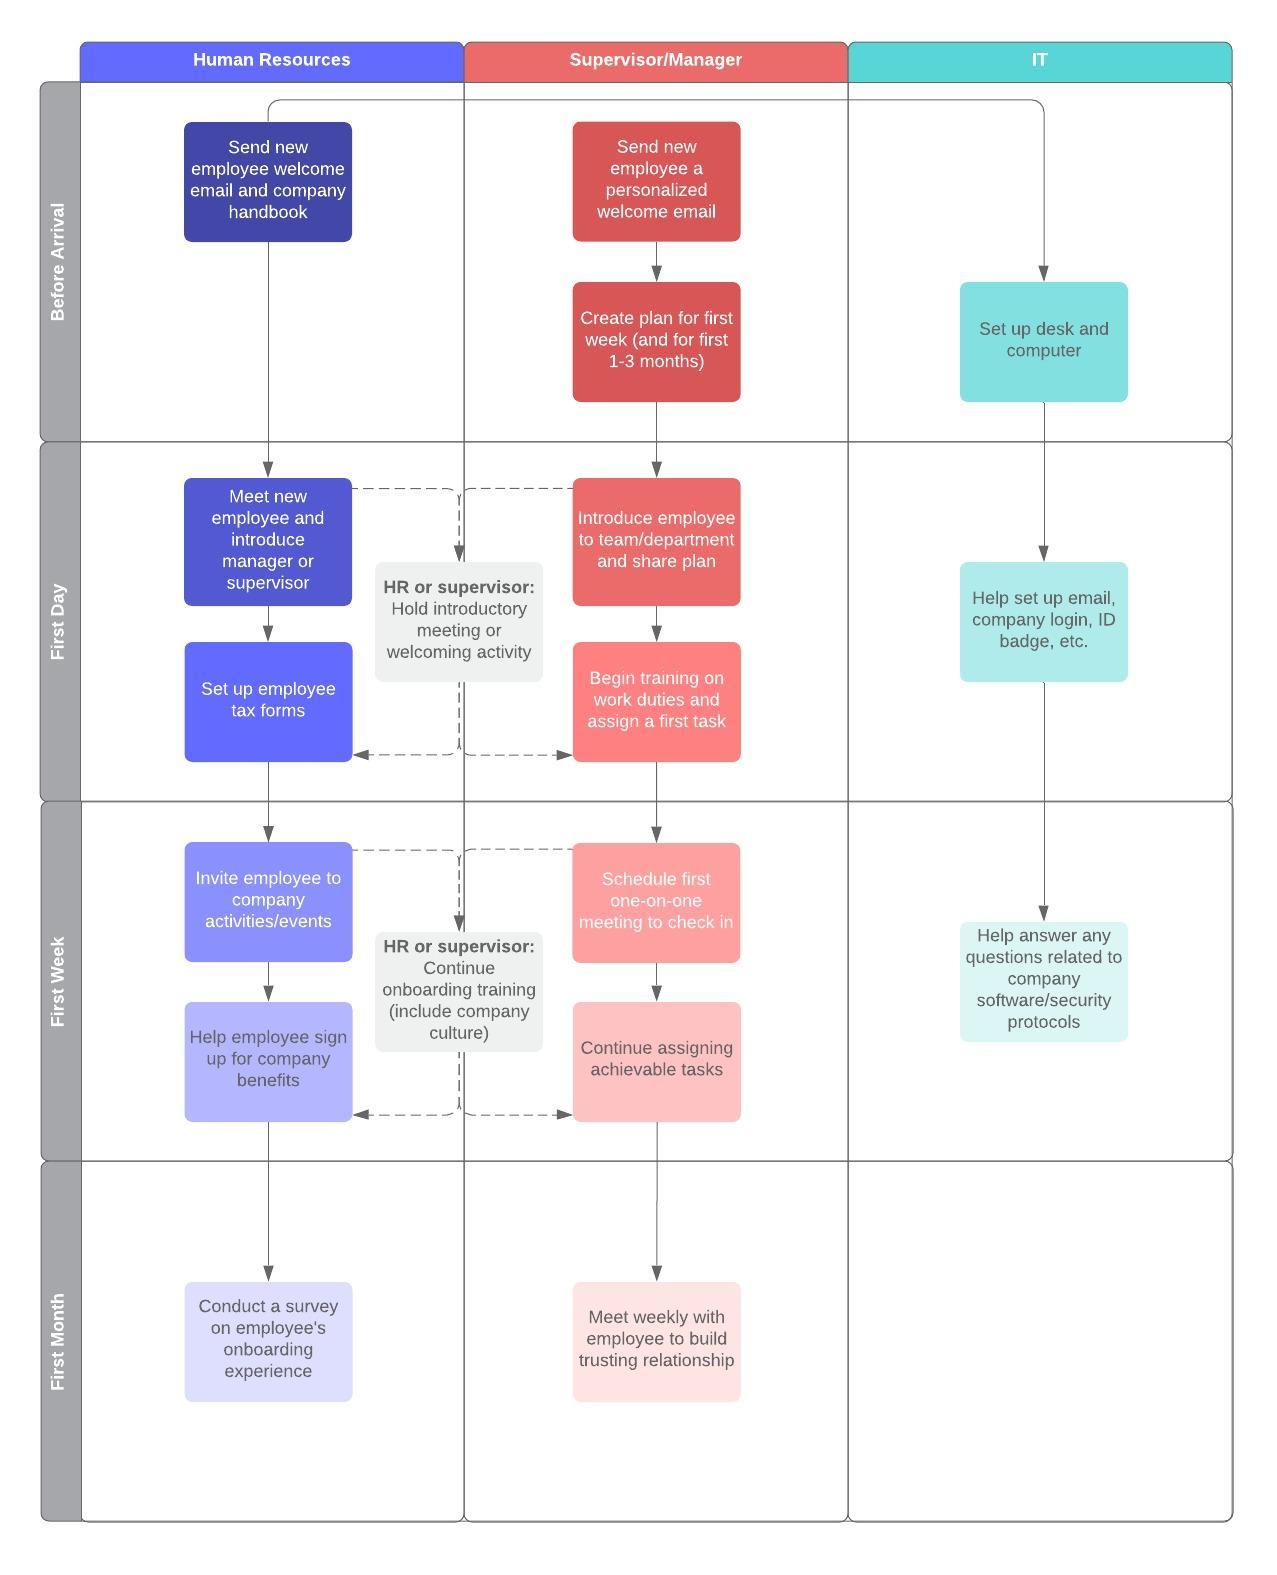
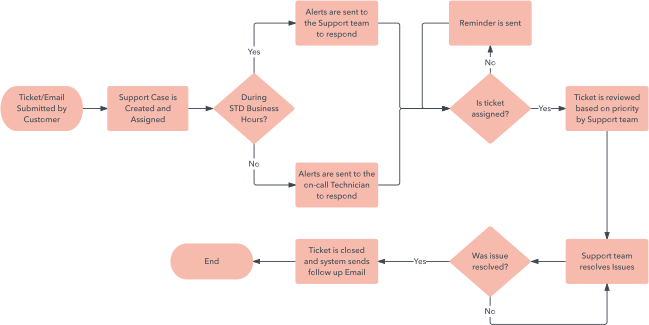
A workflow diagram, also known as a workflow, provides a graphic overview of the business process. Using standardized symbols and shapes, the workflow shows step by step how your work is completed from start to finish. It also shows who is responsible for the work at each stage of the process.
Designing a workflow involves conducting a thorough workflow analysis to identify potential weaknesses. A workflow analysis can help you define, standardize, and identify critical areas of your process.
Workflows are also useful for helping employees understand their roles and the order in which work is completed, and for fostering unity across different departments. Originating from the manufacturing industry, workflows are now used by a variety of industries—from government to finance to commerce—and are easier than ever to create.
Common related terms
The term workflow is sometimes confused with other similar terms:
-
Flowchart: A flowchart is the actual chart that illustrates your workflow. Flowcharts are used to depict a variety of concepts, including workflows.
-
Business process mapping: Think of a workflow as a simple, step-by-step, linear process with no optimization. A workflow is just one part of business process mapping, which uses a holistic approach to coordinate and map all of the different activities, data, systems, and people involved in a business process.
-
Workflow management: The practice (and often the software) used to maintain, update, and improve workflows over time.
History of the workflow diagram
The origins of the modern-day workflow can be traced back to the late 1880s, and the term was first used in a railway engineering journal in 1921. The claimed founders of workflows, Frederick Winslow Taylor, a leading proponent of what's known as scientific management, and mechanical engineer and management consultant Henry Gantt, are credited with being among the first to study the rational organization of labor, particularly in the manufacturing industry.
As the workplace grew more technologically sophisticated with the advent of the copier and the typewriter, the ability to further explore and spread knowledge of the workflow system also expanded. Two major events contributed to the need for rational organization of work: the growing field of optimization theory and the Apollo program from World War II.
The 1980s were also a period of rapid growth in workflows, as the idea of total quality management became popular and companies sought to become globally competitive.
It wasn’t until the 1990s, however, that the process of actually creating workflow diagrams became easier with workflow management software. Before then, workflow diagrams were drawn on paper, if they were drawn at all.
Workflow management software moved flowcharts from paper to electronic-based models that could be saved on a computer and updated with a few clicks. By 2005, software-based workflow management systems had become more robust, with the addition of Business Process Modeling and Notation (BPMN) tools.
When to use a workflow diagram
While workflow diagrams originated in the manufacturing industry, many other industries can benefit from them. Here are a few examples:
-
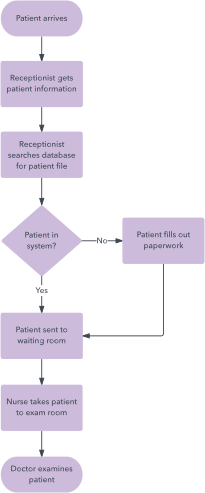
Medical: A hospital can use a workflow diagram to depict the steps taken in an emergency room visit.
-
Military: Workflow diagrams can show the steps taken during a deployment operation.
-
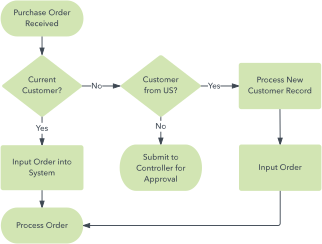
Finance: From payment processing to collections and purchase orders, workflow diagrams can be a useful tool to document your process.
-
Education: Universities can create workflow diagrams to show the steps that a university student takes to enroll.
-
E-commerce: A workflow diagram can show the process a customer goes through, from ordering to receiving the final product.
A workflow provides a visual representation of an entire process, helping you not only understand it more thoroughly but also pinpoint potential problems or bottlenecks before they occur. They're useful for tracking process metrics, improving processes by eliminating inefficiencies, or automating manual processes. Workflows are also useful for employees to understand their particular roles and how they relate to other departments, which can lead to better communication and more cohesiveness.
Beyond industry-specific use cases, workflow diagrams are valuable wherever work is repeatable and involves handoffs, approvals, or cross-role dependencies, including engineering, marketing, production, HR, sales, IT, and operations.
Steps to create a workflow diagram: From analysis to design
There are several steps required to create a successful workflow diagram.
1. First, determine what point of view you are diagramming for: the business or its customers. Clarify whether you are showing how the process currently works—known as the "as is" process—or how you want the new implementation to look, known as the "to be" process.
2. Next, you'll want to design a rough sketch of your current business process. Consider this a general overview of the high-level steps in your process—work or activities that occur repeatedly in your organization.
3. After you've created your initial diagram, you're ready to dive into the details. This is the requirements gathering phase, where you'll obtain information from the people involved in each step.
During this phase, ask your employees the following:
-
What's your overall goal?
-
What signals the beginning and end of the business process?
-
What activities are involved in each step, and who is involved in them?
-
What happens next?
-
Are there any deviations from this process?
-
During decision points—for approval or denial—what information does the worker need to know in order to make a decision?
4. After you have all the information you need, conduct a workflow analysis, keeping these three steps in mind to help eliminate inefficiencies:
-
Categorize: One way to quickly pinpoint weak areas is to rank tasks based on importance: "vital," "useful," "nice but not necessary," and "should eliminate." Divide tasks by job description to ensure they align with the appropriate job title and level of expertise.
-
Pinpoint weak areas: Look for redundancies, bottlenecks, double data entry, and multiple steps that cause delays.
-
Think ahead: A workflow analysis is also a good time to ensure that your company is aligning with future goals. What are your company's goals for the next five years? What tasks are required to reach those goals, and are they represented in your current workflow?
5. Now you're ready to design! To make it easy, use one of Lucidchart’s workflow templates. They are a great launch point for building and customizing your diagram.
If you're starting from scratch, it can help to outline the steps in plain language before you formalize them into a diagram. For example, a simple workflow could describe the process for approving content in a software installation guide:
-
A technical writer documents the installation instructions based on information gathered from subject matter experts.
-
The document is sent to subject matter experts for review.
-
The writer incorporates changes based on the review.
-
The document is sent for final review.
-
Document is approved or rejected.
-
(Rejected) Writer revises the draft and submits it again.
-
(Accepted) Document is published.
Types of workflow diagrams
templates:
-
ANSI flowchart: Using symbols from the American National Standards Institute, the ANSI style was the first standard for workflows and provides a common language for describing the different steps involved.
-
UML activity: Using the Unified Modeling Language, the UML activity diagram is used to graphically represent the order of steps in a process and the flow of control.
-
BPMN: Standing for Business Process Modeling Notation, BPMN uses a flowchart technique similar to UML. It serves as a common language for both technical users and business users. It focuses on business processes and information—such as internal processes—rather than output.
-
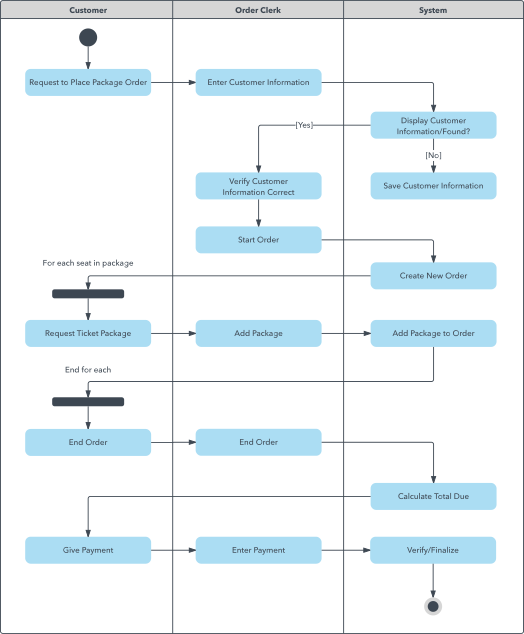
Swimlane: A swimlane diagram separates units within the organization, highlighting their interactions and providing a high-level view of potential inefficiencies.
-
SIPOC: This acronym stands for Supplier-Input-Process-Output-Customer, which clearly shows who creates and receives the data and outlines the high-level process involved.
Common symbols and shapes
Workflows use specific shapes and symbols to represent steps and actions throughout the process. Common symbols and shapes include:
|
Shape |
Name |
Meaning
|
|---|---|---|

|
Oval |
Signifies the starting and ending points of the process |

|
Rectangle |
Denotes instructions or actions |

|
Diamond |
Indicates where a decision must be made, after which the workflow proceeds in two separate paths after a "yes" or "no" decision |

|
Circle |
Used as a connector item when a leap is made from one section to another, separated by arrows |

|
Arrow |
Points toward the next step |
Components of a workflow diagram
Each element of a workflow is designed to illustrate the flow between each step. Each step includes one of three parameters:
-
Input: the labor, capital, equipment, or information that's required to complete the step
-
Transformation: the changes that create the output, such as location, physical characteristics, change in ownership, or purpose
-
Output: the result of the transformation
5 workflow improvement theories
In the 1980s, the work of W. Edwards Deming and Joseph M. Juran—both engineers and management consultants—gave rise to a variety of theories on improving business process workflow that are still used today, including:
-
Six Sigma: Using a mathematical equation based on statistical theory, Six Sigma is intended to eliminate errors in final products, aiming for no more than 3.4 defects per 1 million in manufacturing. Emphasizing quality improvement at every level, Six Sigma involves observing, analyzing, and experimenting with the process. Two popular methods are DMADV (Define, Measure, Analyze, Design, Verify) and DMAIC (Define, Measure, Analyze, Improve, Control).
-
Total quality management: This theory aims to improve product quality as well as the work environment, emphasizing better communication and cooperation between departments and employees.
-
Business process reengineering: Using algorithms to analyze every level, business process reengineering involves rethinking the entire business process according to changing conditions.
-
Lean Systems: This theory zeroes in on eliminating excess overhead and waste, creating a "lean" organization in order to stay competitive in the face of market changes and instability.
-
Theory of Constraints (TOC): This theory aims to identify the weakest link—the constraint—and eliminate it.
Additional benefits of workflow diagrams in modern organizations
In addition to supporting continuous improvement methods like Lean and Six Sigma, workflow diagrams are often created (or refreshed) to make day-to-day operations more reliable, scalable, and easier to manage. Here’s how:
-
Improve business operations: By defining the specific steps and sequences required to complete a task, you can ensure the job is completed by the right people, in the proper order, and within a specified timeframe. A workflow can be designed for one person or for a group of people whose roles and assignments depend on each other to complete the project.
-
Eliminate redundant processes and activities: Startup companies are usually small and have fewer processes and activities in place than more mature enterprises. Using workflow diagrams and updating them as the company grows can help you more easily detect redundancies and eliminate waste better than simply observing and trying to track workflows with your eyes.
-
Reduce operational expenses: A workflow diagram can help you define best practices and streamline your business operations. As processes are streamlined and work gets done faster, you may find that you need fewer resources to get the job done. This can lower your costs as your profits increase, because you can still meet the same goals and objectives with fewer resources.
-
Quickly respond to issues or problems: Because modern workflows are typically maintained in software, teams can update diagrams quickly as requirements, customer expectations, or market conditions change.
-
Automate processes: A workflow can help you identify simple tasks to automate, such as sending work items from one employee to the next in a process that requires several people to complete specific tasks in a specific order. Automation makes it easy to analyze business operations, see trends, prepare for risks, and plan for expansion.
Ready to increase efficiency across your organization? Make a workflow diagram in Lucidchart today.
Make a diagram