Key takeaways
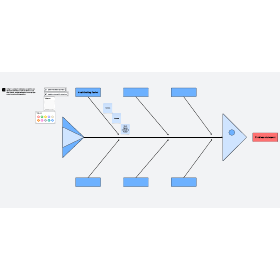
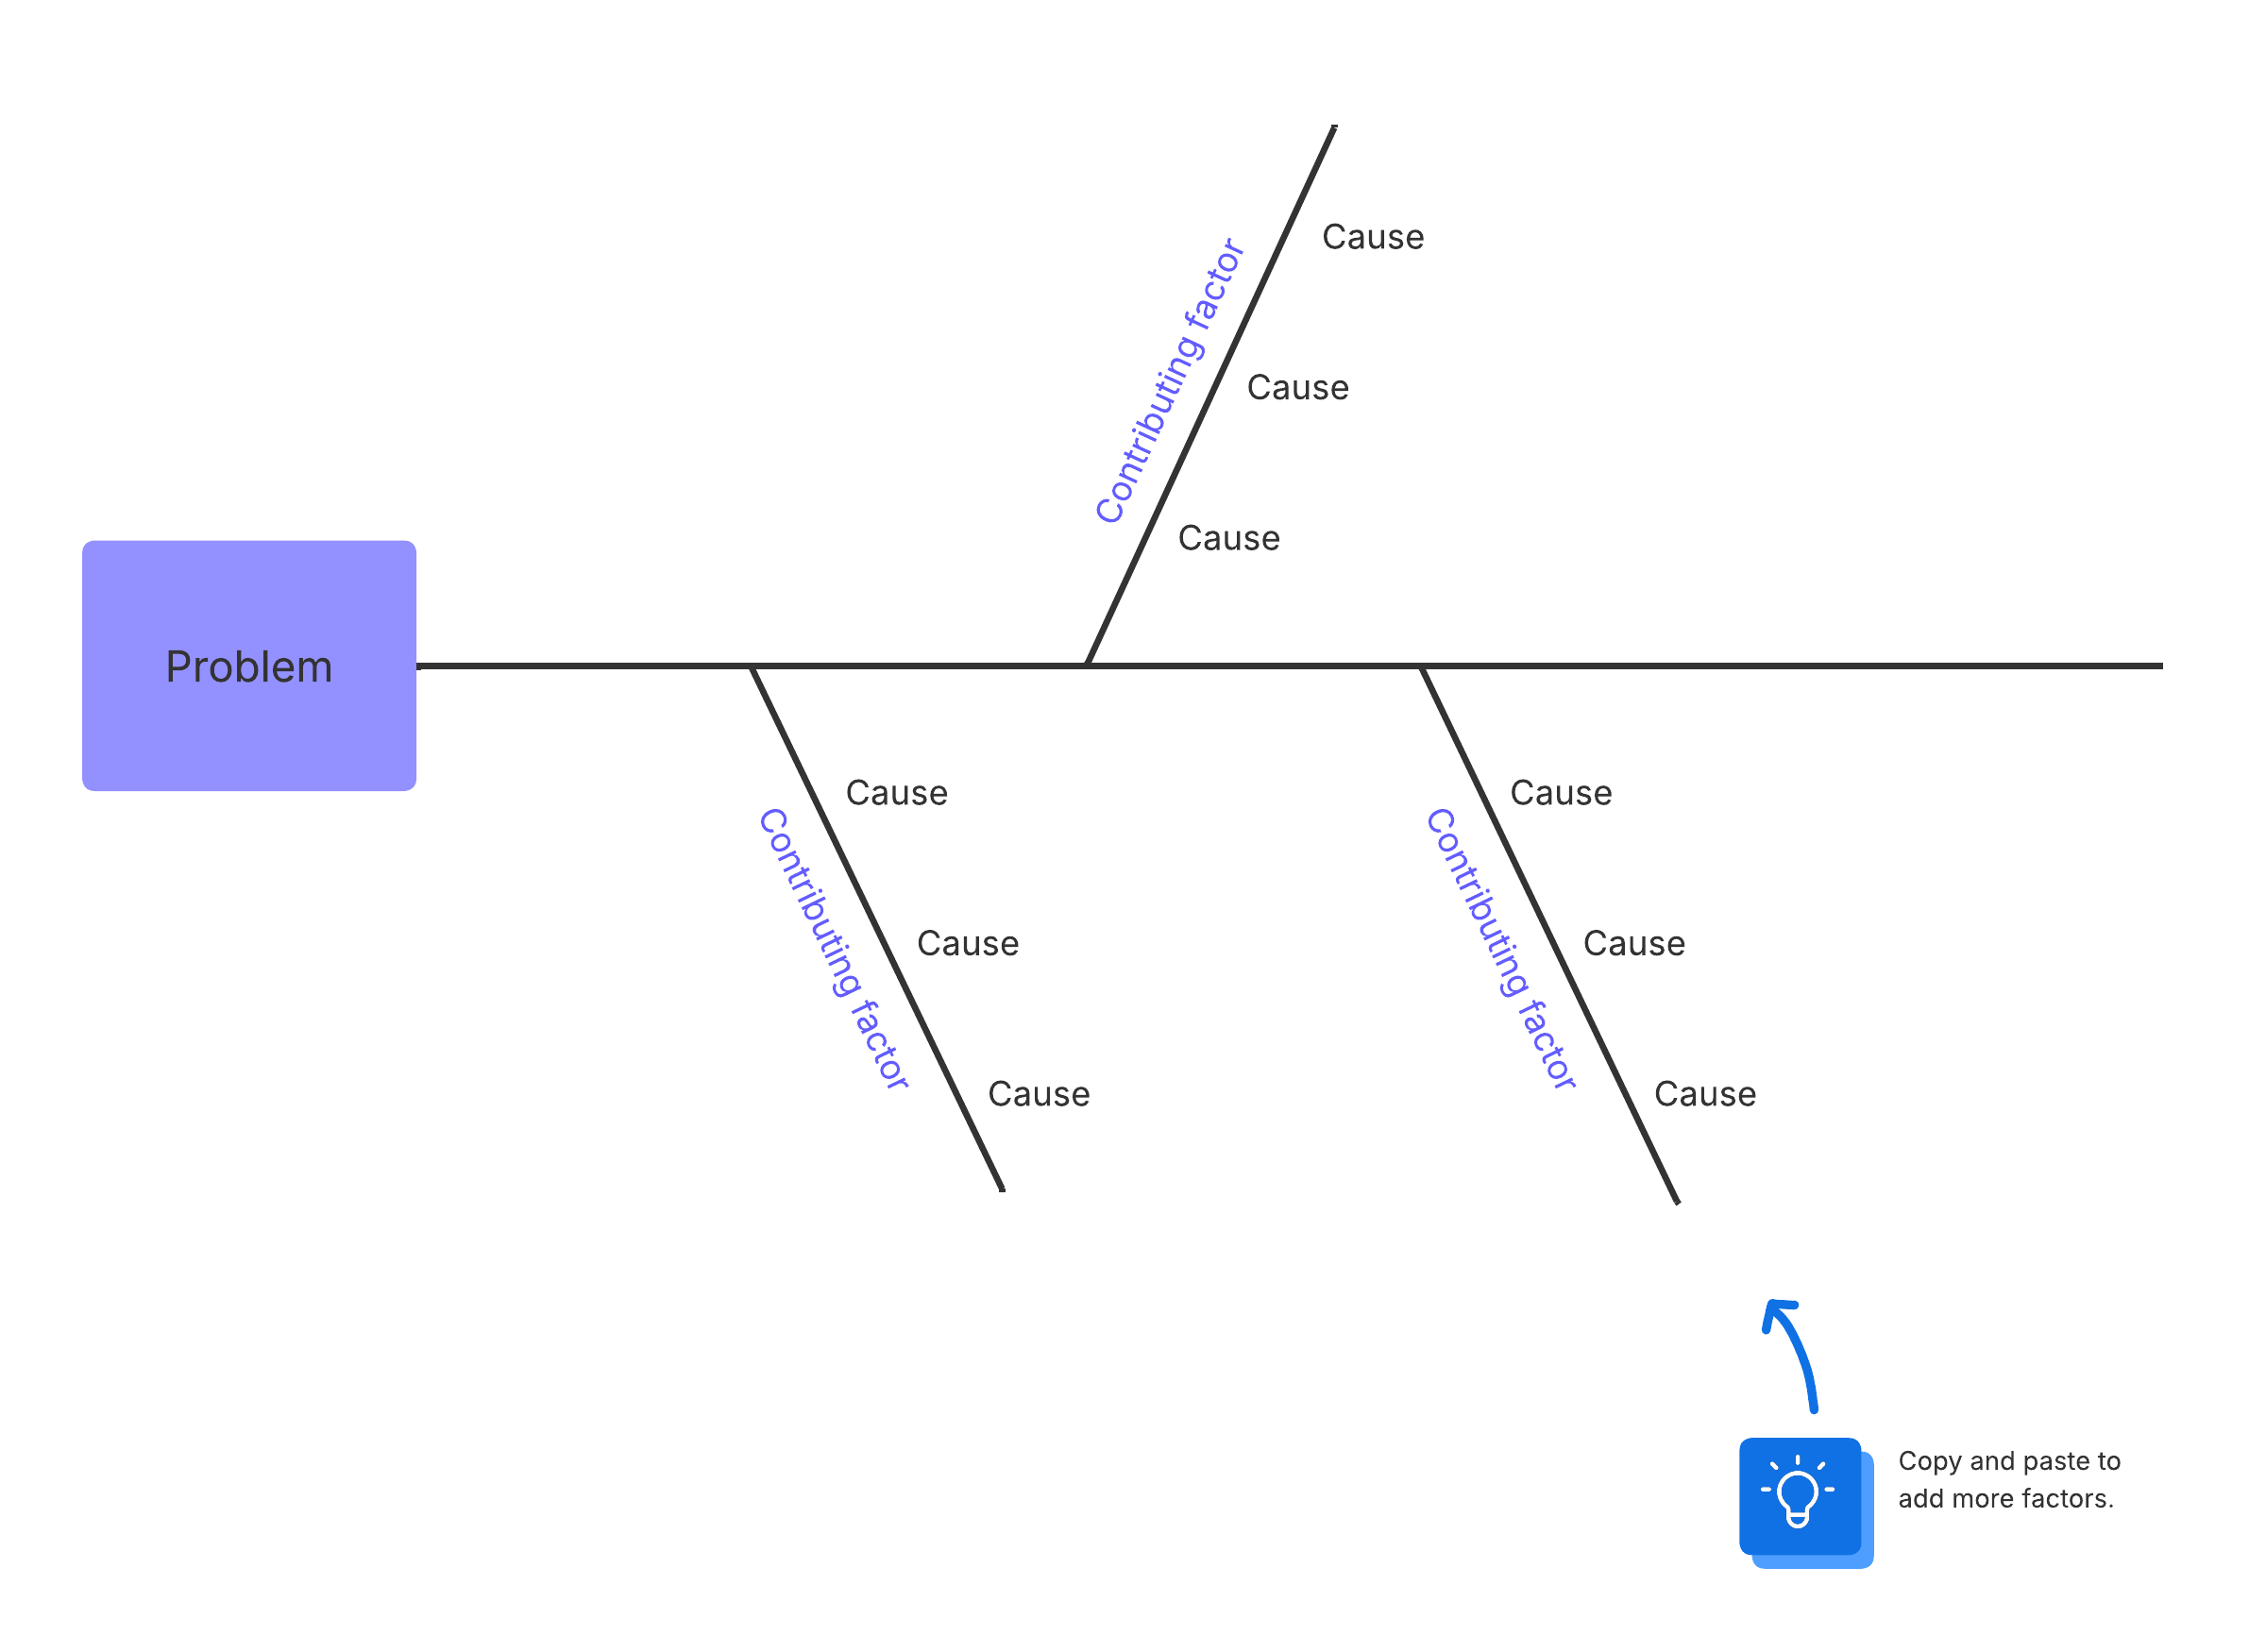
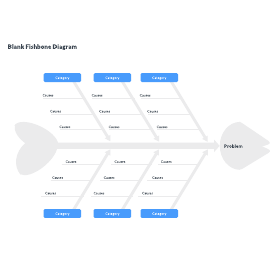
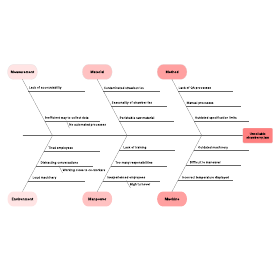
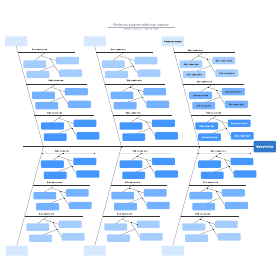
A fishbone diagram puts the problem at the head, cause categories on the bones, and specific causes on the smaller branches. The spine is an arrow drawn from left to right, so it points at the problem statement.
Microsoft Word has no built-in fishbone template, but you can manually create one by going to Insert > Shapes.
Saving a blank version of the fishbone diagram in Word gives you a reusable template for the next problem your team tackles.
A Lucidchart template and the Lucid add-in for Word let you insert a finished diagram into a Word document without drawing every line by hand.
Learning how to make a fishbone diagram in Word helps you map the possible causes of a problem in a document your team already uses. Kaoru Ishikawa popularized fishbone diagrams in the 1960s, though the basic concept was first used in the 1920s. Today, the fishbone diagram is one of the seven basic tools of quality control.
Industries such as healthcare and engineering use fishbone diagrams to get to the root of a problem. This guide covers two ways to create a fishbone diagram in Word. You can insert an editable fishbone diagram template from Lucidchart, the intelligent diagramming application from Lucid Software, or draw one from scratch with Word shapes.
How to make a fishbone diagram in Word from scratch
Word doesn't have a built-in fishbone diagram template, so you'll draw one with shapes. Here's how to do a fishbone diagram in six steps.
1. Open the Shapes menu
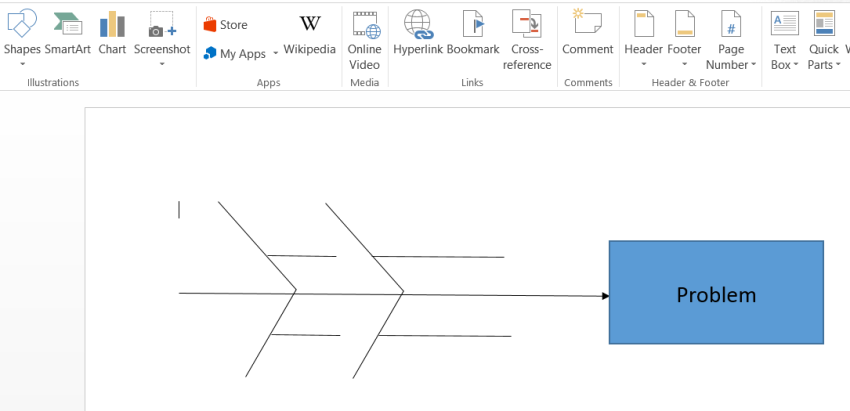
In your Word document, go to Insert > Shapes. Every line and shape you need is in this menu.
2. Draw the head and spine
The spine is the central arrow, and the head holds your problem statement. To draw them, follow these steps:
Choose an arrow from the Lines section.
Drag from left to right across the page so the arrow points right. Hold Shift while you drag to keep the line perfectly straight.
Add a rectangle at the tip of the arrow.
Type your problem statement in the rectangle. Select the shape and start typing, or right-click it and choose Add Text or Edit Text.
3. Add the category bones
Each bone represents one category of causes contributing to the problem. To add them, follow these steps:
Draw lines without arrows that angle off the spine, like ribs.
Label each bone with a text box or shape at its tip.
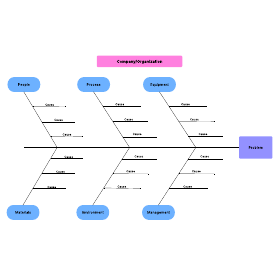
Start with the 6 Ms: machines, methods, materials, measurements, environment, and people.
4. Add the cause lines
Causes branch off each category bone. To add them, follow these steps:
Draw short horizontal lines off each category bone.
Go to Insert > Text > Text Box to add a label above each line.
Type one potential cause per label.
5. Customize the look of your diagram
Word applies its default styles, so skip this step if you're happy with them. To change the look, follow these steps:
Select a shape to open the Shape Format tab.
Use Shape Styles, Shape Fill, and Shape Outline to change colors and line weights.
Right-click a shape and choose Format Shape to open the full formatting pane.
Hold Shift while you click to select and style multiple shapes at once.
6. Group the shapes and save a fishbone diagram template Word file
Grouping keeps every piece of the diagram in place. To finish, follow these steps:
Select every shape, line, and text box in the diagram.
Right-click and choose Group so the diagram moves as one object.
Save the document.
Before you type in causes, save a blank copy as your fishbone diagram template Word file. Duplicate it each time you start a new Ishikawa diagram Word document.
How do you create a fishbone diagram in Word with a Lucidchart template?
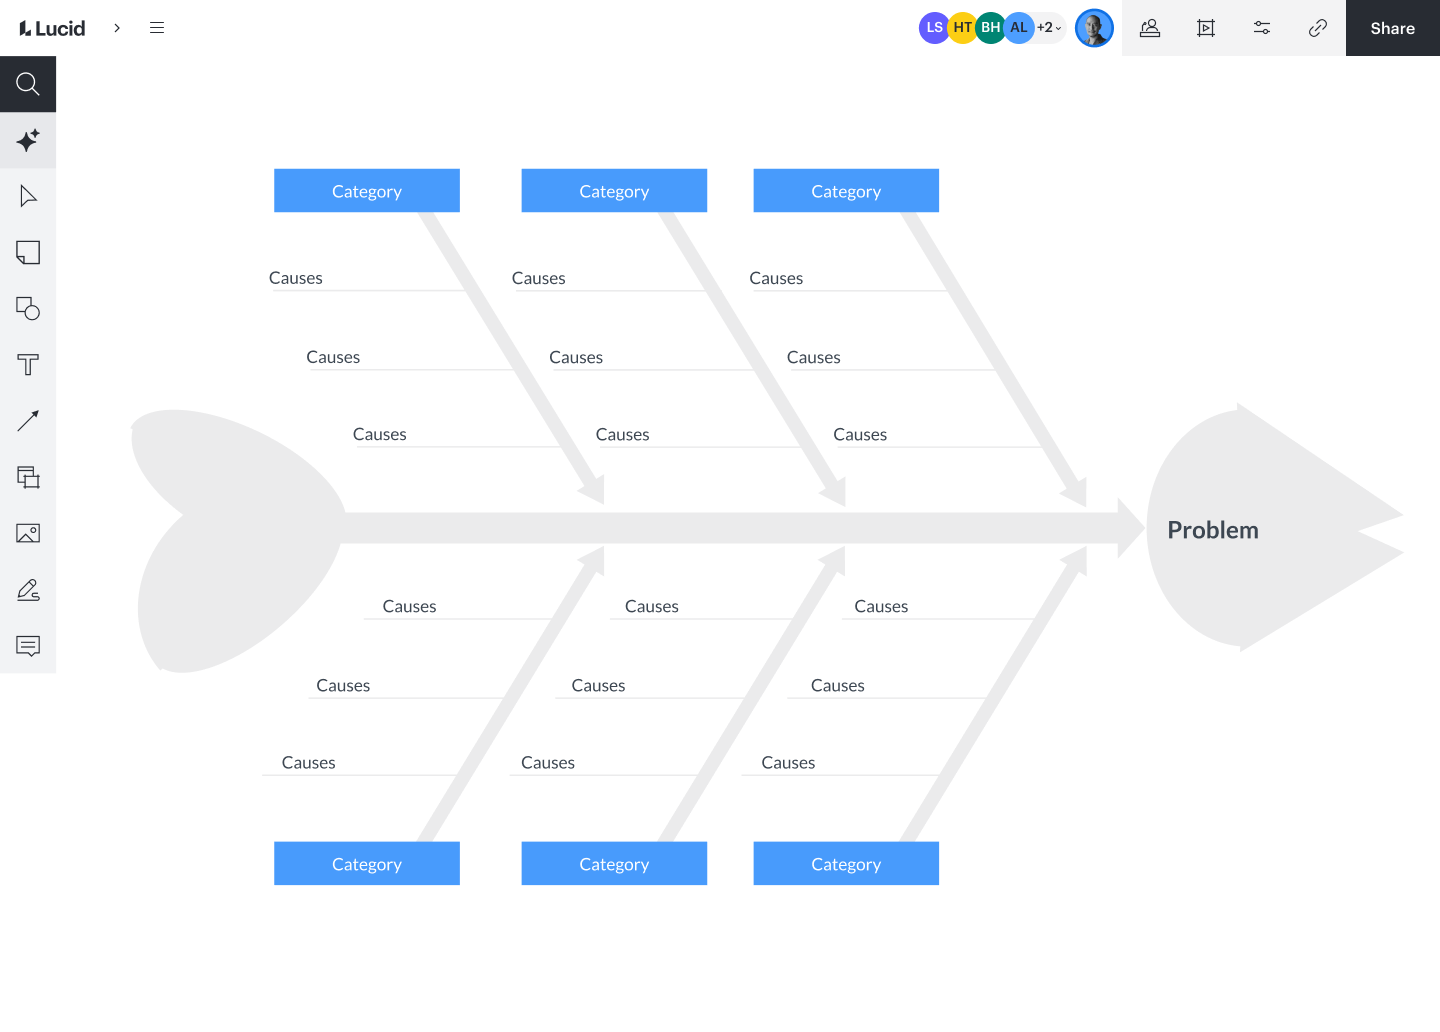
Build your diagram from a Lucidchart template, then insert it into your document with the Lucid add-in for Word. It's the faster route when your diagram has many categories and causes.
1. Set up a free Lucidchart account
To get started, sign up for a free Lucidchart account, opens in a new tab. All you need is an email address.
2. Choose a fishbone diagram template or generate an initial draft with Lucid AI
Lucidchart offers several fishbone diagram templates at different levels of complexity. To start from a template, opens in a new tab, follow these steps:
From the Lucid home page, click + New > Lucidchart > Create from template in the left navigation. If you already have a document open, click the search icon in the left-hand toolbar and then click Templates.
Search for "fishbone."
Select a template.
Click Use.
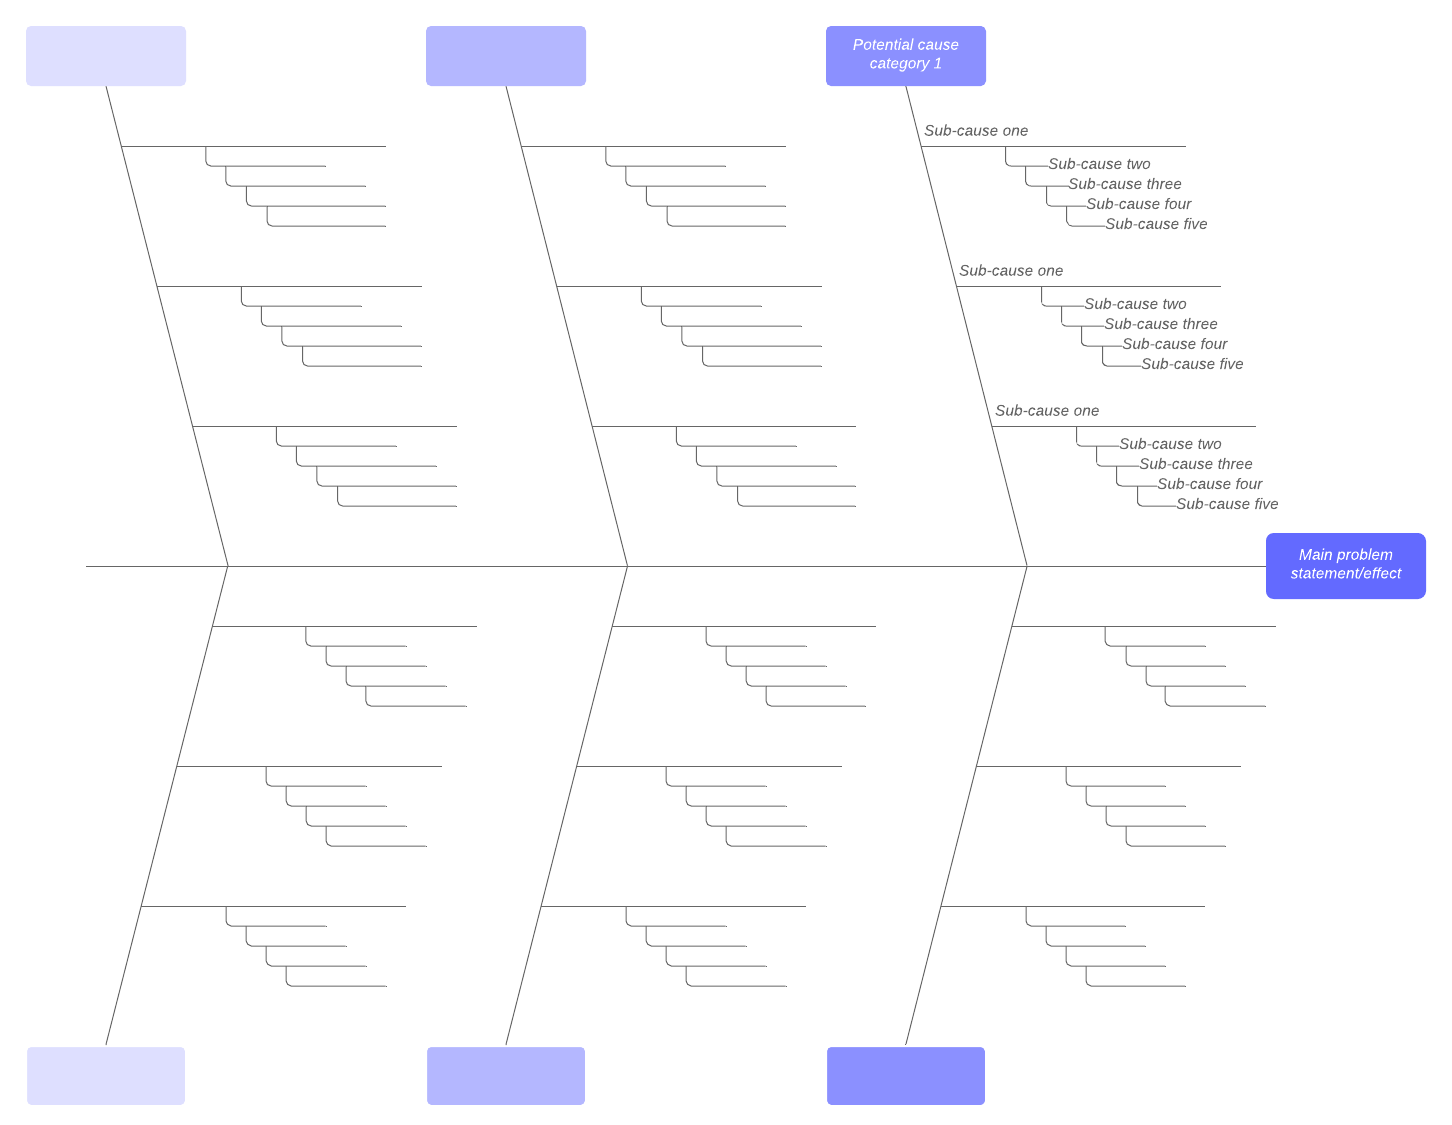
You can get started even faster using Lucid AI, opens in a new tab. From your Lucidchart document, click the Lucid AI icon in the left-hand toolbar. Describe the subject of your fishbone diagram, and then click “Enter.”
3. Customize your fishbone diagram
Replace the placeholder content with your own:
Type the problem statement in the head of the fish.
Label each bone with a category of causes.
Add specific causes as branches off each category.
Not sure which categories to use? Our fishbone diagram tutorial, opens in a new tab explains how to group causes with the 6 Ms.
4. Install the Lucid add-in for Word
To install the Lucid add-in, opens in a new tab in Word, follow these steps:
Open a Word document.
Click File > Get Add-ins > More Add-ins.
Search for "Lucid."
Choose a Lucid add-in, and click Add.
Follow the prompts to finish setup.
5. Insert the diagram into your Word document
With the add-in installed, follow these steps:
Click Insert > My Add-ins. You may need to click a three-dot icon to find it.
Select the Lucid add-in.
In the panel on the right side, create a new diagram or select an existing one.
Log in to Lucid if prompted.
Tip: Give new documents a clear title so you can find them quickly in the add-in.
Check your version first. Lucid add-ins work with:
Microsoft 365 Online in a supported browser
Office 2016 or newer, except 2016 and 2019 volume licenses
Office 365 on Windows 10 version 1903 or later
Desktop apps that use Internet Explorer instead of Microsoft Edge won't run the add-in, and Edge needs WebView2. Collaborators need a Lucid account, the add-in, and view or edit access to the document to see the diagram. If your version isn't supported, export your diagram as an image, opens in a new tab and insert it into Word as a picture.
Word is a word processor, so building a cause-and-effect diagram in Word takes patience. Aligning many lines and text boxes by hand gets tedious as your diagram grows. A Lucidchart template and the Lucid add-in skip that work, so you can focus on the root cause analysis, opens in a new tab itself.
Streamline the process of adding visuals to Microsoft Word by connecting to Lucidchart today.