Fishbone diagram maker
Lucidchart is an intelligent diagramming application that makes creating a fishbone diagram easy with drag-and-drop shapes, ready-to-use templates, and more.


By registering, you agree to our Terms of Service and you acknowledge that you have read and understand our Privacy Policy.
Analyze cause and effect with our fishbone diagram creator
Find the cause of any business problem with effective visuals
Turn problems into organized solutions
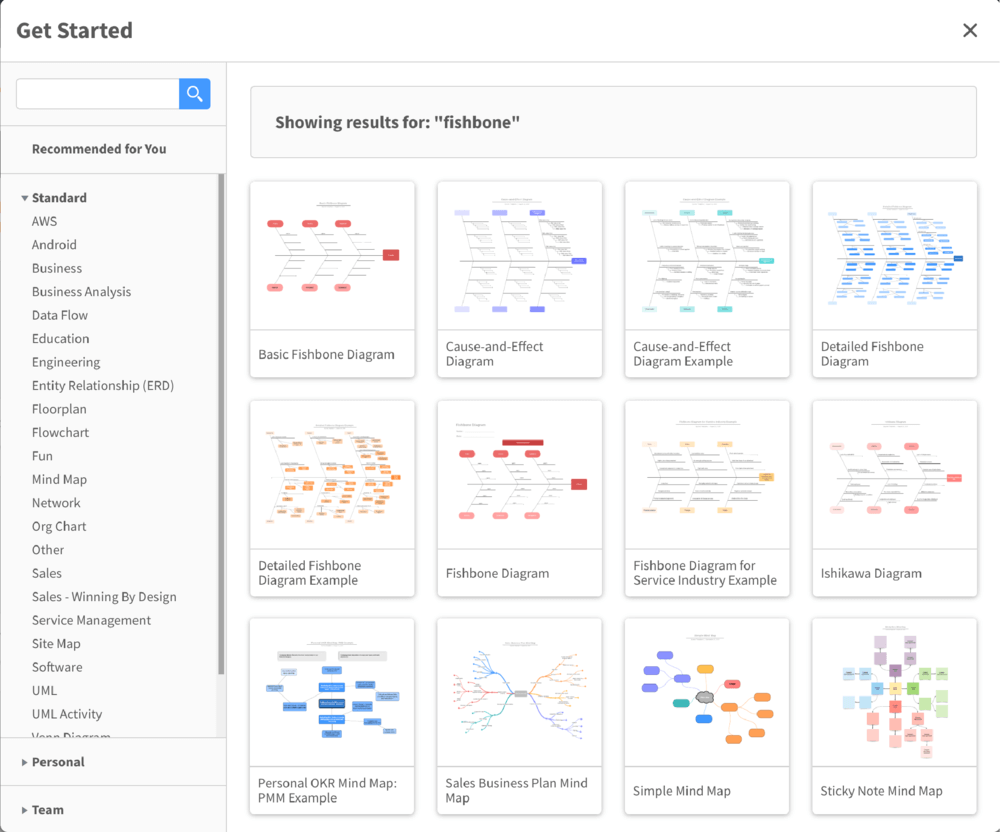
Choose a template to jump-start your brainstorming session
Brainstorm causes as a group in real time

Boost productivity with 100+ integrations
Lucidchart feature highlights
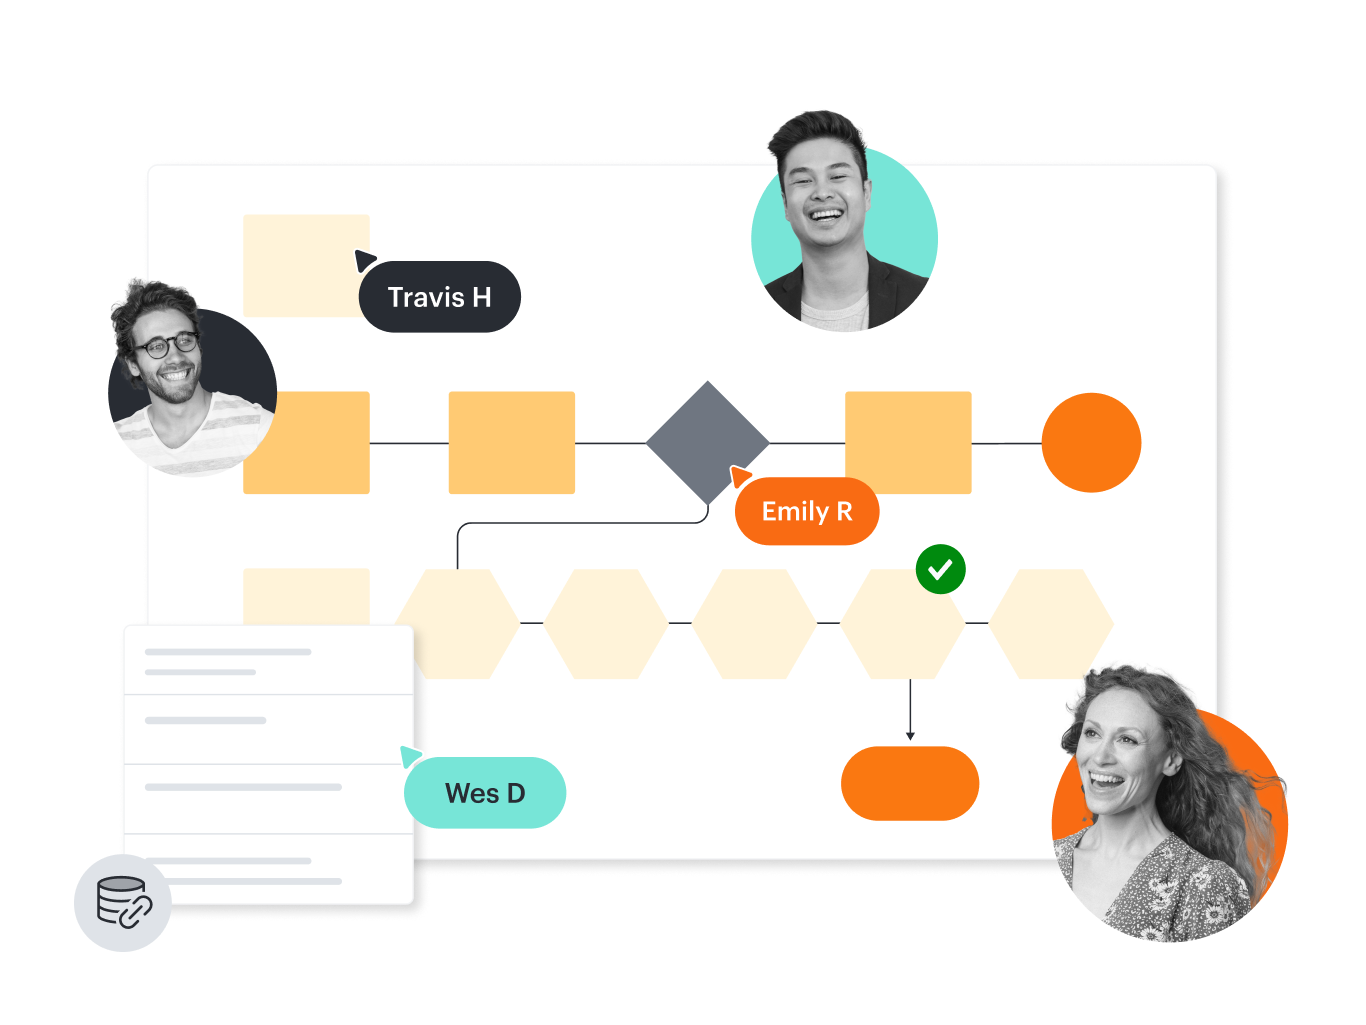
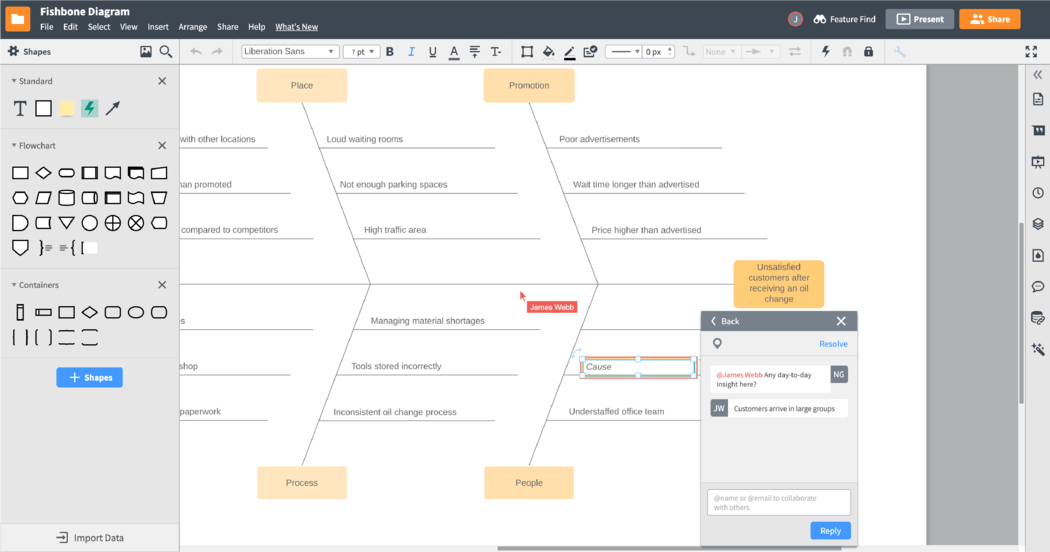
Real-time collaboration
Real-time collaboration
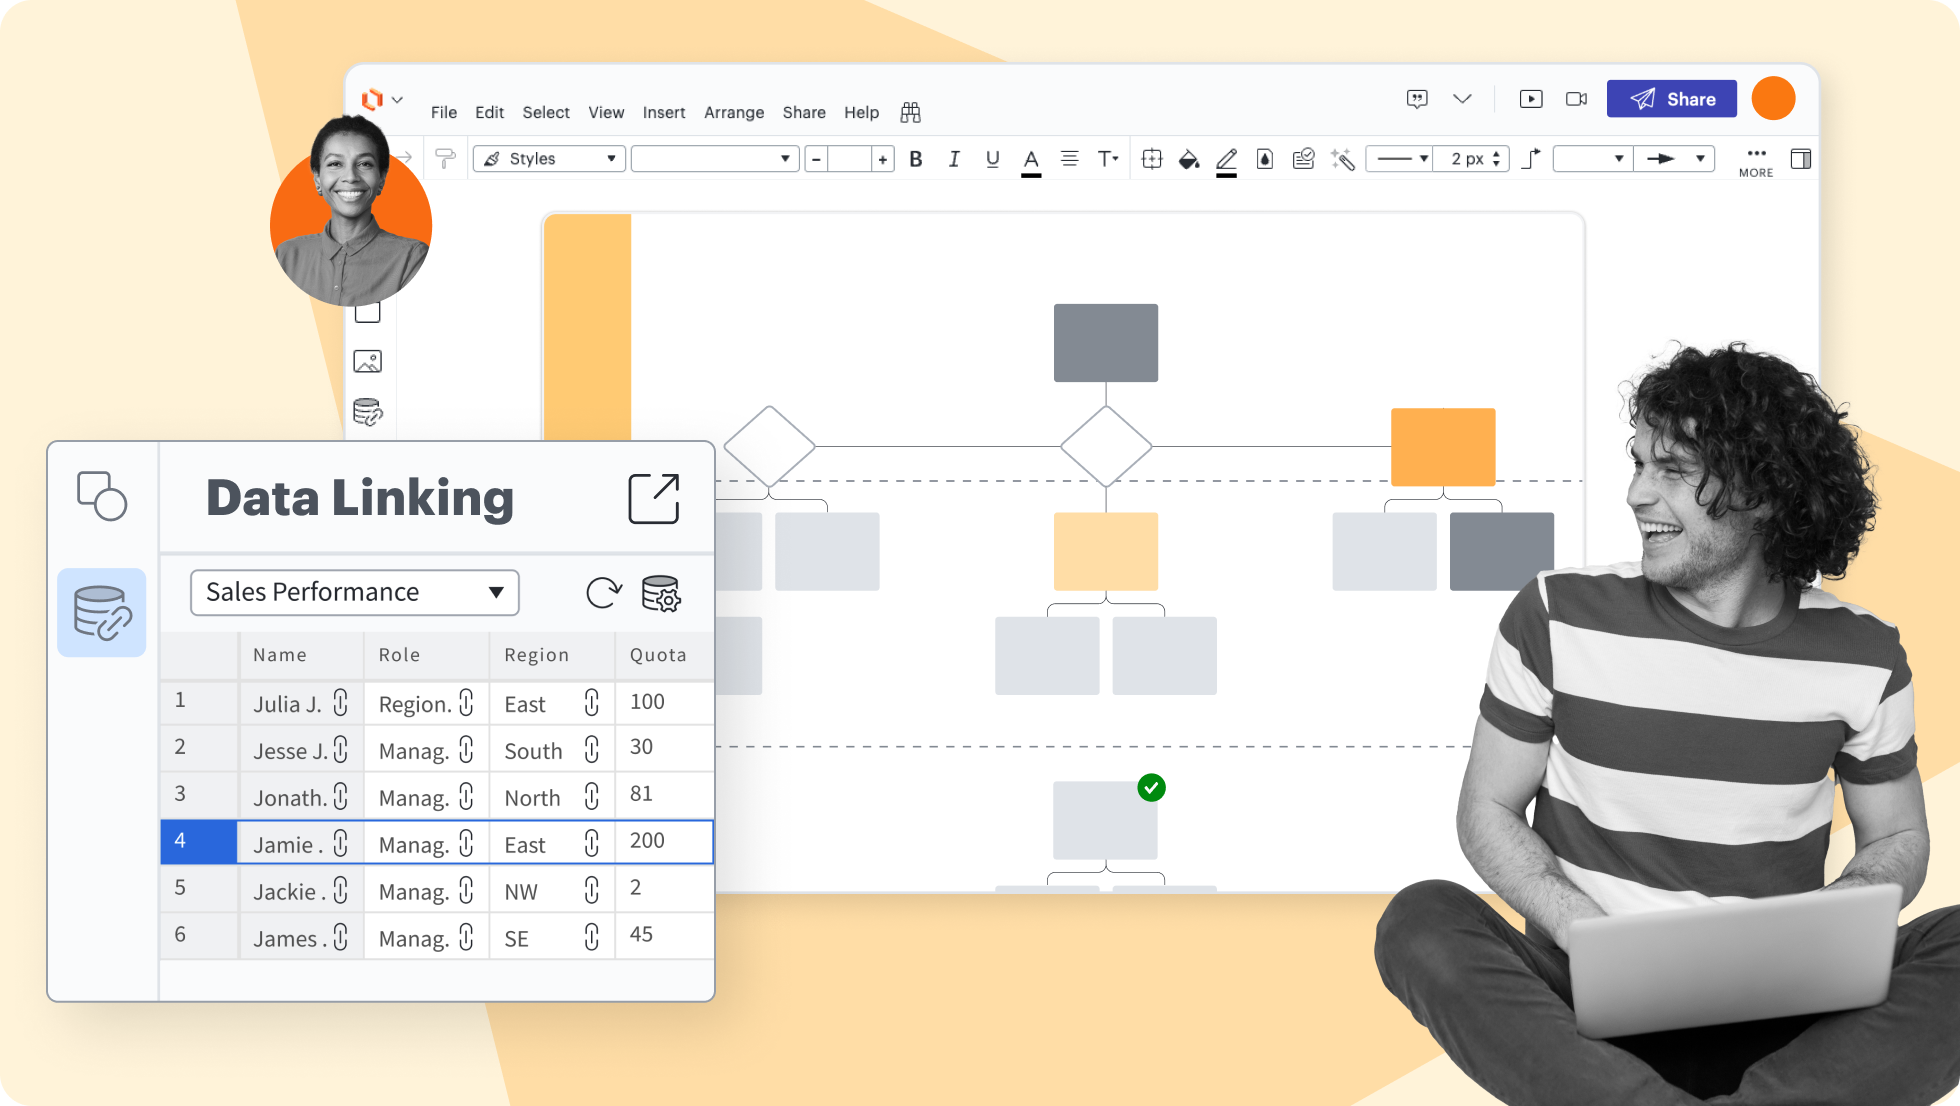
Data linking
Data linking
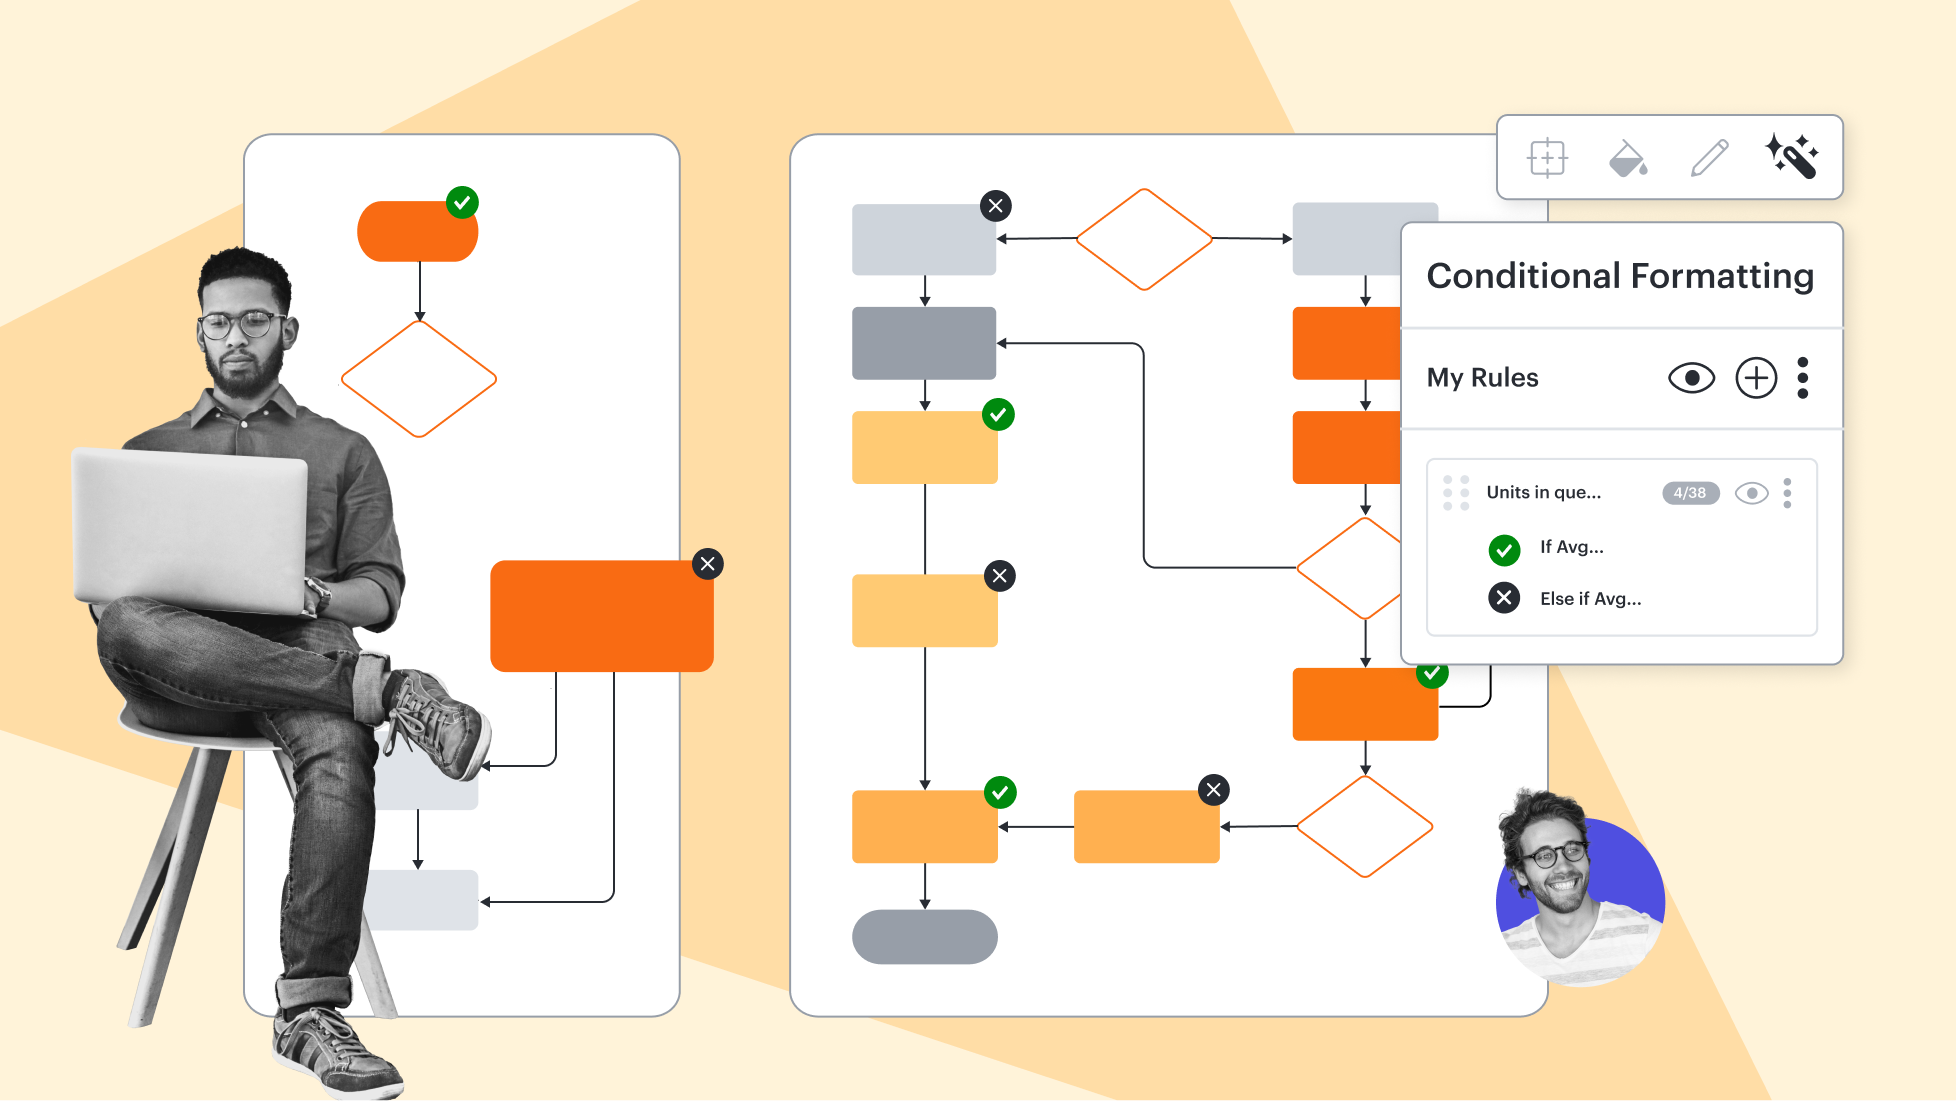
Conditional formatting
Conditional formatting
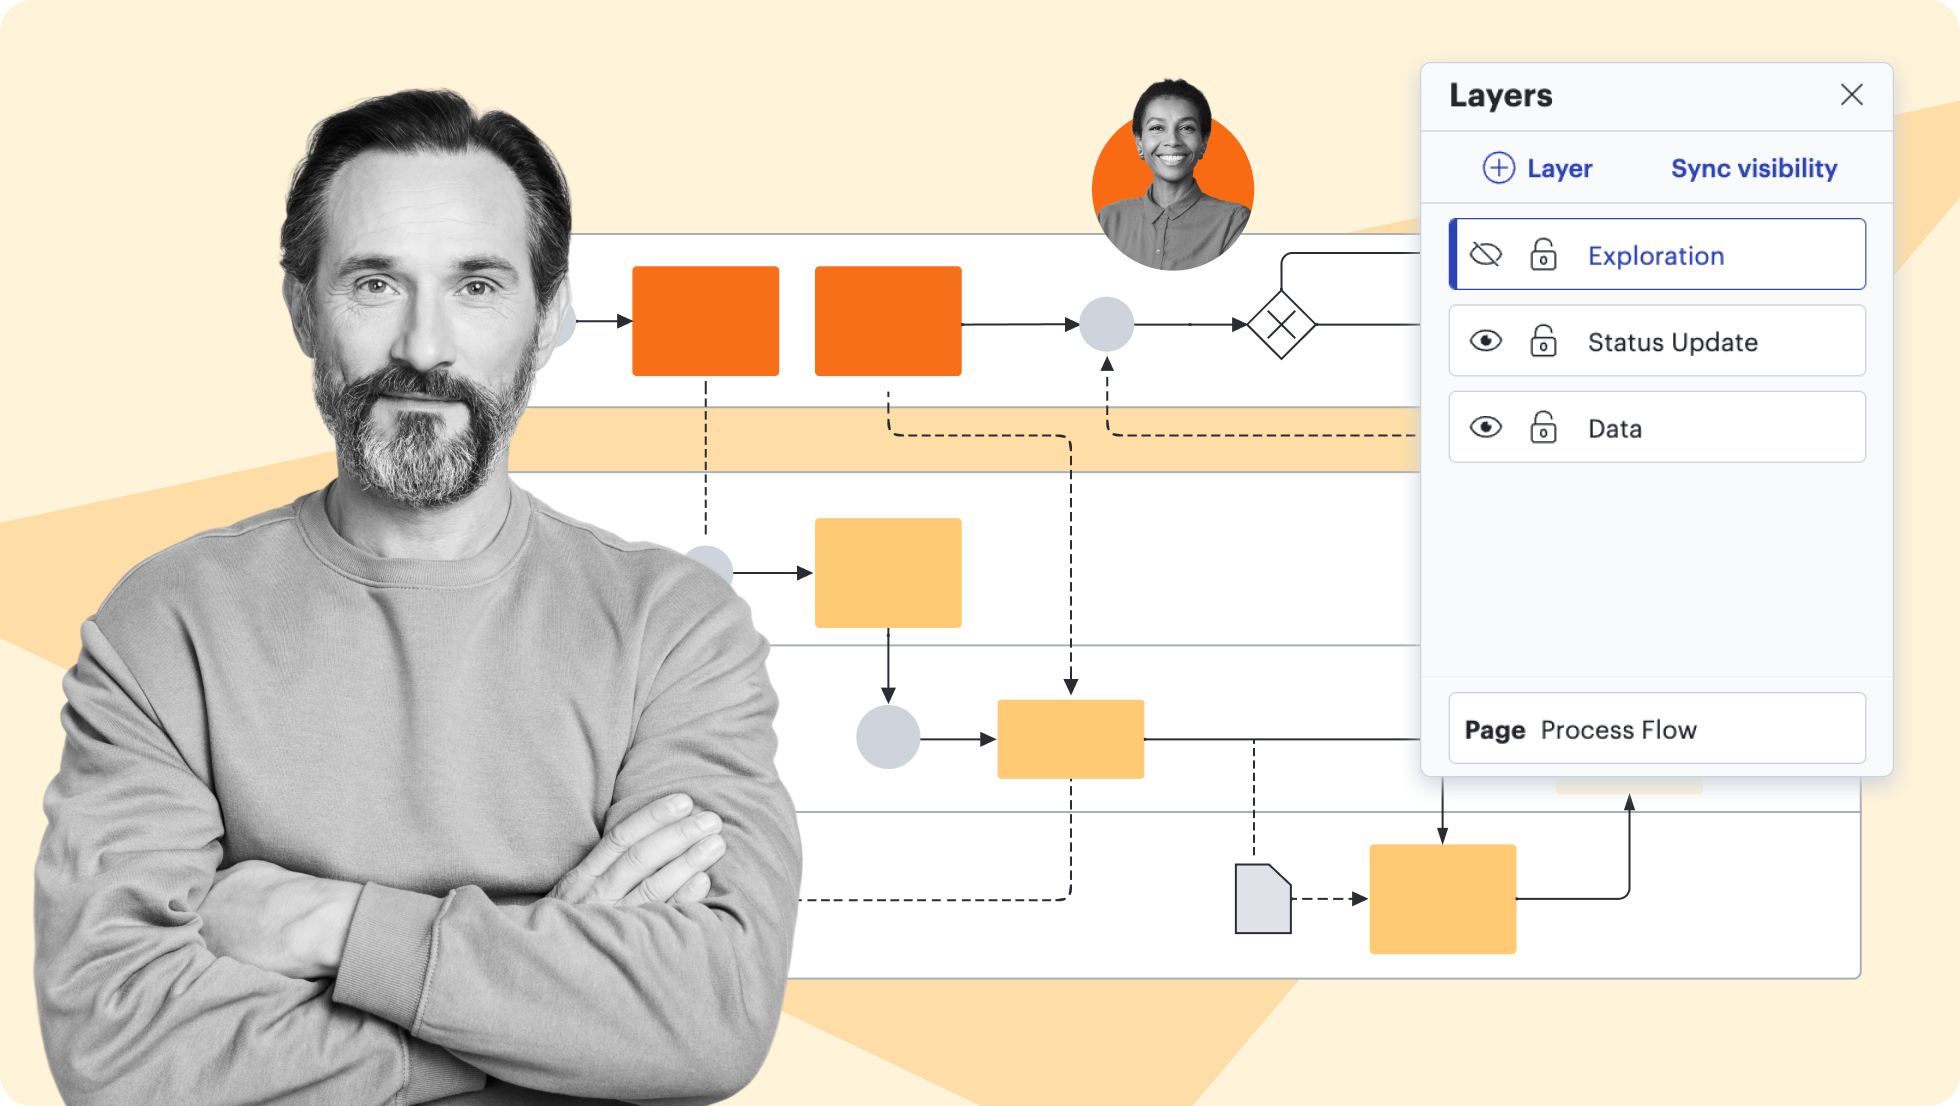
Layers
Layers
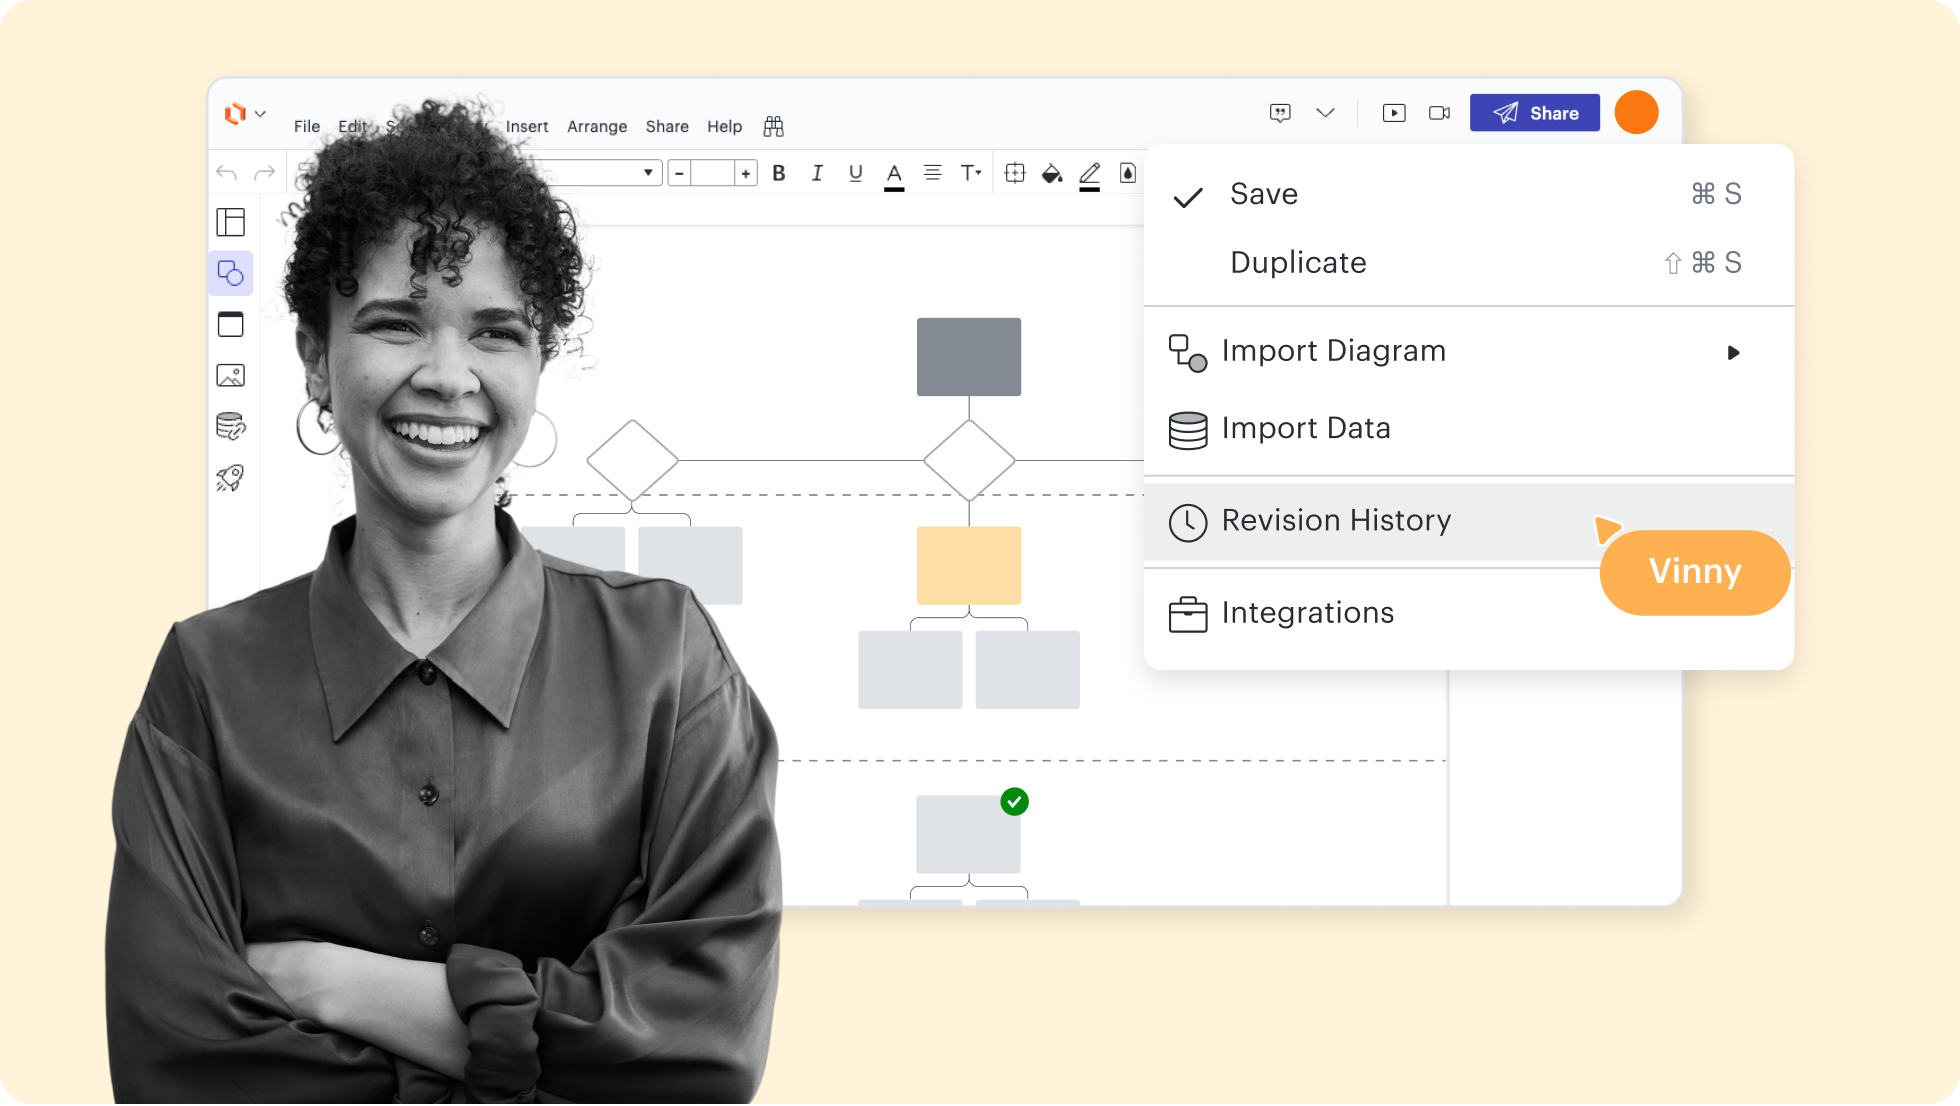
Revision history
Revision history
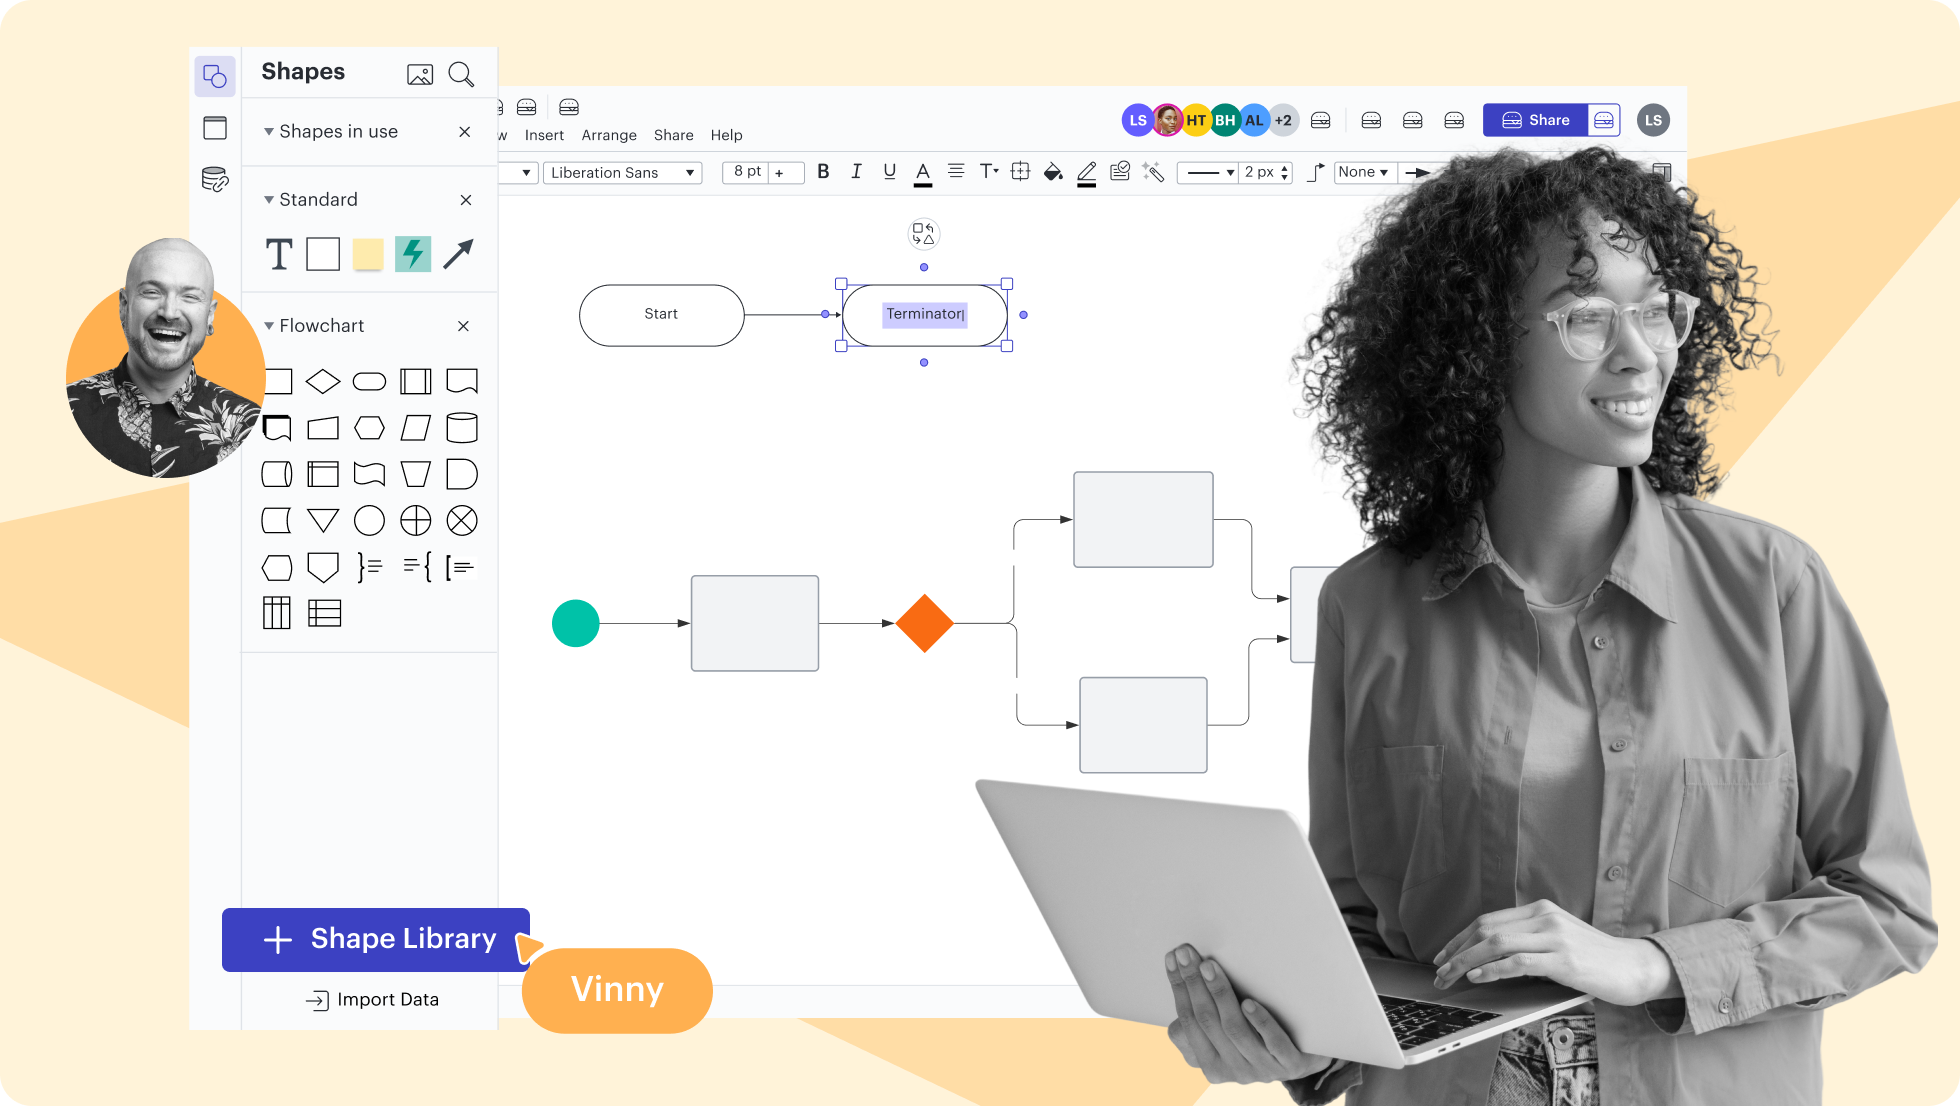
Shape libraries
Shape libraries
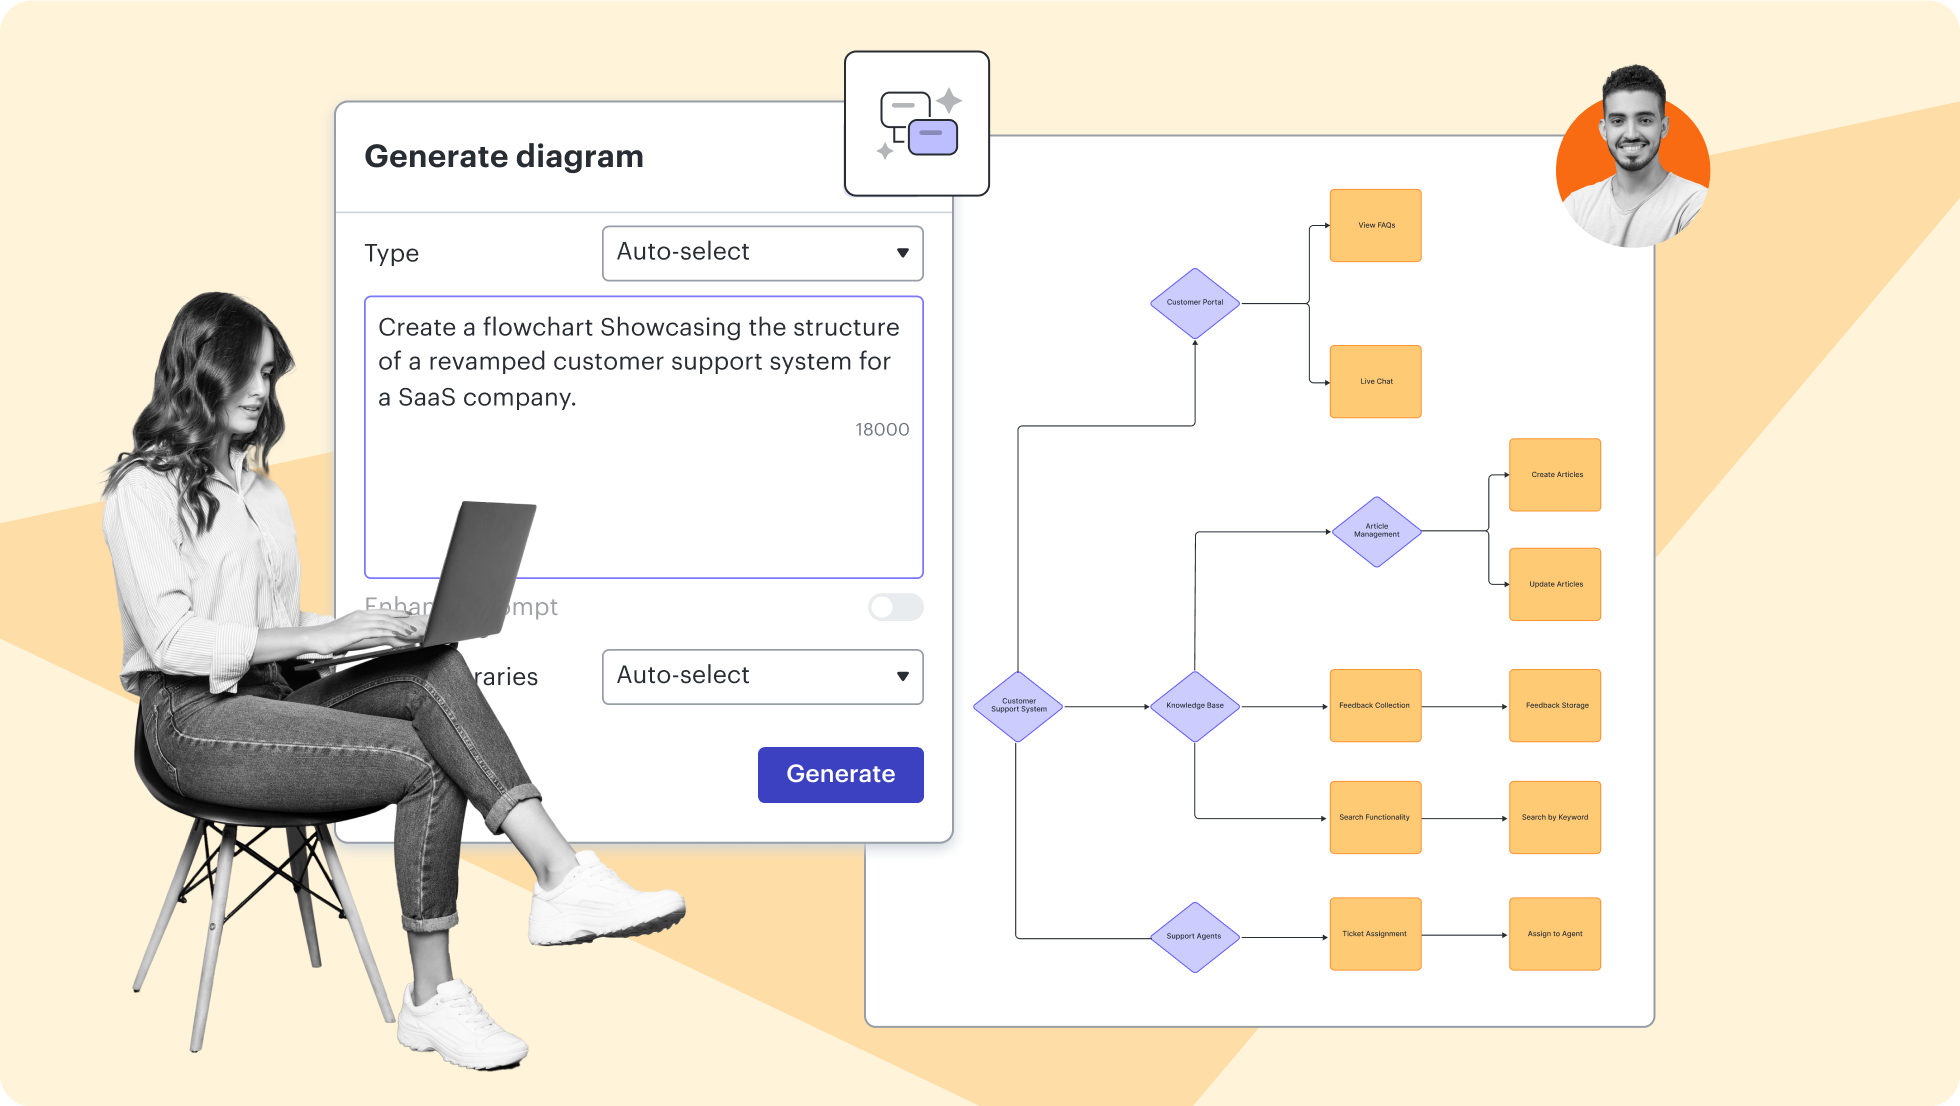
AI prompt flow
AI prompt flow

Lucidchart feature highlights
Streamline work by enabling multiple collaborators to create and edit the same diagram at once.
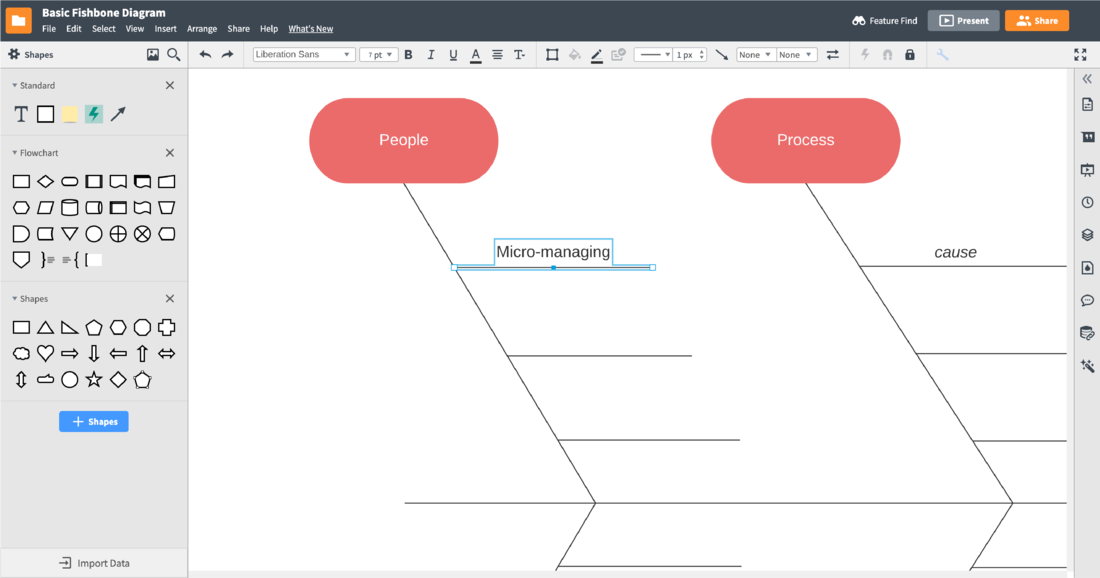
Templates to create a Fishbone diagram
Getting started in Lucidchart
Getting Started in Lucidchart
Follow along with this video tutorial and learn how to make any type of diagram in Lucidchart.
Why teams choose Lucidchart
As an intelligent diagramming application, Lucidchart provides simple yet powerful capabilities for visualizing information.

Collaboration. Bring teams together side by side on a shared canvas from anywhere in the world.
Alignment. Build transparency and shared understanding of how a team or company works.
Large-scale change. Increase visibility, standardization, and knowledge sharing across your entire org.
End-to-end workflows. Upgrade to the Lucid Suite for a complete, connected visual collaboration solution.


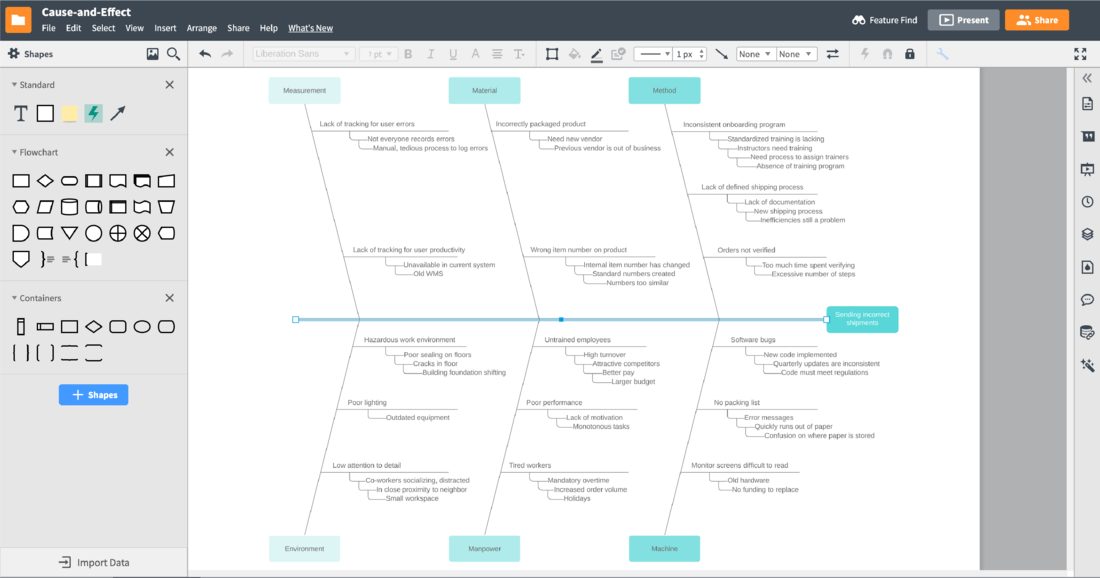
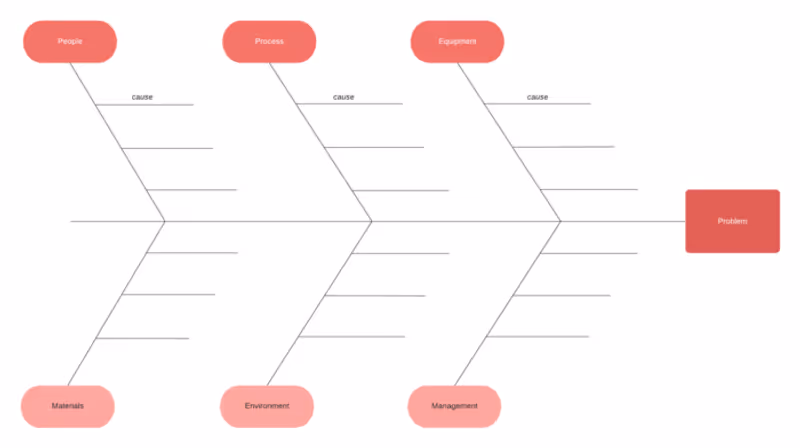
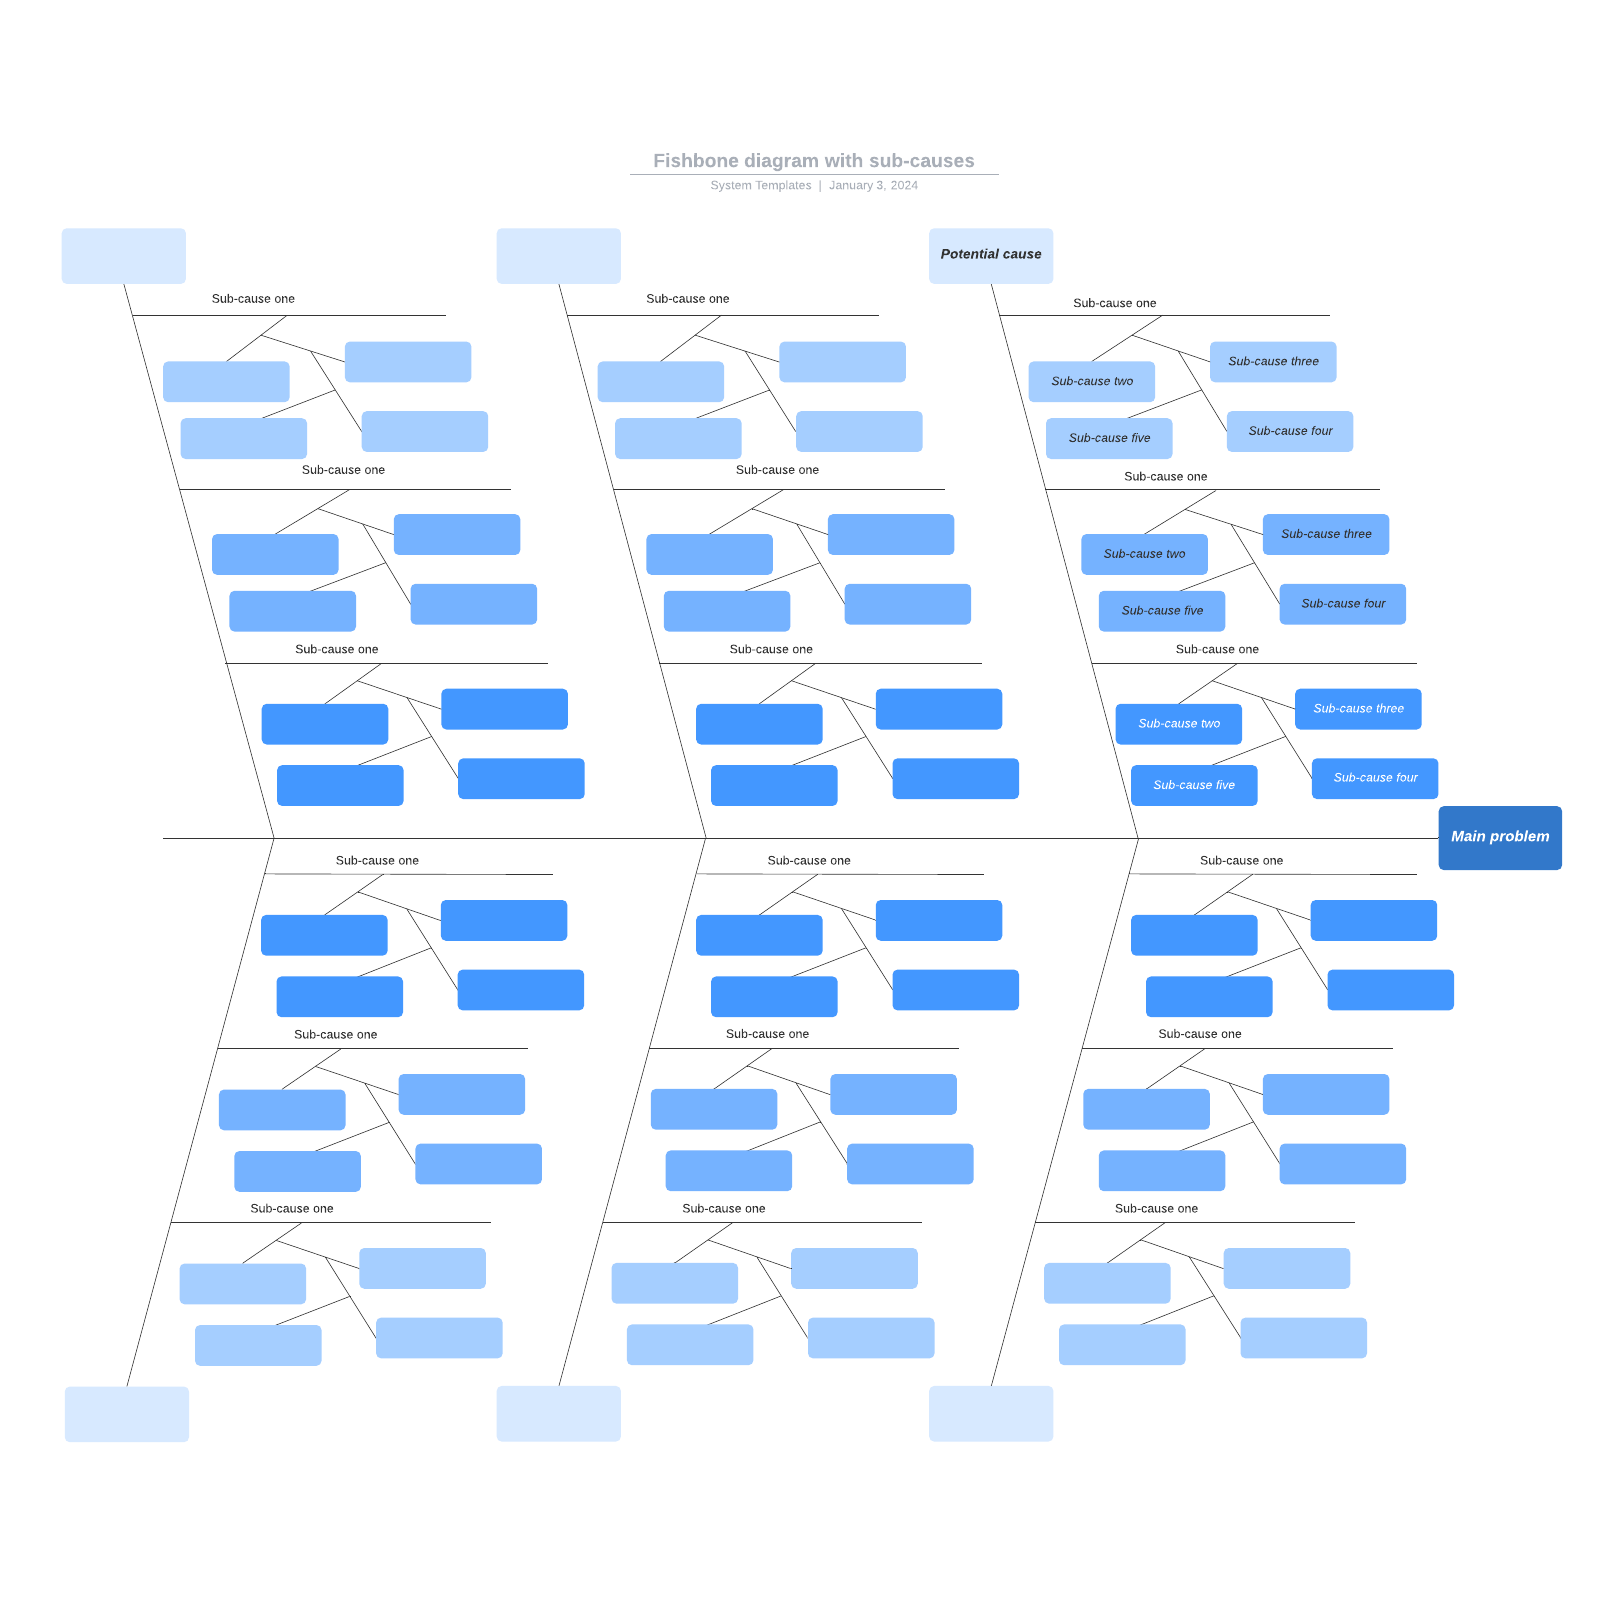
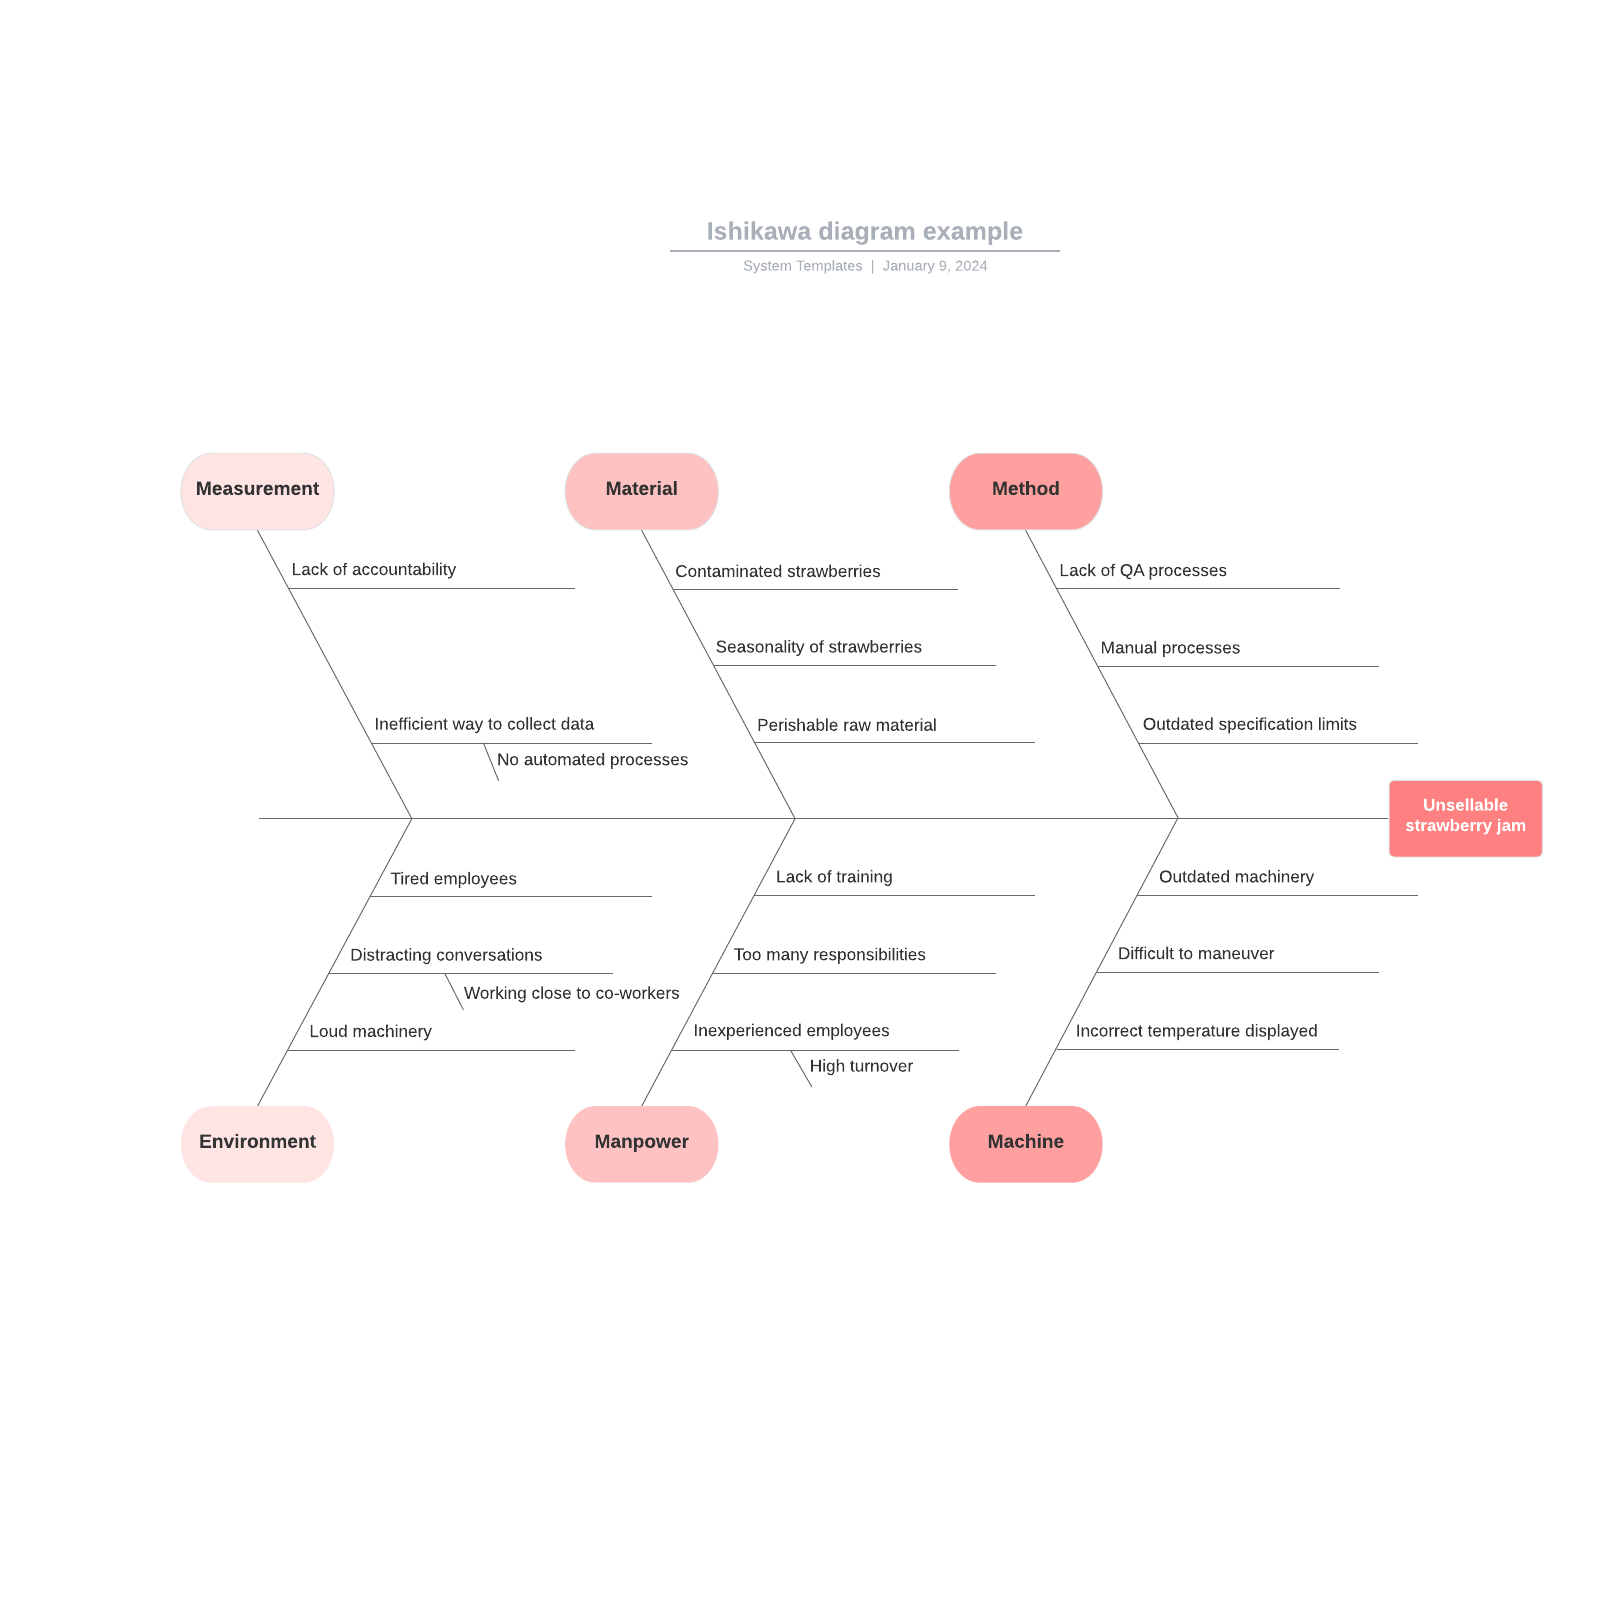
What is a fishbone diagram?
A fishbone diagram is also known as an Ishikawa diagram, herringbone diagram, or cause-and-effect diagram. This is because it describes the potential causes of a given problem or outcome. The diagram resembles an actual fish bone, with a long line running down the center pointing to the main outcome, also called the "problem statement". The other bones branch out from the middle bone and represent different categories of causes.
Additional Lucidchart resources

Lucid Training Labs
Learn visual collaboration skills in free, self-serve courses and live training workshops.

Lucid Community
Connect with other users to share tips and insights. Provide feedback to Lucid’s product team.
Help center
Find detailed articles with step-by-step instructions for using specific Lucid features.

Lucidchart tutorials
Go to the Lucidchart tutorials playlist on YouTube for video training on various topics.
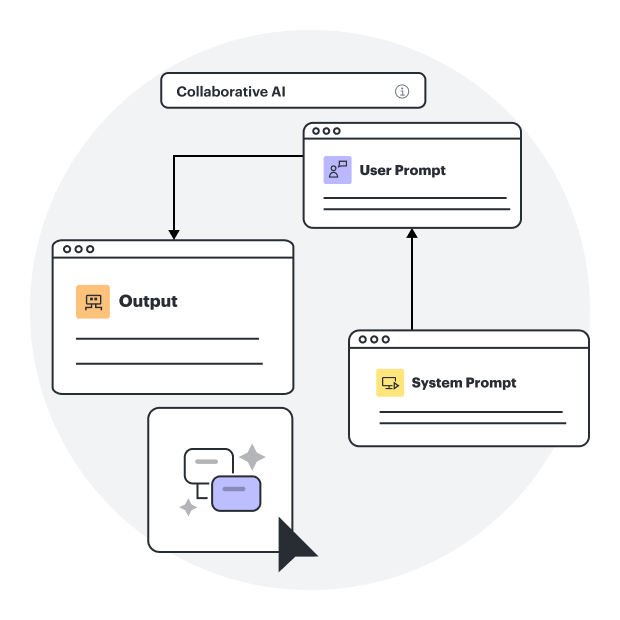
Collaborate with AI
Get an overview of Lucid’s AI functionality and find additional resources.
Lucid blog
Explore tips for optimizing collaboration, aligning teams, and driving initiatives in Lucidspark.

Lucidchart pricing
Create a free account and compare options for paid Individual, Team, or Enterprise plans.
Frequently asked questions about diagramming in Lucidchart
How do I create and use lines in Lucidchart?
How do I add and modify text in my diagram?
How long does the free trial last?
What other templates does Lucidchart have for brainstorming and process analysis?
Everything you need to make a diagram
In addition to our fishbone diagram maker, Lucidchart offers support and training resources to help you branch out to any type of diagram.
Lucid Training