Contents
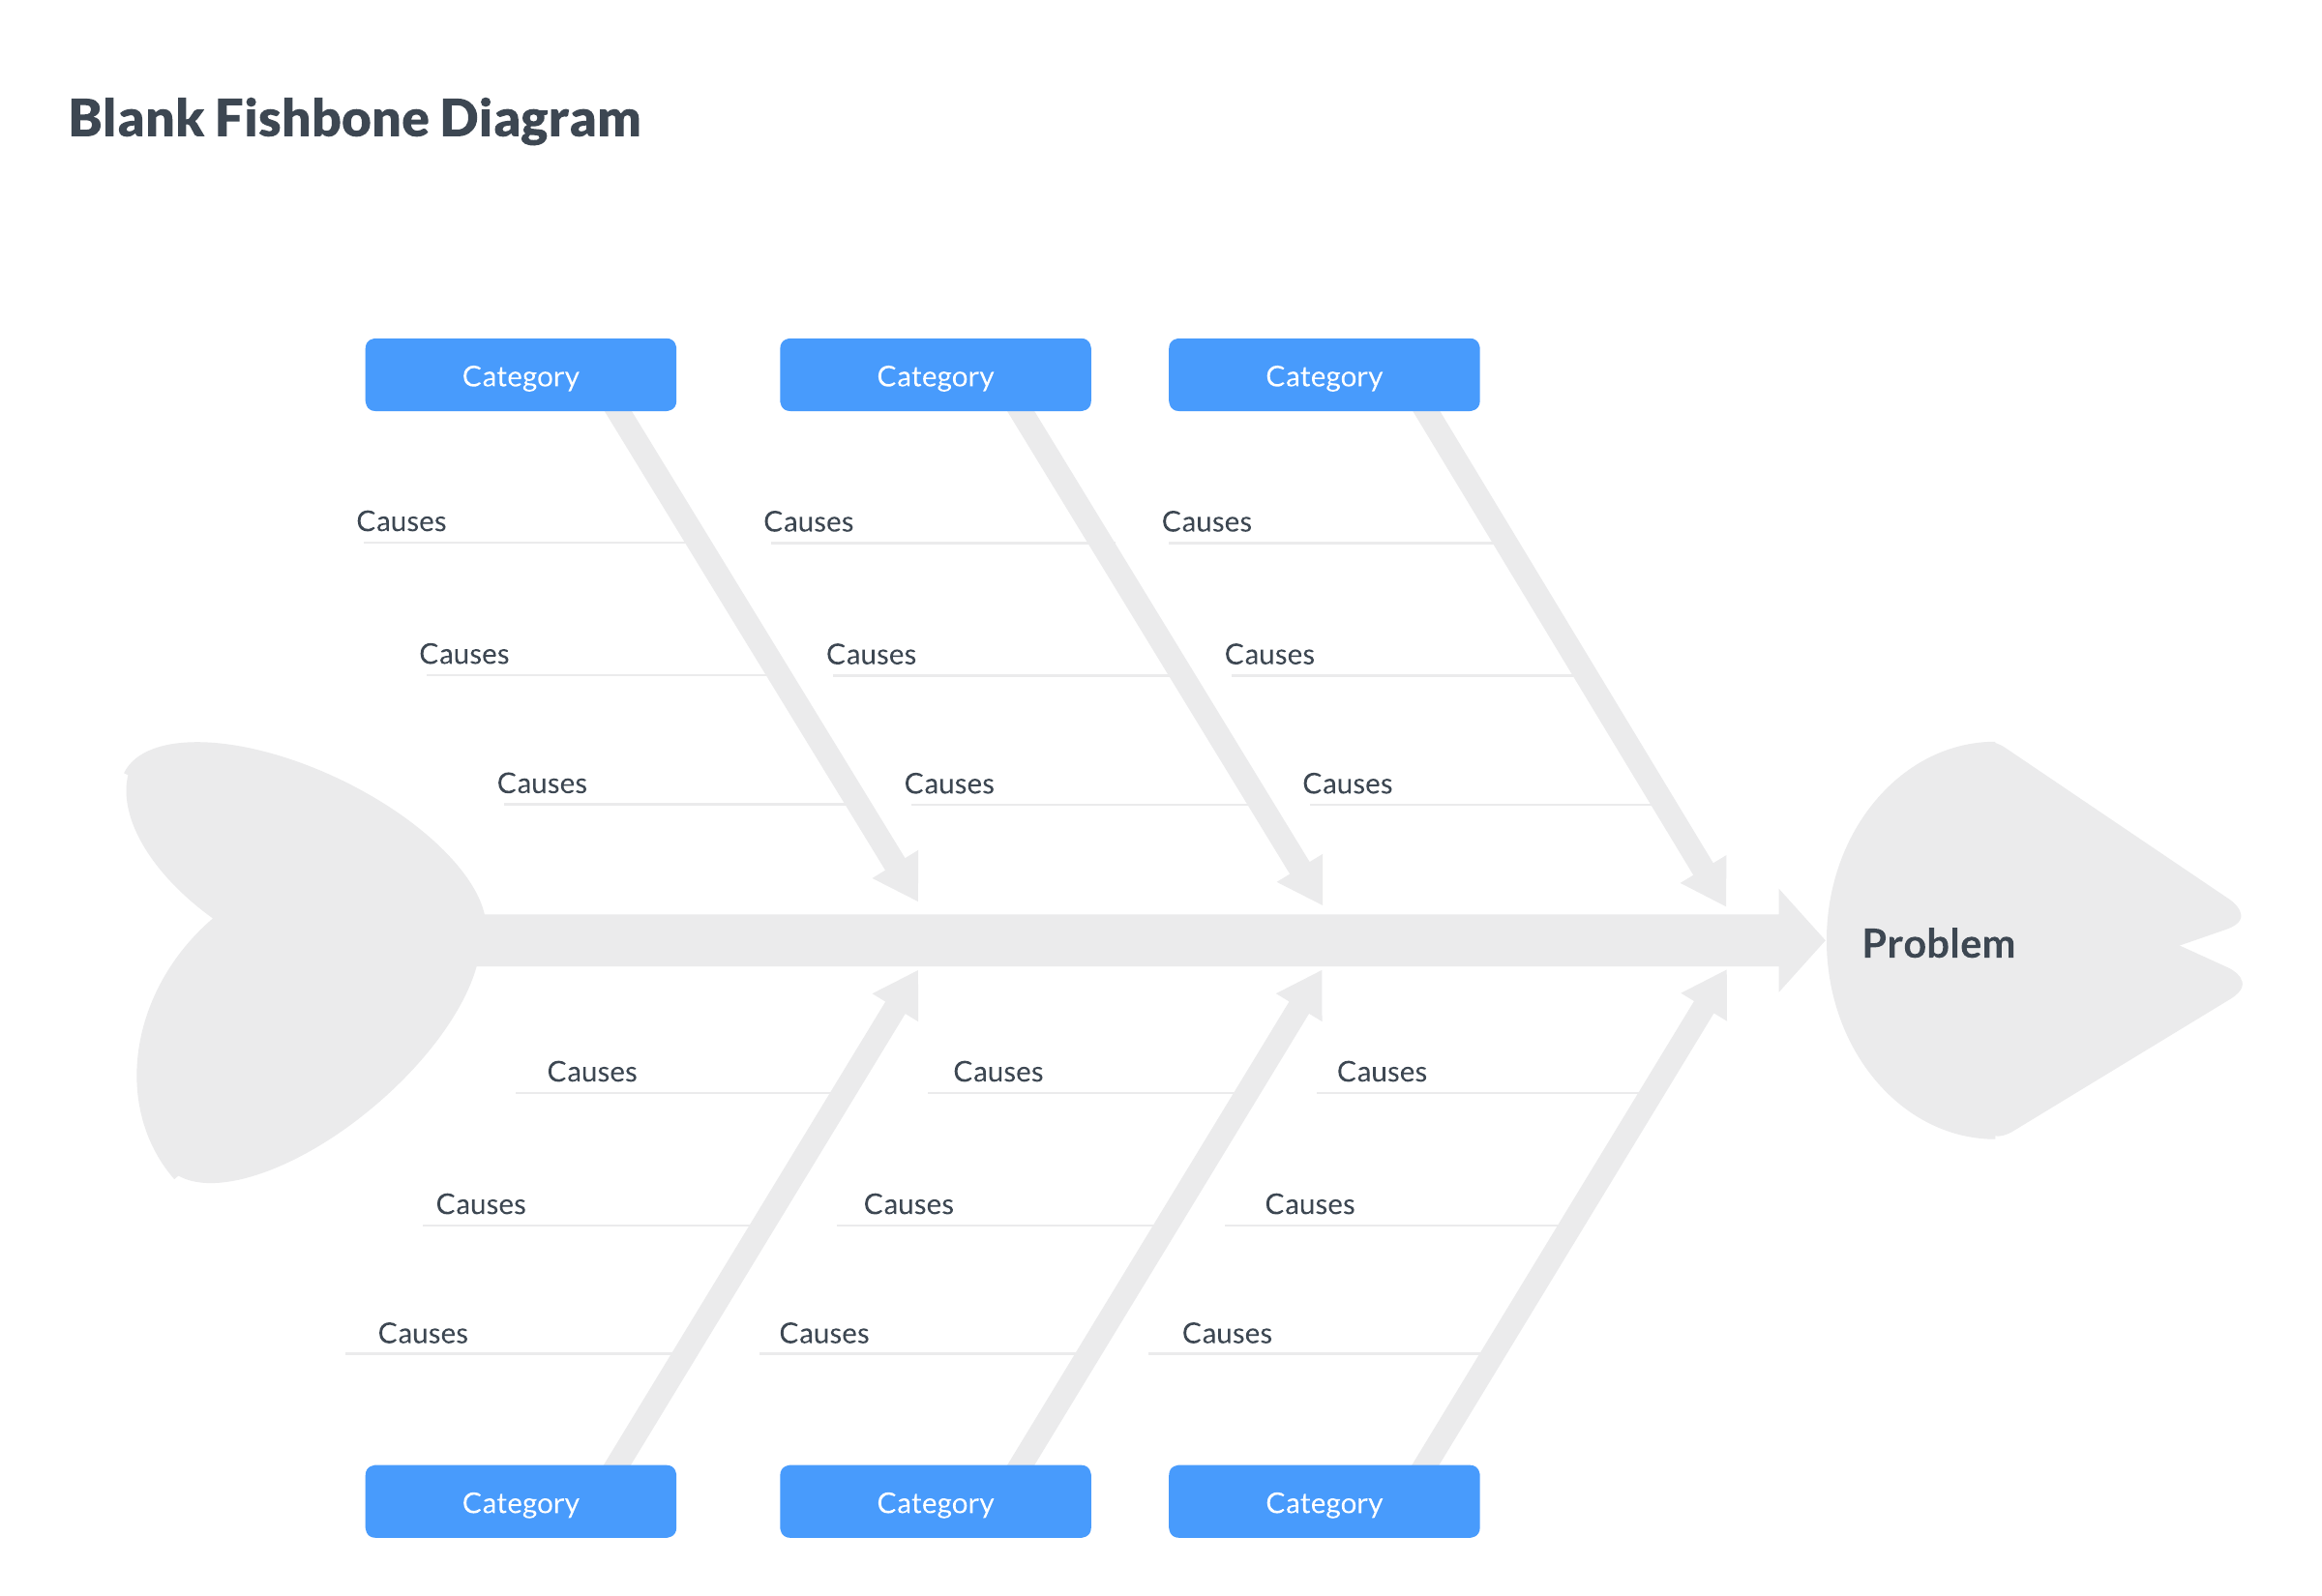
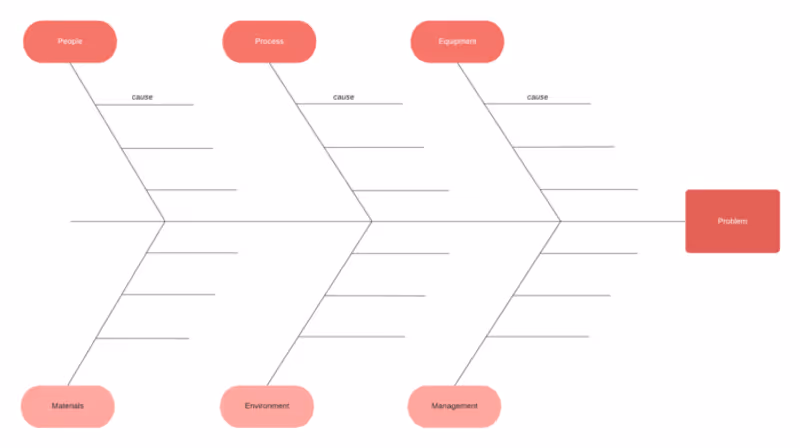
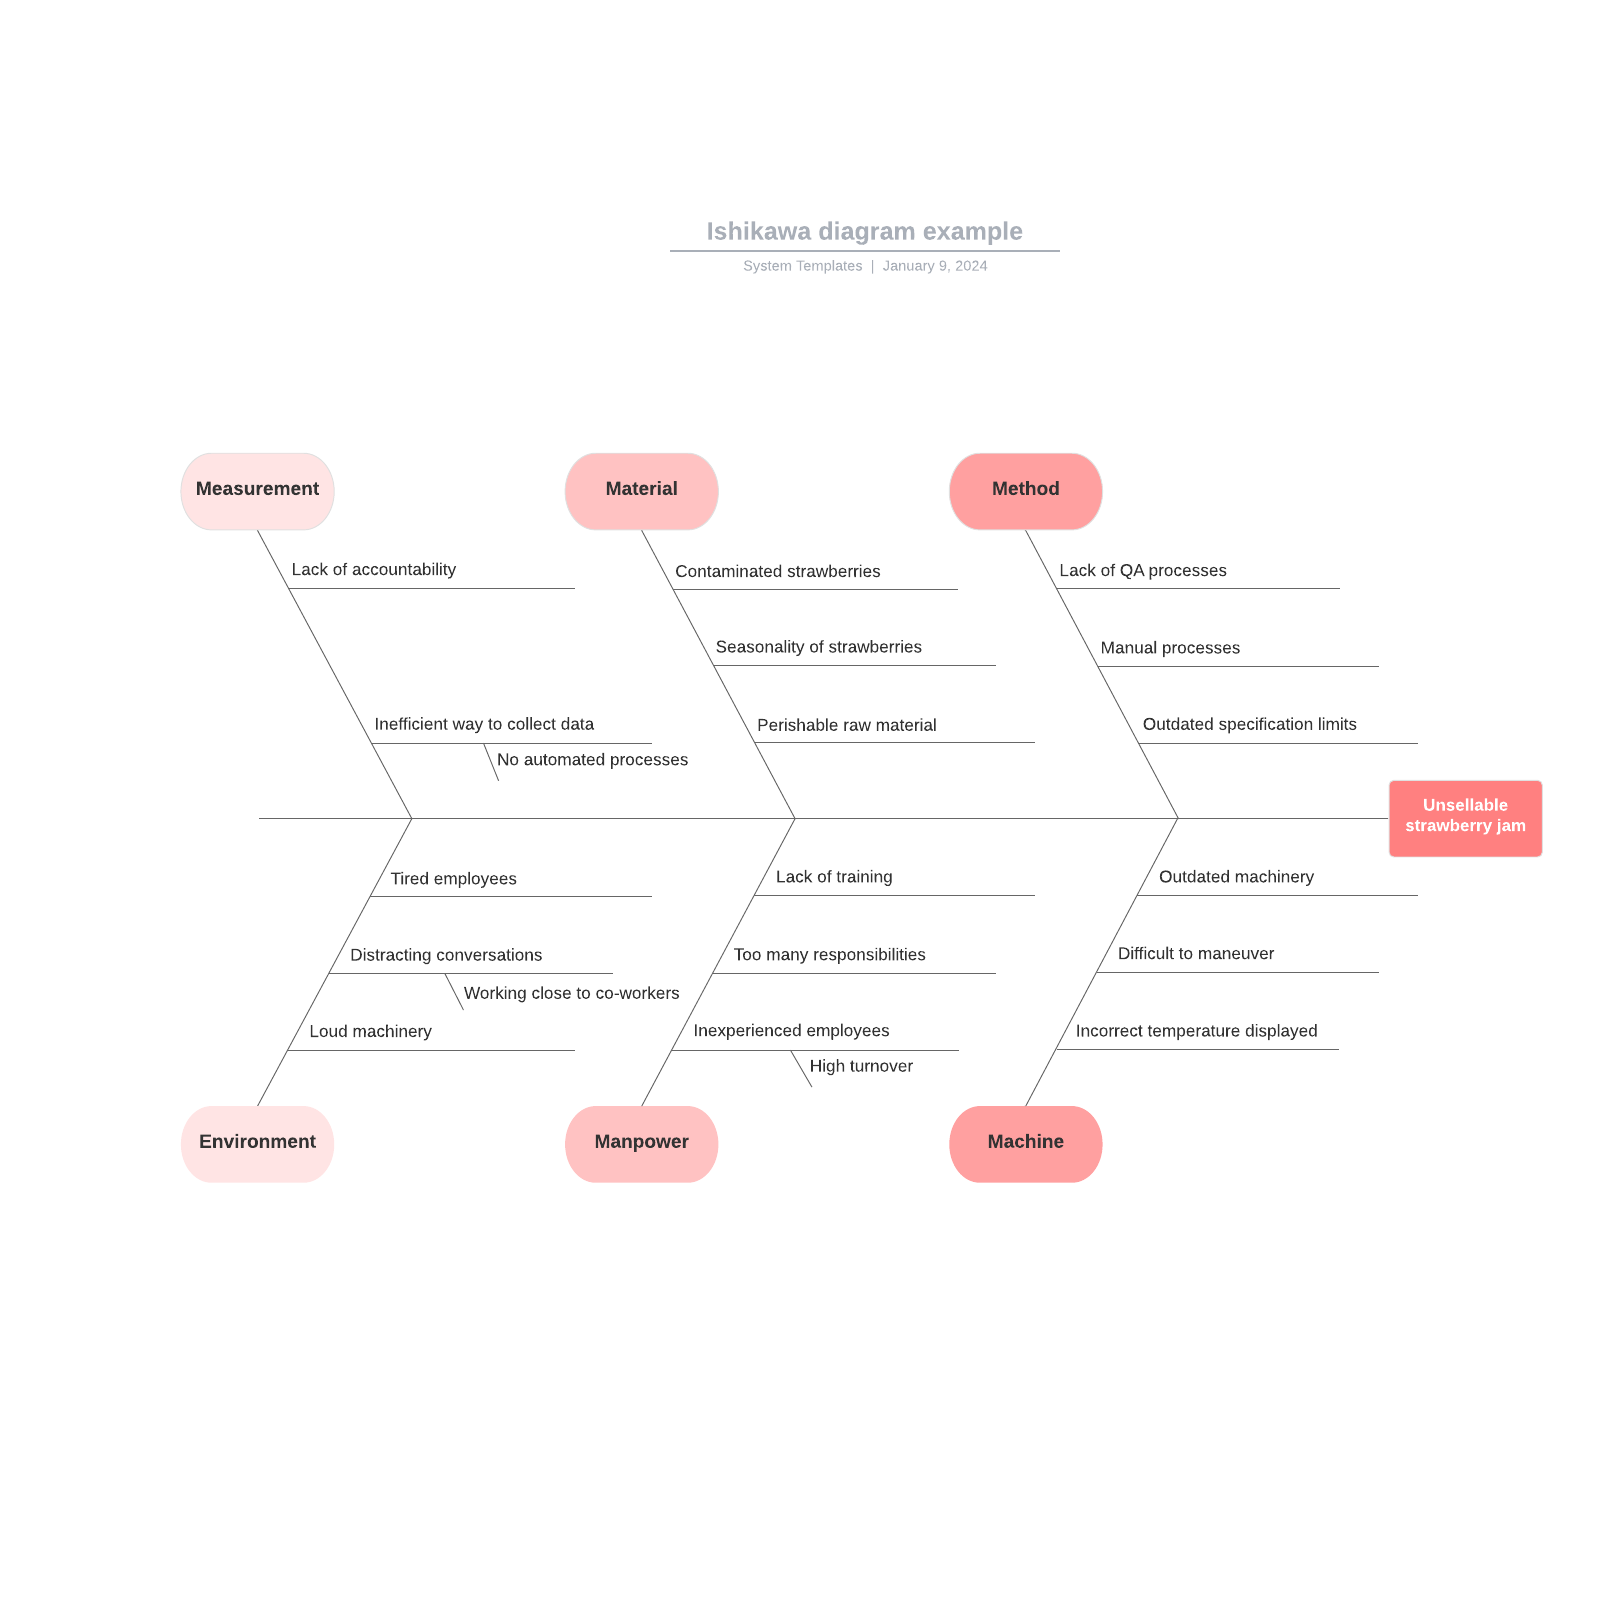
What is a fishbone diagram?
5 min
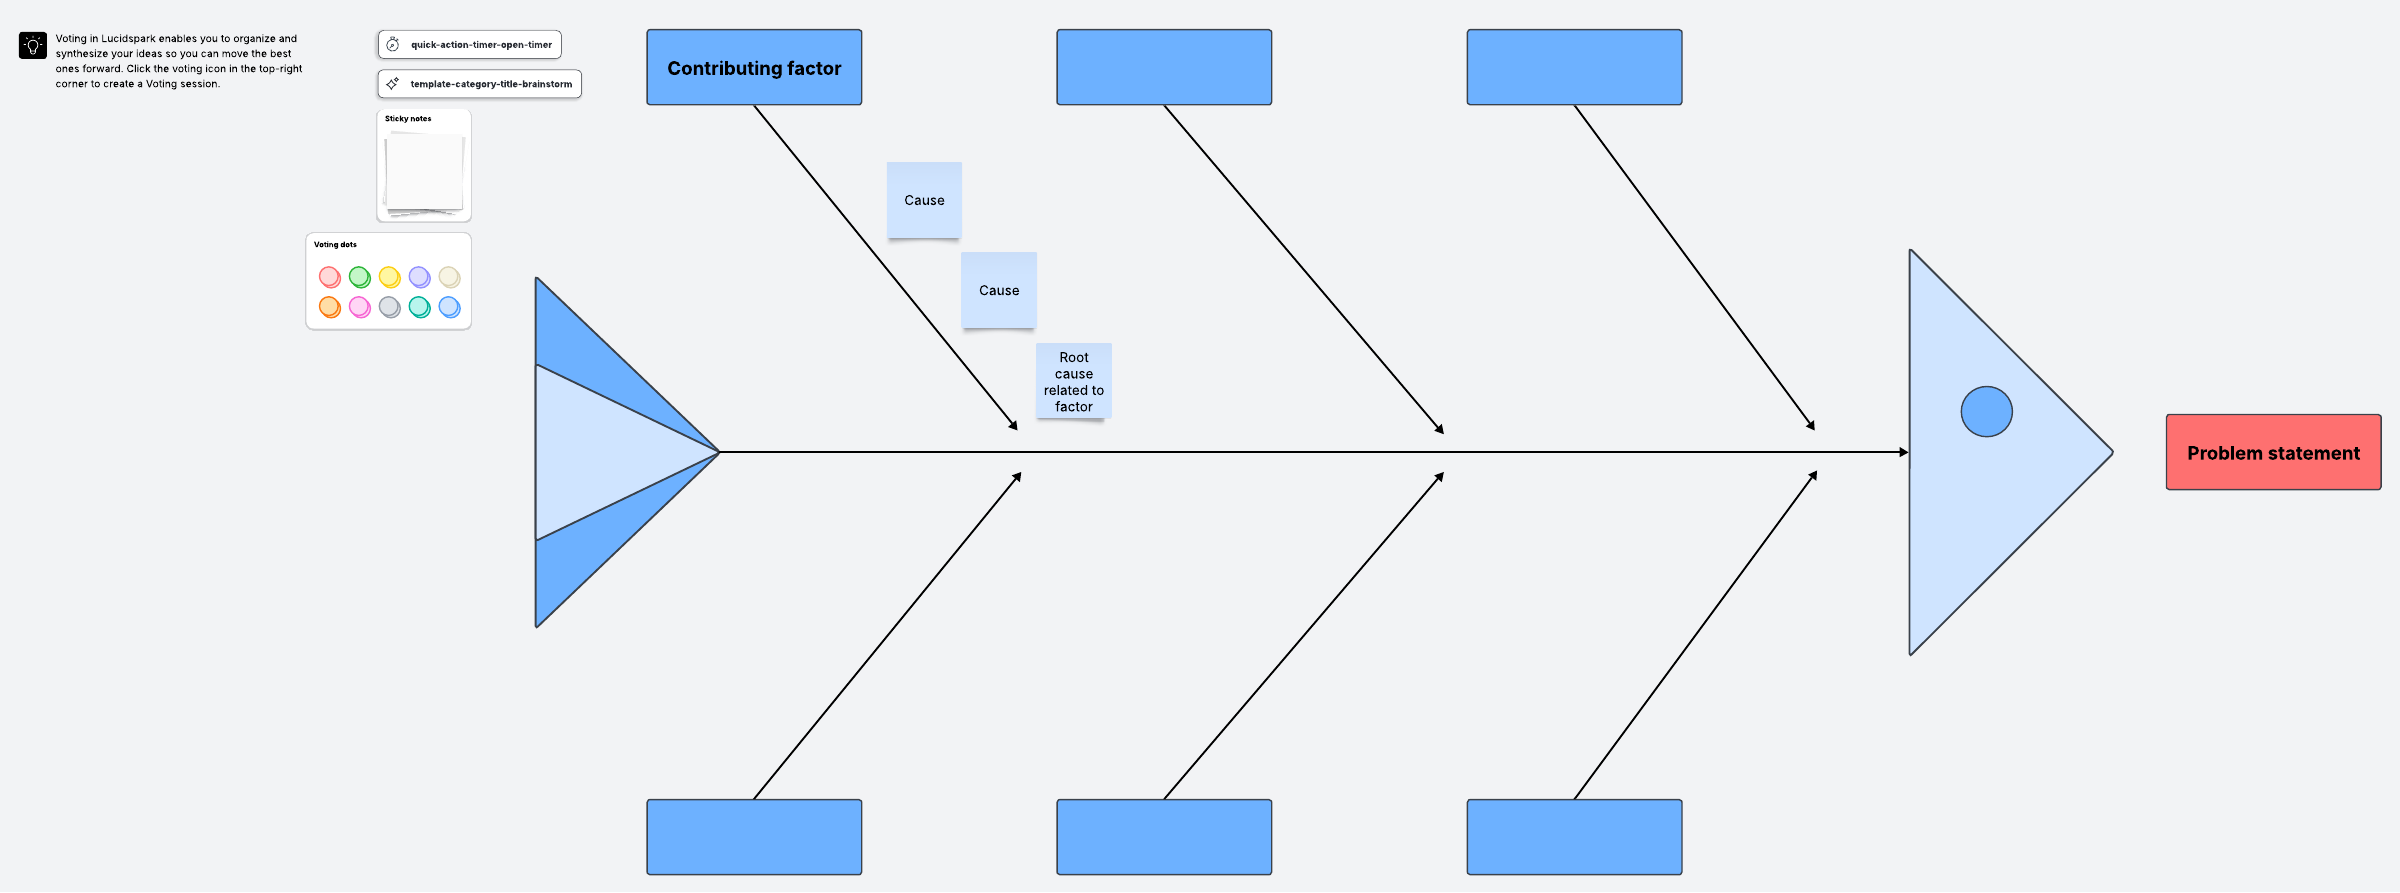
Templates to create a fishbone diagram
Get inspired and document your ideas faster with free, customizable templates.
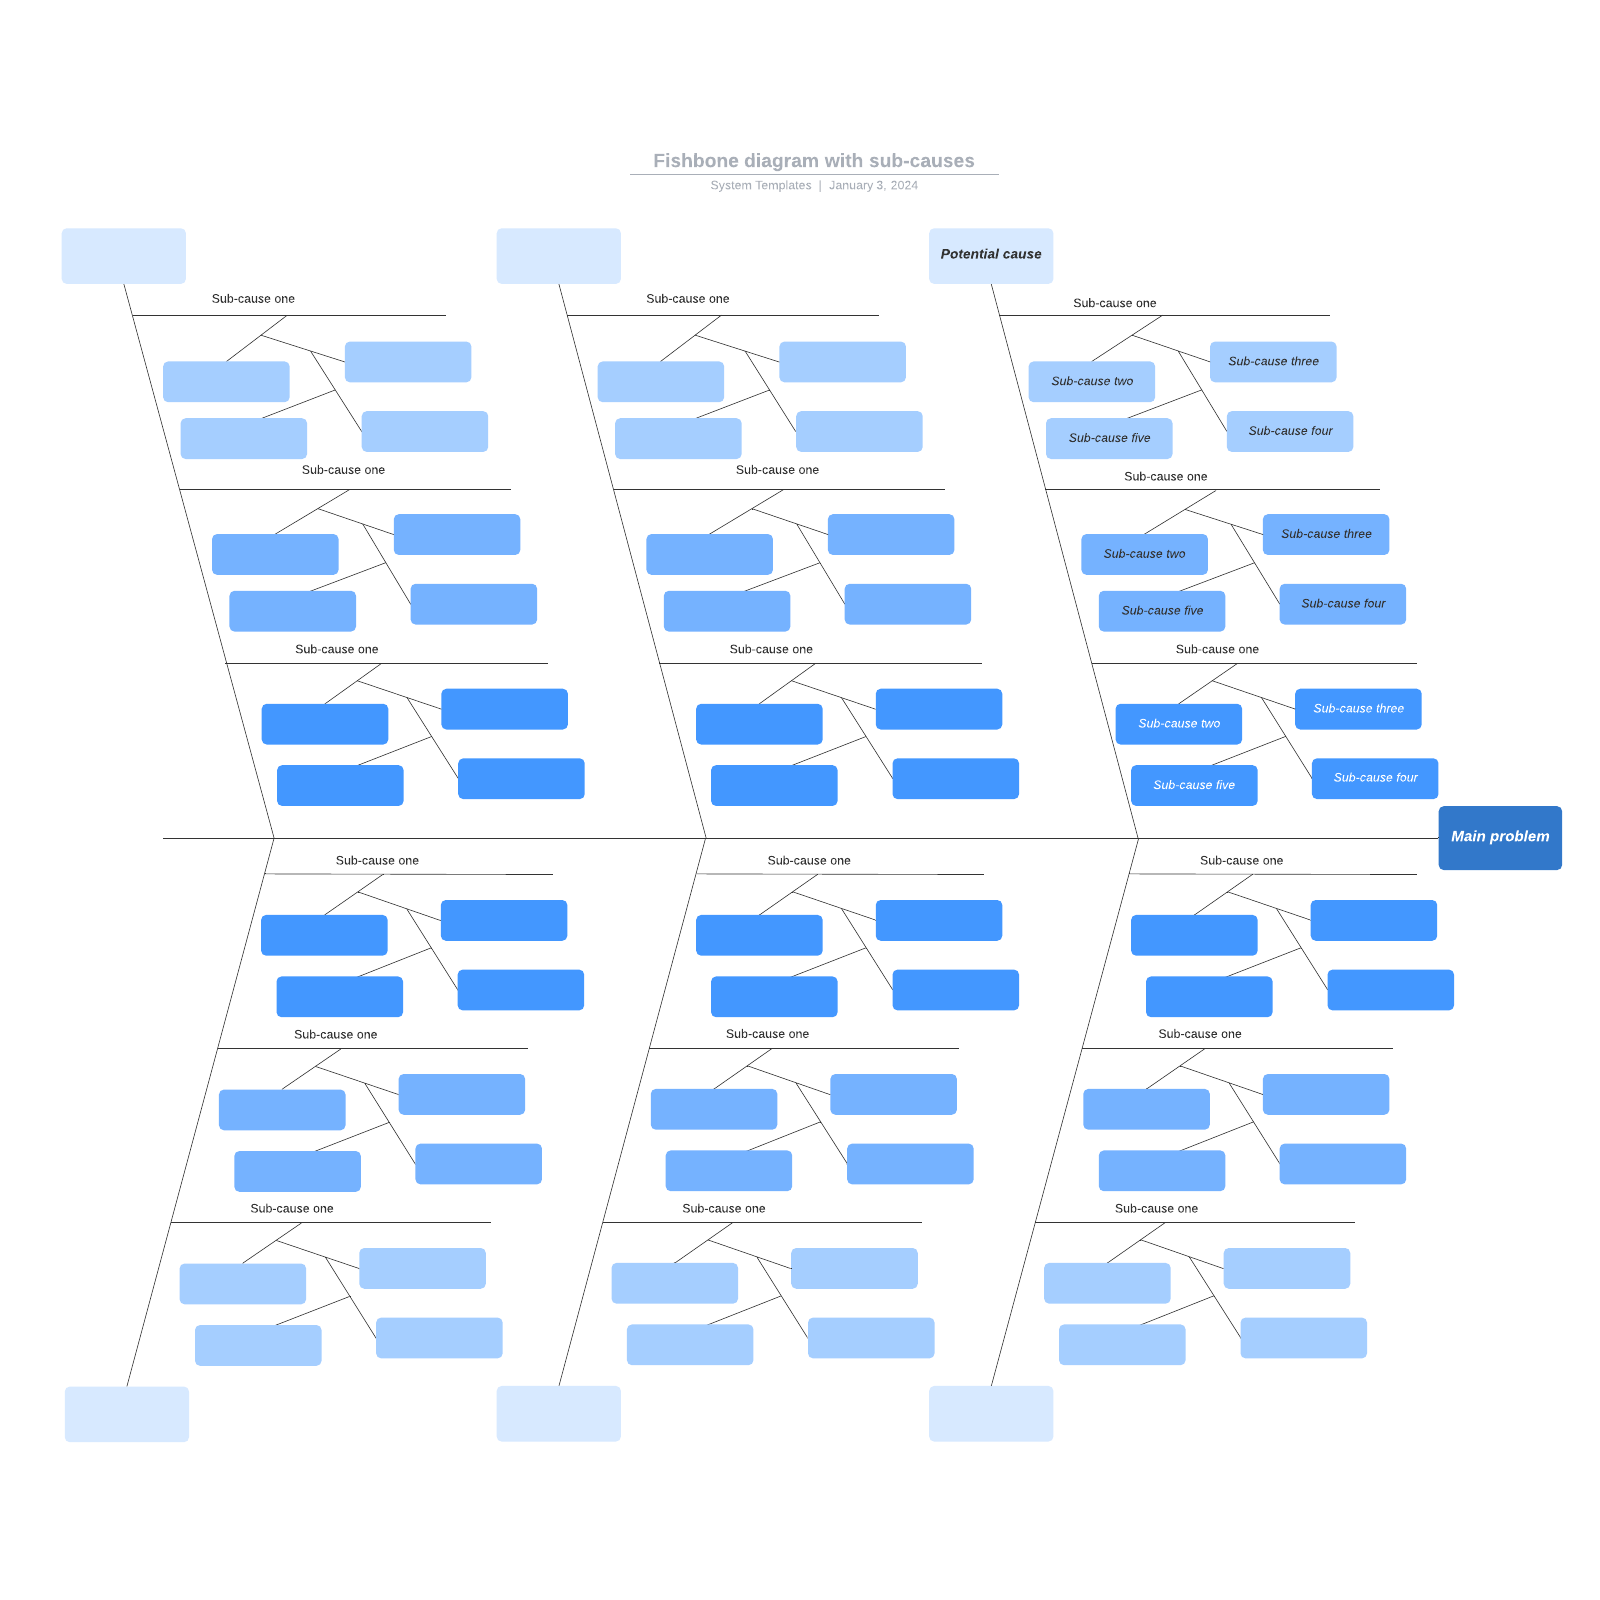
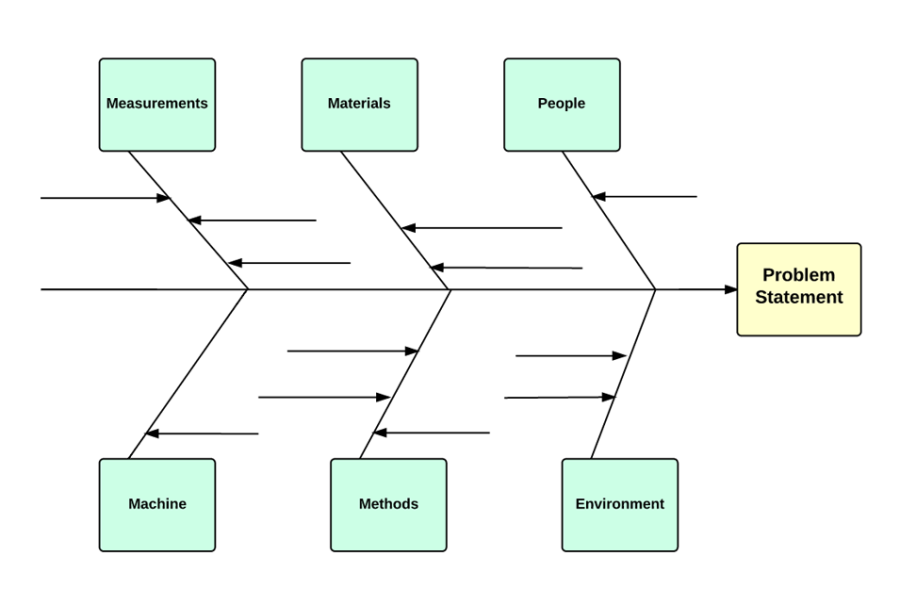
Fishbone diagram with sub-causes
Pricing:
Paid Account
Fishbone diagram with sub-causes, Pricing: Paid Account
Additional resources
Fishbone diagram maker
Lucidchart offers drag-and-drop shapes, customizable templates, layers, conditional formatting, and other intelligent features that will make it simple to build your fishbone diagram.
How to make a fishbone diagram in Word
This step-by-step guide will explain how to create fishbone diagrams in Microsoft Word, both from scratch and using a Lucidchart template.
How to make a fishbone diagram in PowerPoint
Share a cause-and-effect analysis in your slide presentations by learning how to add fishbone diagrams to Microsoft PowerPoint.
Frequently asked questions
What is a fishbone diagram?
When should I use a fishbone diagram?
How do I create a fishbone diagram?
What are the typical categories used in a fishbone diagram?
What are the benefits of using a fishbone diagram?
How does a fishbone diagram differ from a cause-and-effect diagram?
Who invented the fishbone diagram?
What is the purpose of a fishbone diagram?
How much does Lucidchart cost?
How do I create and use lines in Lucidchart?
How do I add and modify text in my diagram?
In addition to fishbone diagram templates, what other templates does Lucidchart offer?
Everything you need to make a fishbone diagram
In addition to our fishbone diagram software, Lucidchart offers support and training resources to help you branch out to any type of diagram.
View training labs