Regardless of the industry you work in, problem-solving will be a part of your job—and when an issue arises, a fishbone diagram can help you move from symptoms to likely causes so you can fix the right problem. In this article, you’ll learn all about fishbone diagrams, including how to make one in Lucidchart and use it in Visio and Excel.
What is a fishbone diagram?
A fishbone diagram is a visual used to investigate the potential causes of a given problem or outcome. It was invented by Kaoru Ishikawa as a part of cause-and-effect analysis, a way to pinpoint contributing factors in business problems, especially in the field of industrial manufacturing.
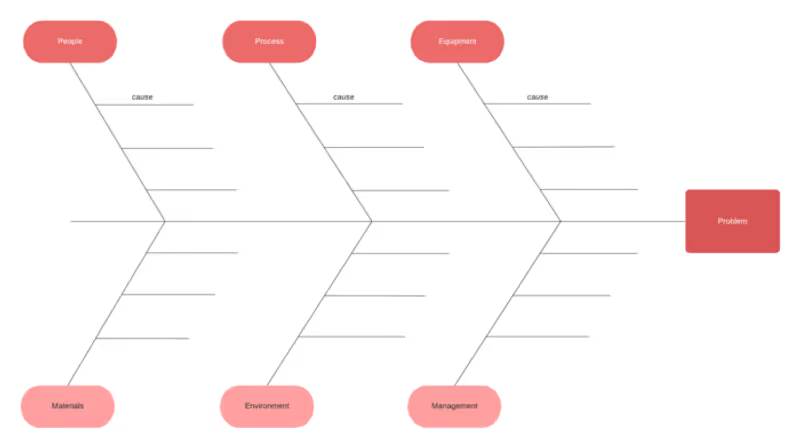
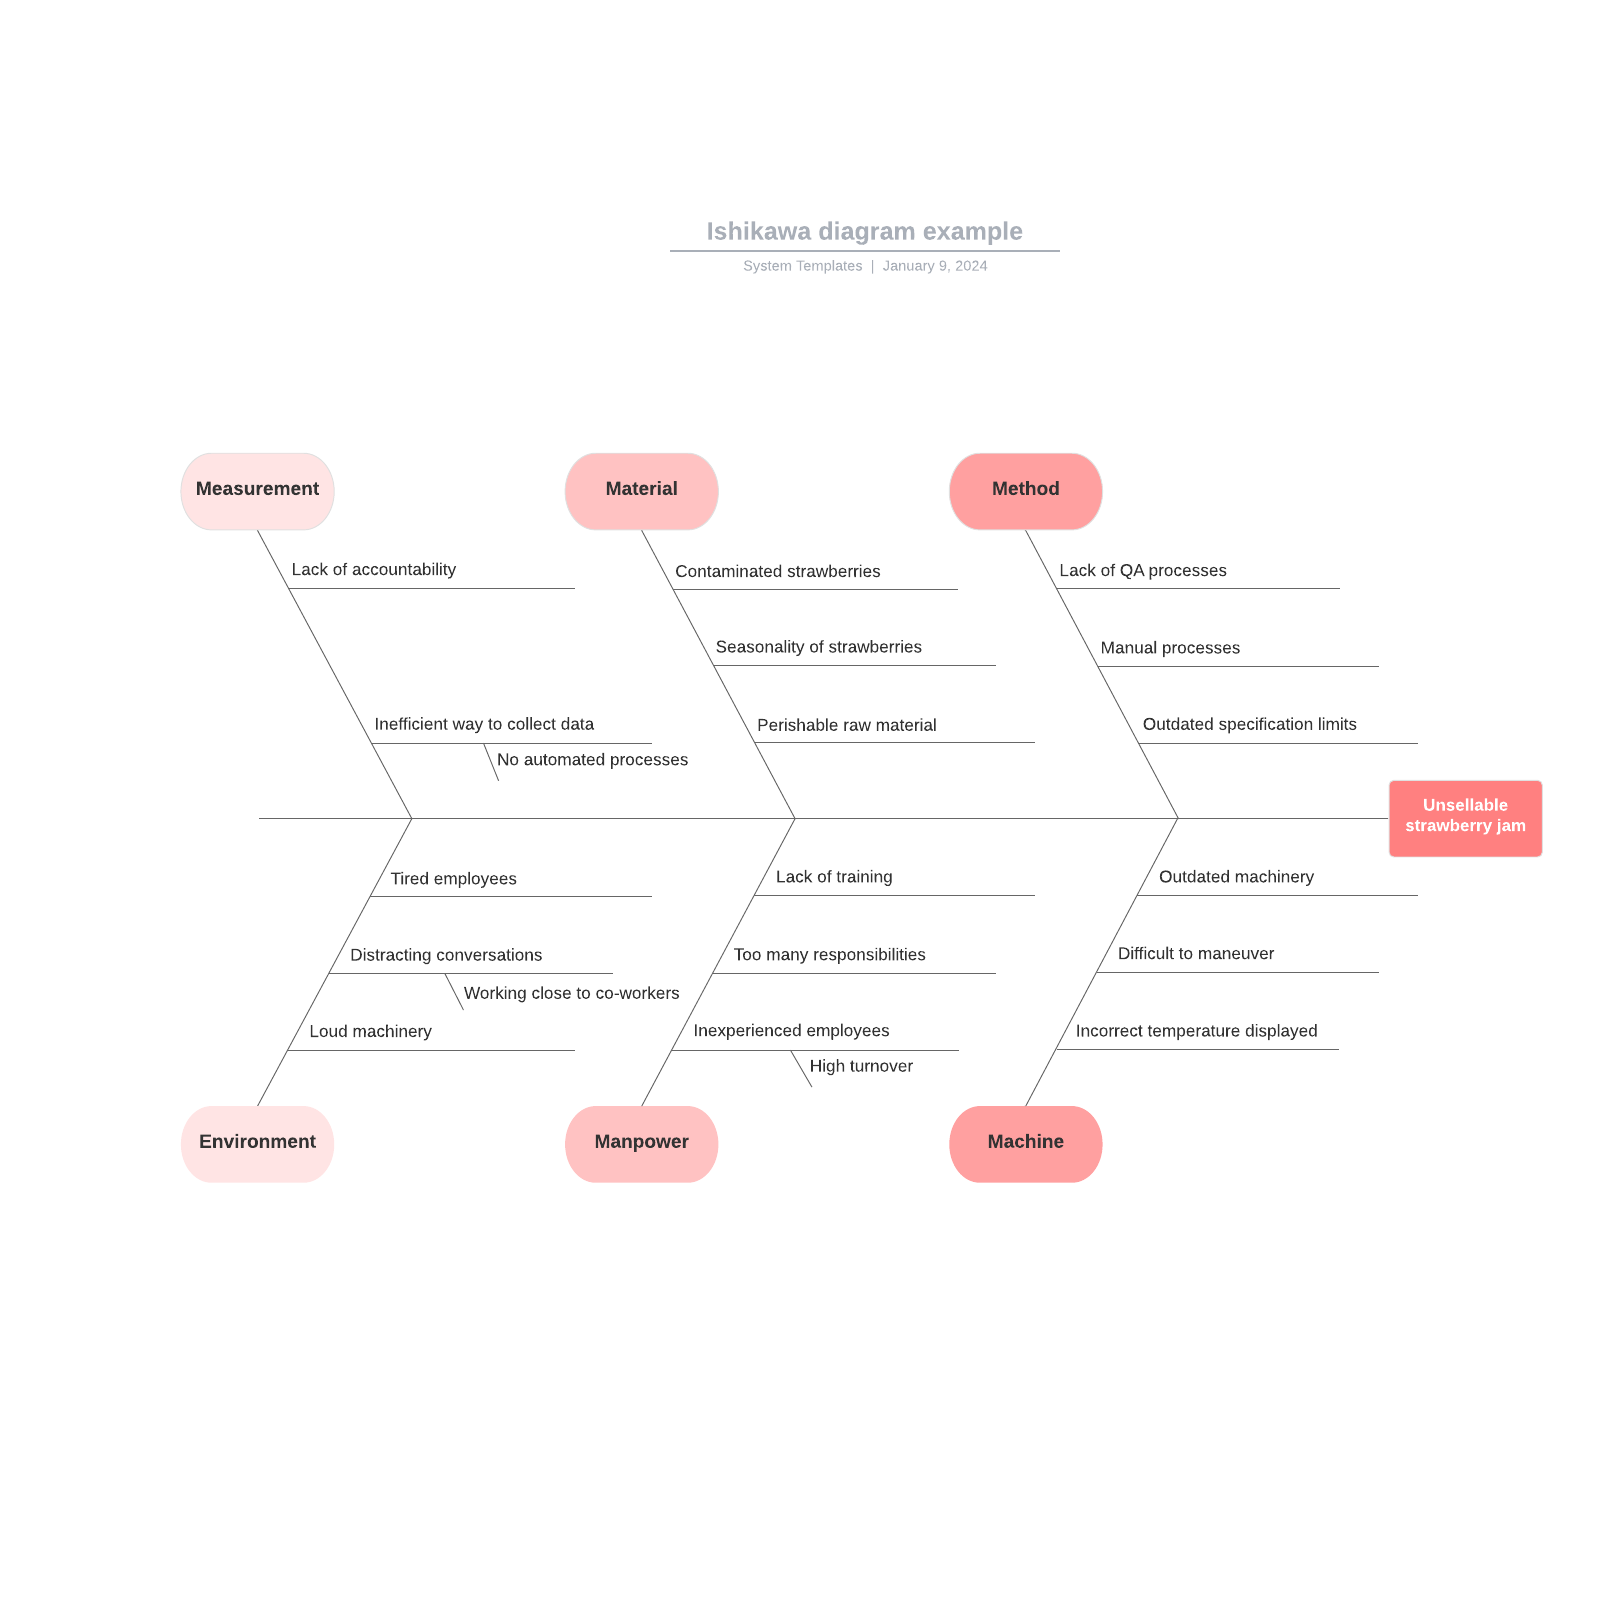
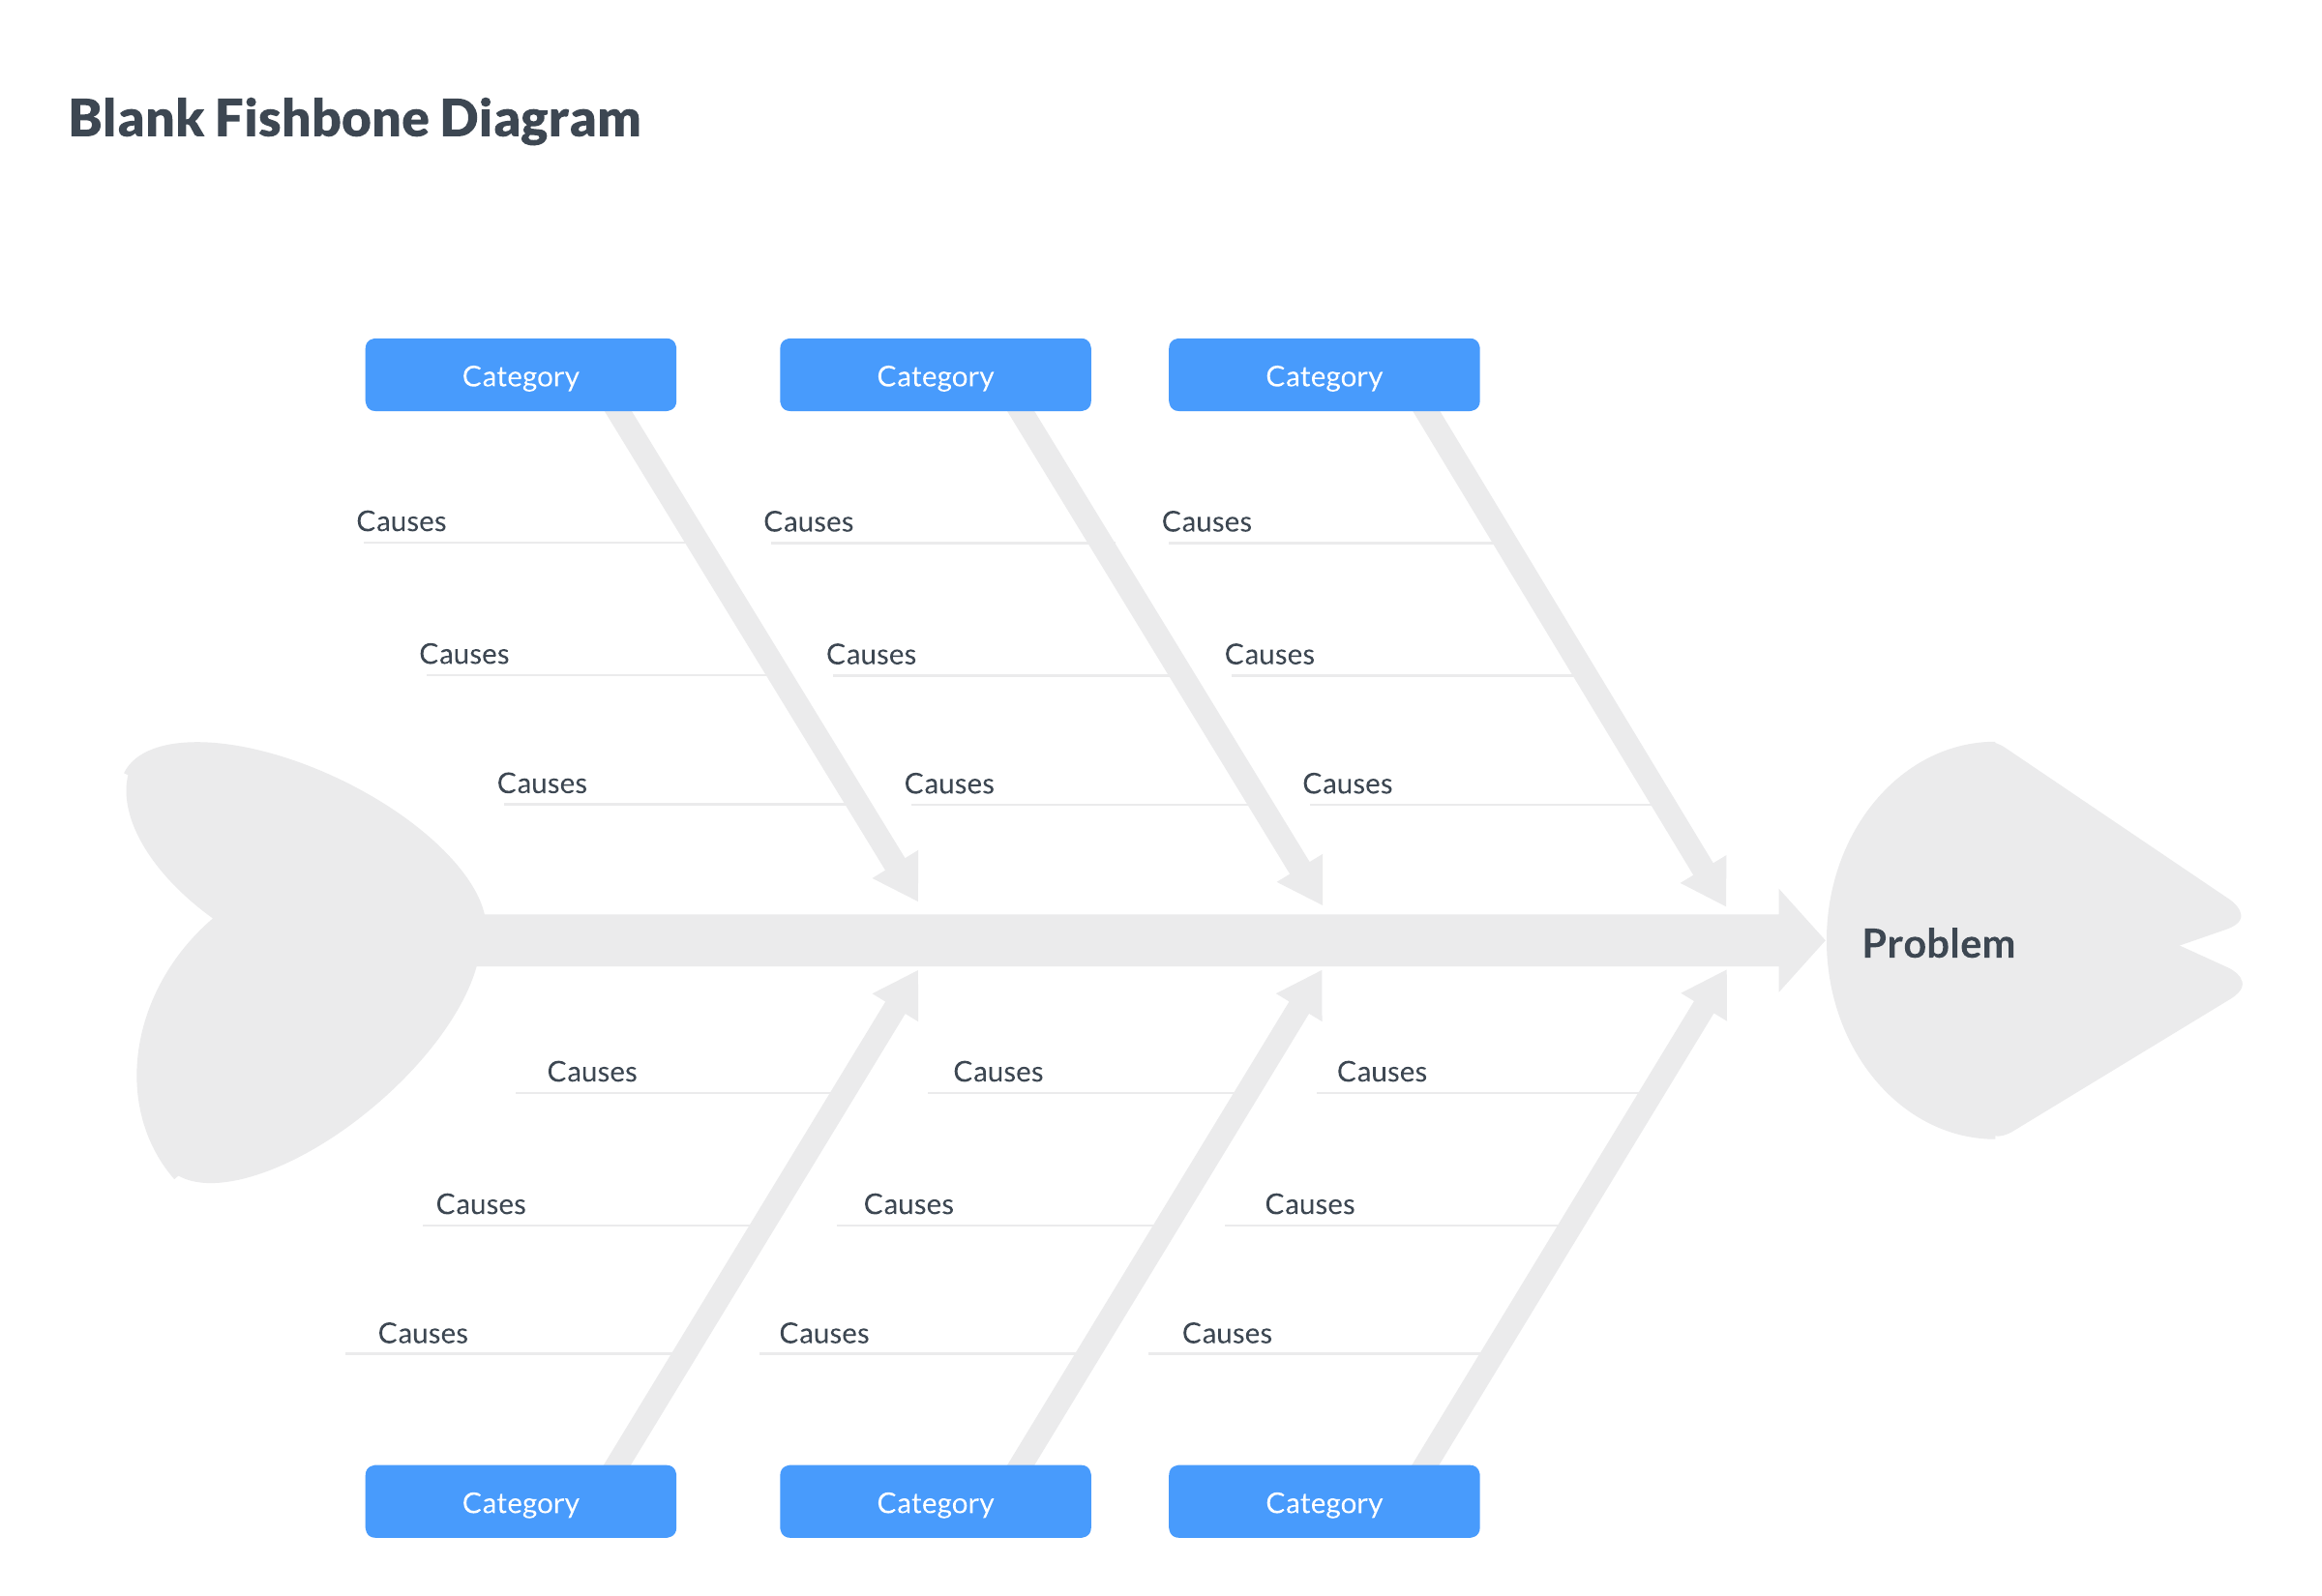
This diagram is also known as an Ishikawa diagram, herringbone diagram, or cause-and-effect diagram. It resembles an actual fish bone, with a long line running down the center pointing to the main outcome, also called the "problem statement." The other bones branch out from the middle bone and represent different categories of causes.
How to create a fishbone diagram in Lucidchart
1. Determine your problem statement
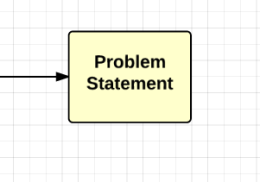
The first thing you need for your fishbone diagram is a problem statement. Since fishbone diagrams are used to analyze cause-and-effect relationships, the problem statement is the final result. Depending on your industry and use case, the problem could be anything from "shipments arrive late" to "patient readmitted to the hospital."
To clarify the problem, you should include details such as where and how often the problem occurs and who is involved. The more specific you can be, the narrower your focus is as you problem-solve.
2. List categories
Next, you'll show the categories of causes for your problem statement. It might be helpful to think backward: Determine potential causes for a problem first, and then group them into categories.
The traditional categories for a fishbone diagram are the six M's:
-
Machines
-
Methods
-
Materials
-
Measurements
-
Mother Nature
-
Manpower
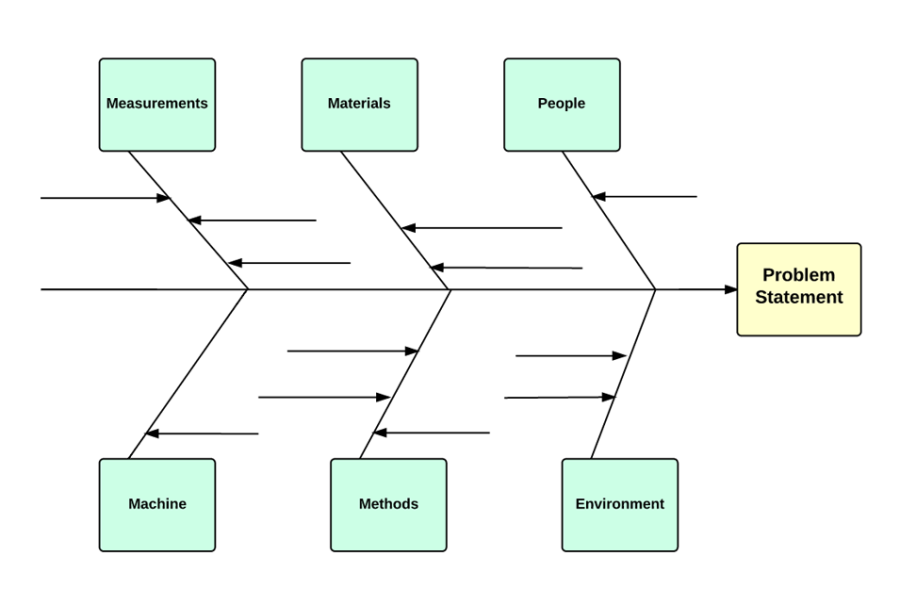
If you're not sure what to include, these categories are a great place to start. You are also free to choose your own, more specific categories that fit your diagram best. Whichever set of categories you choose, place each one at the end of an angled branch (bone) extending from the spine, and leave room beneath each category to add detailed causes.
3. Add causes
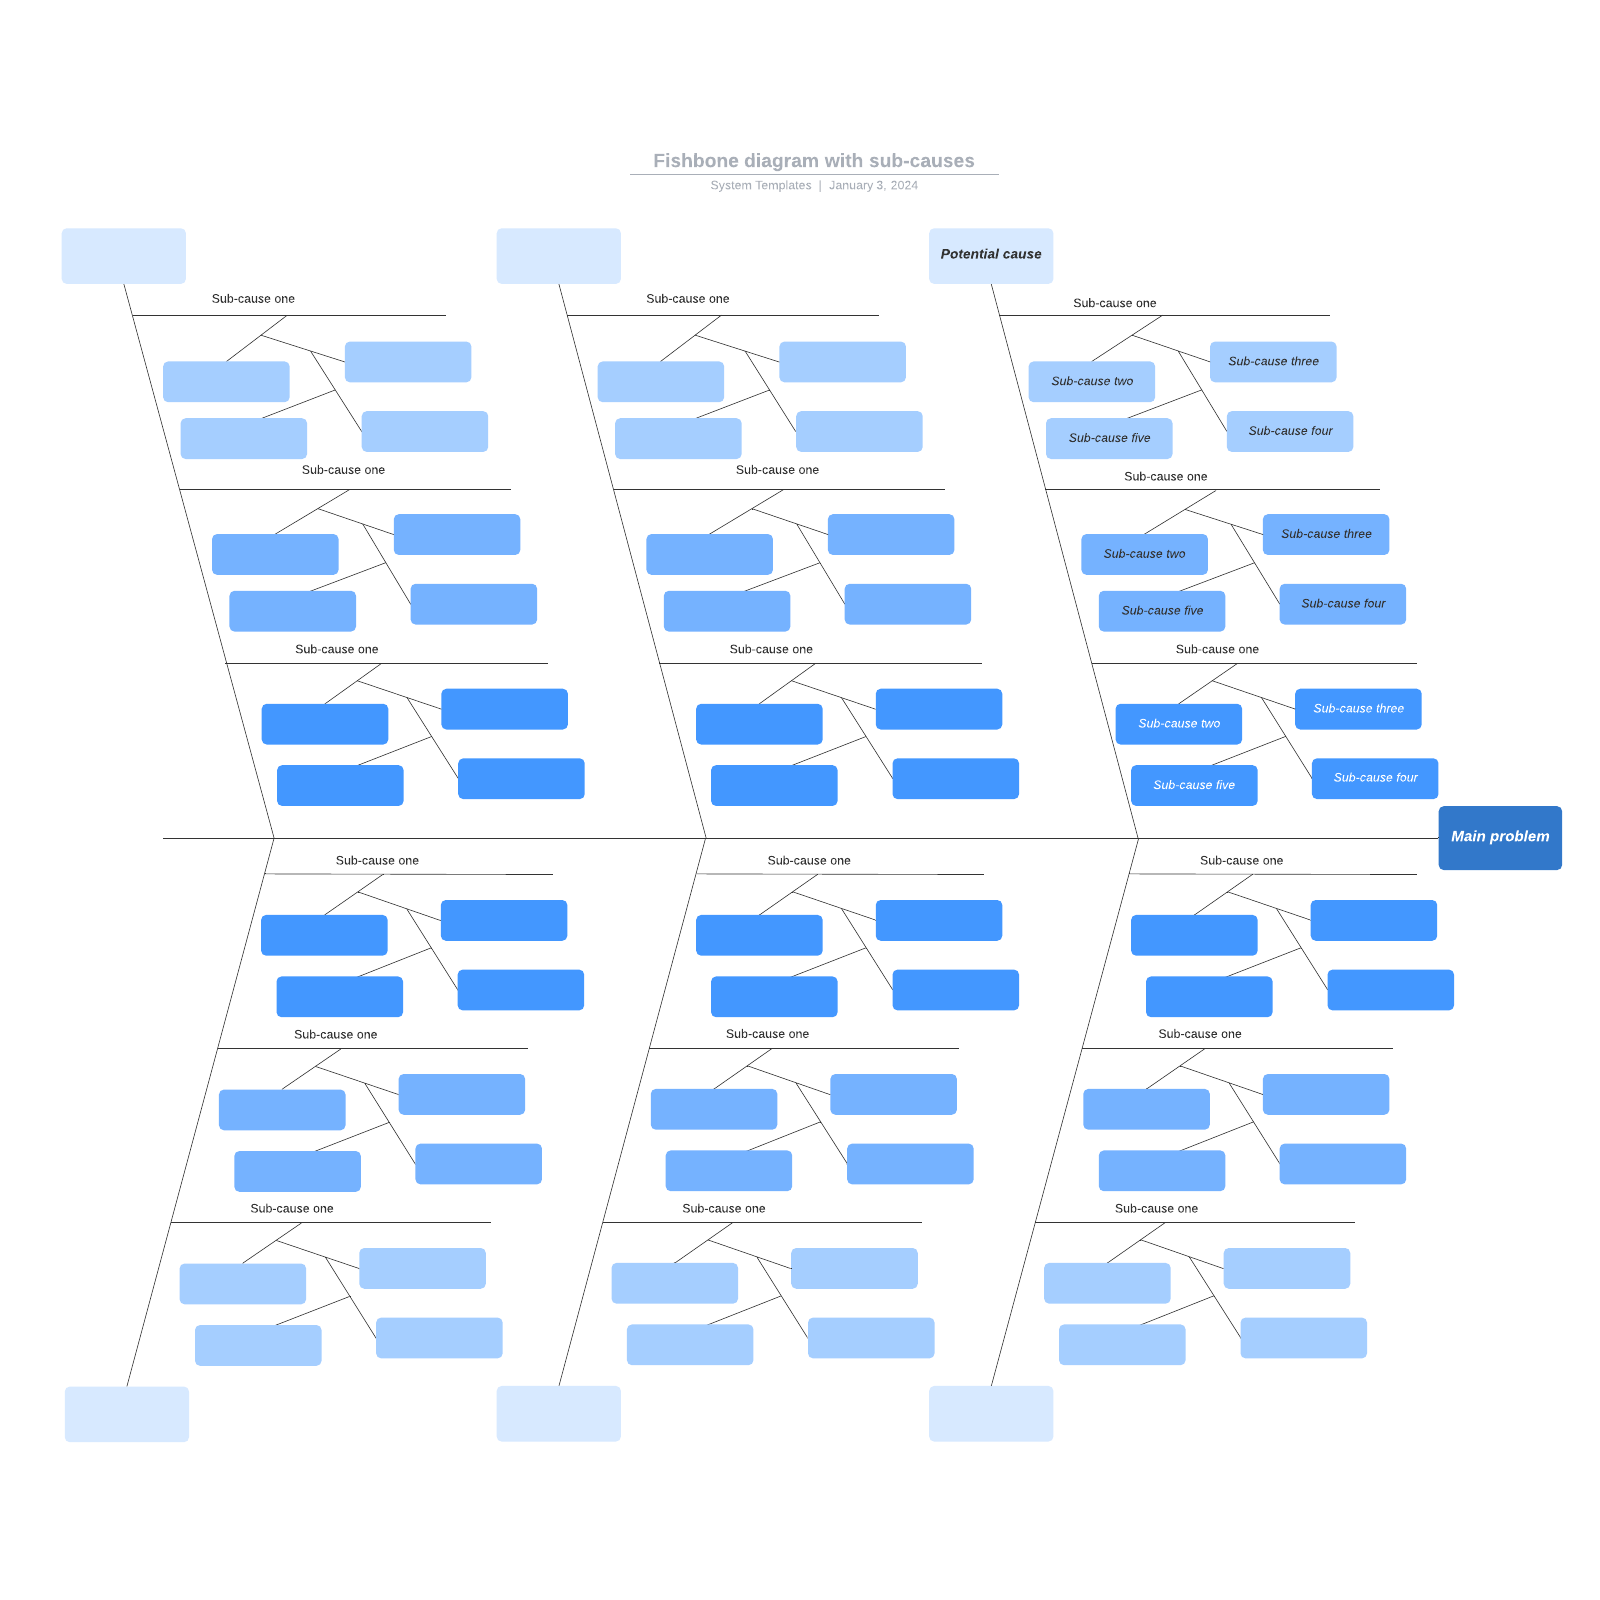
For each factor you've identified in the previous step, list possible causes. For example, if you're experiencing a bottleneck, you may have identified team members as a possible factor. In this step, you'd take it a step further and determine how team members could be affecting the issue. Maybe their training was inadequate, or their skills were insufficient. As you brainstorm, add sub-branches for increasingly specific causes so you can trace each idea back to a category and ultimately to the problem statement.
4. Review your work
After you've completed the document, it's time to review. Did you include all relevant information, and is it organized under the right categories? Invite team members to comment or collaborate for feedback and ensure the diagram is capturing multiple perspectives.
Diagramming in Lucidchart
It's easy to create a fishbone diagram in Lucidchart, an intelligent diagramming application. To get started:
-
Register for a Lucidchart account.
-
Once you’re in your home portal, click + New.
-
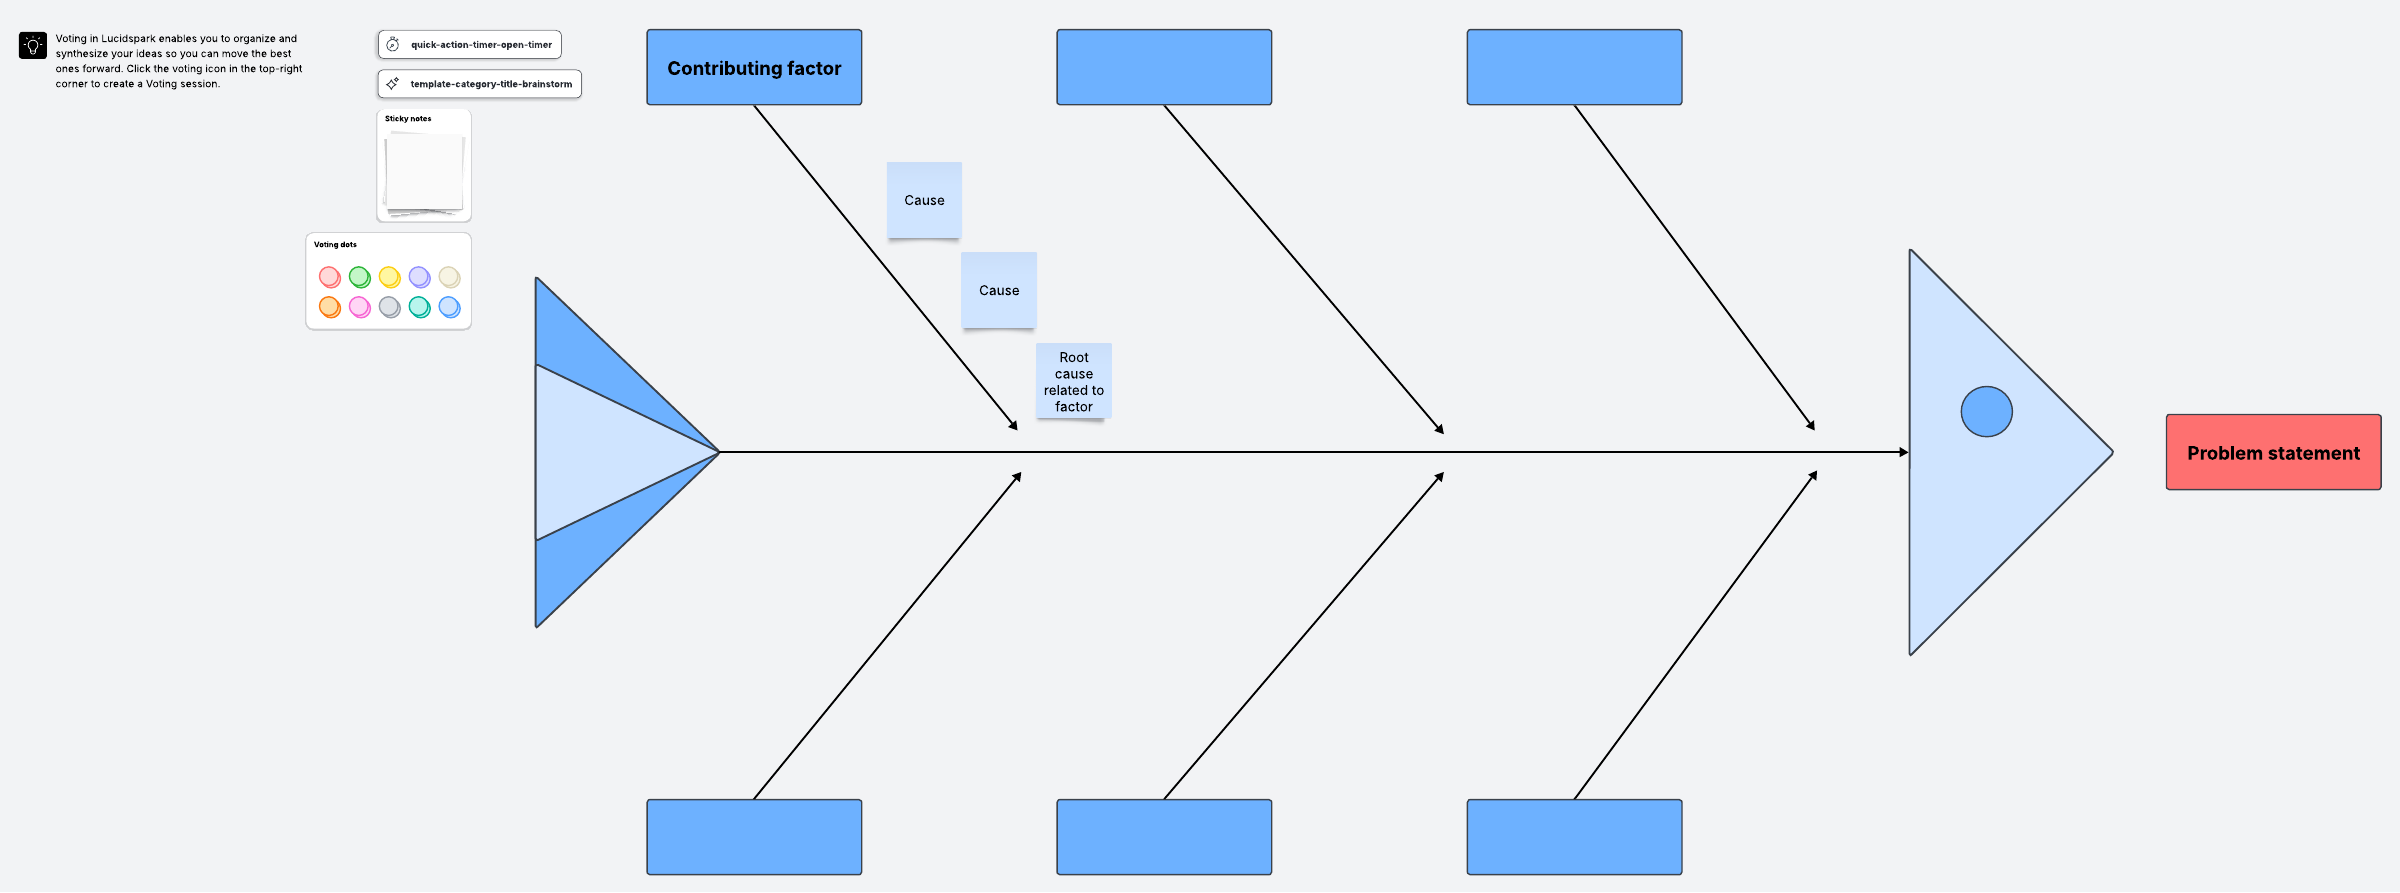
Select Lucidchart, and from there, you can choose Blank document, Create from template, or Create using AI, depending on how you would prefer to build your diagram. Lucidchart offers many fishbone diagram templates, from simple to more complex, that you can customize. With Lucid AI, you can also generate a fishbone diagram from text prompts.
At this point, you will be directed to a new document, and you can start creating or iterating on your fishbone diagram.
If you have decided to create the diagram from scratch, start by designing the skeleton. Use the line tool by clicking the "L" key. A crosshair will appear and let you draw a line. Add more to create the shape you want, and then click the “T” key to add text boxes for labels.
Once you've finished perfecting your diagram, you can share or publish it online.
How to perform a cause-and-effect analysis
Once your fishbone is drafted, you'll get the most value by using it as part of a structured cause-and-effect analysis process. The steps to perform a cause-and-effect analysis are similar to the steps to create a fishbone diagram.
A cause-and-effect analysis should be done in a team setting to encourage creative thinking and examine the problem from different angles. If you perform an analysis independently, you risk introducing cognitive biases. These biases can lead to identifying the wrong cause and trying to solve the wrong problem.
When performing a cause-and-effect analysis, consider:
-
The present: What problem do you want to analyze, and what are the significant factors involved?
-
The past: What might have caused the problem?
-
The future: What are some solutions you can implement to keep the problem from happening again?
Narrow down your list by eliminating the least likely causes. This might require extensive investigative work, interviews with employees, surveys, and more. For example, if there seems to be a consistent bottleneck at a specific workstation, your analysis and investigation can help you determine if the root cause is the equipment, the environment, or the employee working at that station.
Once you have identified the most likely root cause, you can create a plan to implement a solution that will fix the problem and prevent it from recurring. If you discovered that the cause of the issue was inadequate training, you could implement a standardized training process. That way, all employees would have the same understanding of the work processes.
How to add a fishbone diagram in Excel
-
If you haven’t already, install the Lucid add-in for Excel.
-
Once you have downloaded and selected the Lucid add-in, a panel will appear on the right side of your spreadsheet.
-
Follow the directions to insert your Lucid document onto the sheet. You may be prompted to log in to your Lucid account before you can do this.
Everything you need to make a diagram
Make a polished, professional diagram for free with Lucidchart. No matter what you have in mind, we have the tools you need to build it. Make an account and start diagramming today.
Sign up free