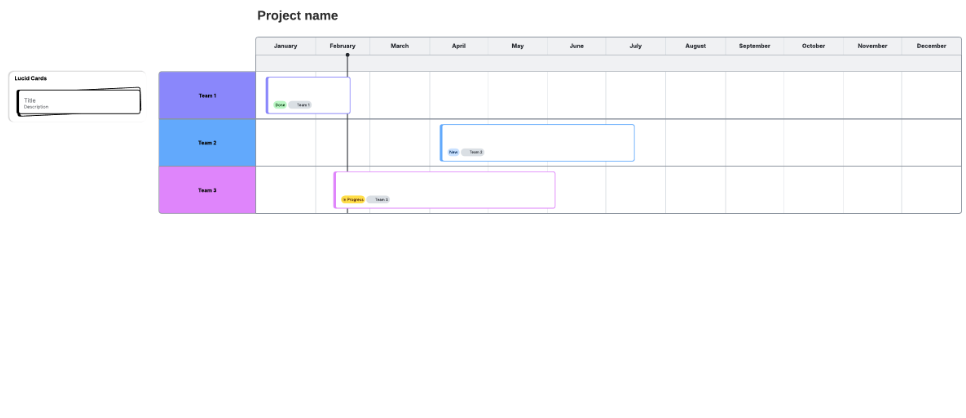
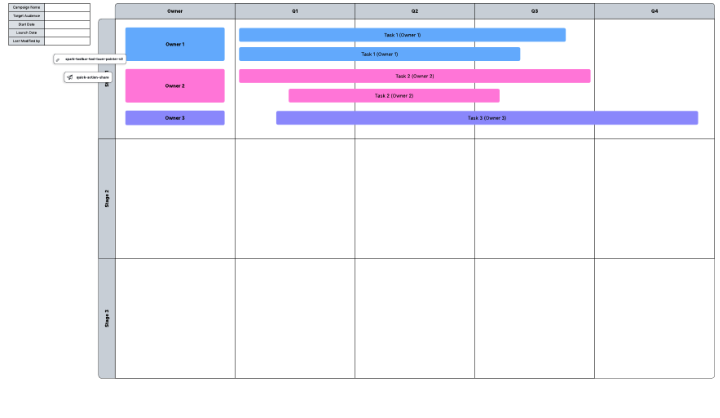
Gantt charts visualize an entire project from start to finish, making it easy to communicate responsibilities and prioritize tasks. But making a Gantt chart is easier said than done. Many turn to Excel, but while this program is perfect for organizing and storing large amounts of data, you may find that Excel lacks the flexibility to help you schedule and plan projects effectively.
Give others a clear picture of the project’s timeline with an easy-to-understand Gantt chart of your own. Use this step-by-step guide to learn two approaches to creating a Gantt chart in Excel.
Option #1: Quickly add a Gantt Chart in Excel with Lucidchart
Option #2: Manually make a Gantt chart in Excel
Option #1: Quickly add a Gantt chart in Excel with the Lucidchart add-in
Building a Gantt chart in MS Excel requires 18 steps of time and patience. Don’t limit yourself to only using Excel—instead use Lucidchart’s integration with Microsoft Office. The intuitive diagramming tools available in Lucidchart make it simple to create sharp, professional diagrams in minutes. Plus, it’s easy to set up and add diagrams directly into your spreadsheet.

How to install the Lucidchart add-in for Excel
First, download the Lucidchart add-in for Excel. To do so, follow these simple steps:
- Open Excel.
- Go to Insert > Add-in > Get add-in.
- Search and select “Lucidchart Diagrams for Excel.”
- Click “Add.”
- Accept the terms and conditions.
- Log in with your Lucidchart credentials to access your documents.
How to insert a Gantt chart into Excel with the Lucidchart add-in
Insert a Gantt chart into your spreadsheet, as a high-resolution image, without ever leaving Excel.
- In Excel, find the Lucidchart button in the upper-right corner.
- Click ”Insert Diagram.”
- Select your Gantt chart from the list.
- A preview will appear in the bottom box. If it is the correct document, click “Insert.”
- To edit your Gantt chart, select “Edit.” Make the necessary changes in the pop-up window and then click “Insert” to update your diagram.

How to build a Gantt Chart in Excel with the Lucidchart add-in
Create and edit your own Gantt chart in Excel using the Lucidchart editor within the Microsoft add-in.
- In Excel, select “Insert Diagram” to open the Lucidchart panel.
- Click “Create New Diagram.”
- Choose either a blank document or template to start.
- Drag and drop shapes and edit the text to build your Gantt chart.
- Save your Gantt chart and click back into your Excel spreadsheet.
- Select your new diagram from the sidebar and click “Insert.”

Visit our Help Center or watch the video tutorial below for additional instructions on installing and using the Lucidchart add-in.
Option #2: Manually make a Gantt chart in Excel
You can still make a Gantt chart from scratch in Excel following the steps listed below. But keep in mind that the process will be more time-consuming and less intuitive than using Lucidchart and you won’t have the opportunity to use pre-made templates.
Format your data and select your bar graph
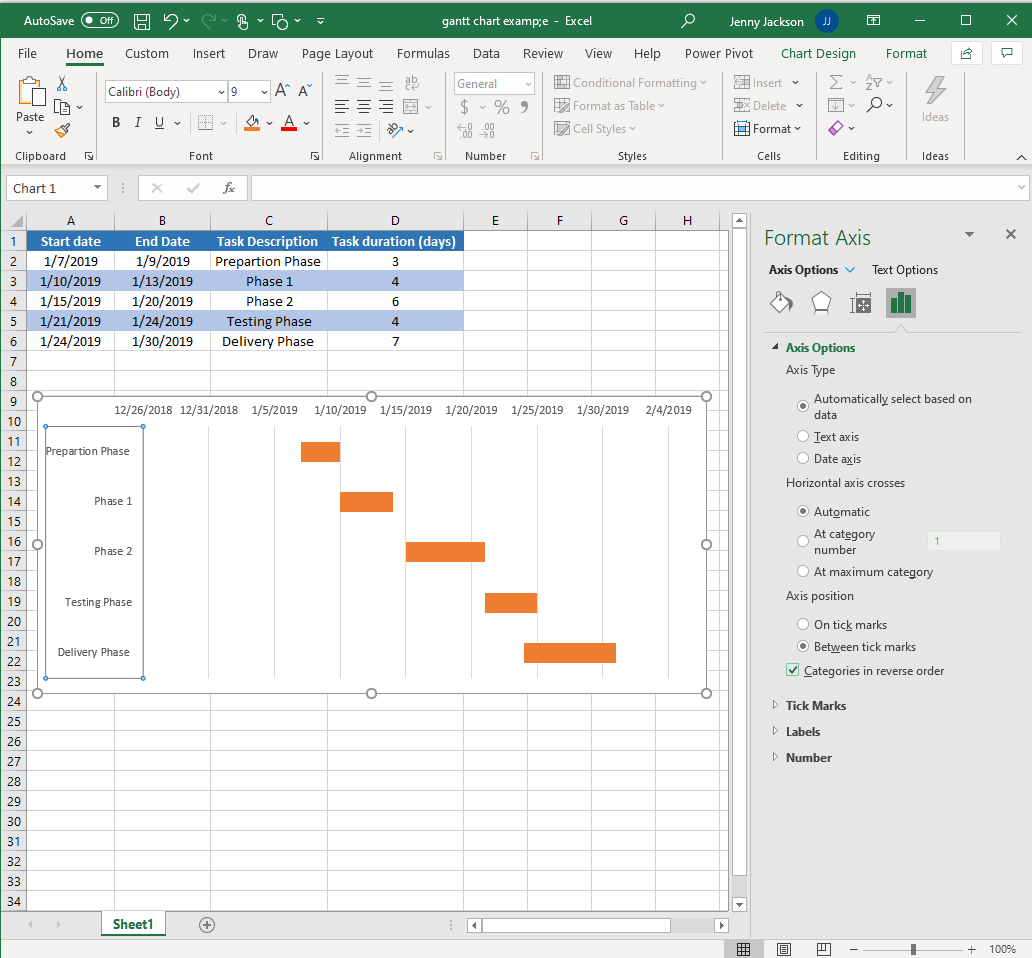
- Input and title each column: “Start Date,” “End Date,” “Task Description,” and “Task Duration.”
- Add your project data to the spreadsheet.
- Go to Insert > Chart > Bar chart > Stacked bar chart.

Add data to your Gantt chart
- Right-click on the chart and find “Select data.” A “Select Data Source” box will appear.
- Click “Add.” An “Edit Series” dialog box will appear.
- Select the “Series name” box.
- With your cursor in the “Series Name” box, select the “Start Date” cell in your worksheet. Click back into the “Series name” box.
- Select the “Series value” box.
- With your cursor in the “Series value” box, select all the values in the “Start Date” column on your spreadsheet. Click back into the “Series value” box. Click “OK.”
- Back in the “Select Data Source” box, click “Add.”
- Repeat the same process for “Task Duration.”


Format your Gantt chart
- Select “Start date” on the left side of the “Select Data Source” box. Then, click the “Edit” button in “Horizontal (Category) Axis Labels.”
- Select the “Axis label range” box.
- With your cursor in the “Axis label range” box, select the values under the “Task Description” in your spreadsheet. Click “OK."
- Select the left-most bars of the horizontal bar graph. Right-click and select “Format Data Series.” A sidebar will appear.
- Select the paint bucket icon. Under the “Fill” options, select “No Fill.”
- Do not close the formatting window. Select the task descriptions on the left of the chart and click on the bar chart icon.
- Under the “Axis options,” click the “Categories in reverse order” checkbox.
Done! You've created your own Gantt chart in Excel.


Gantt chart examples
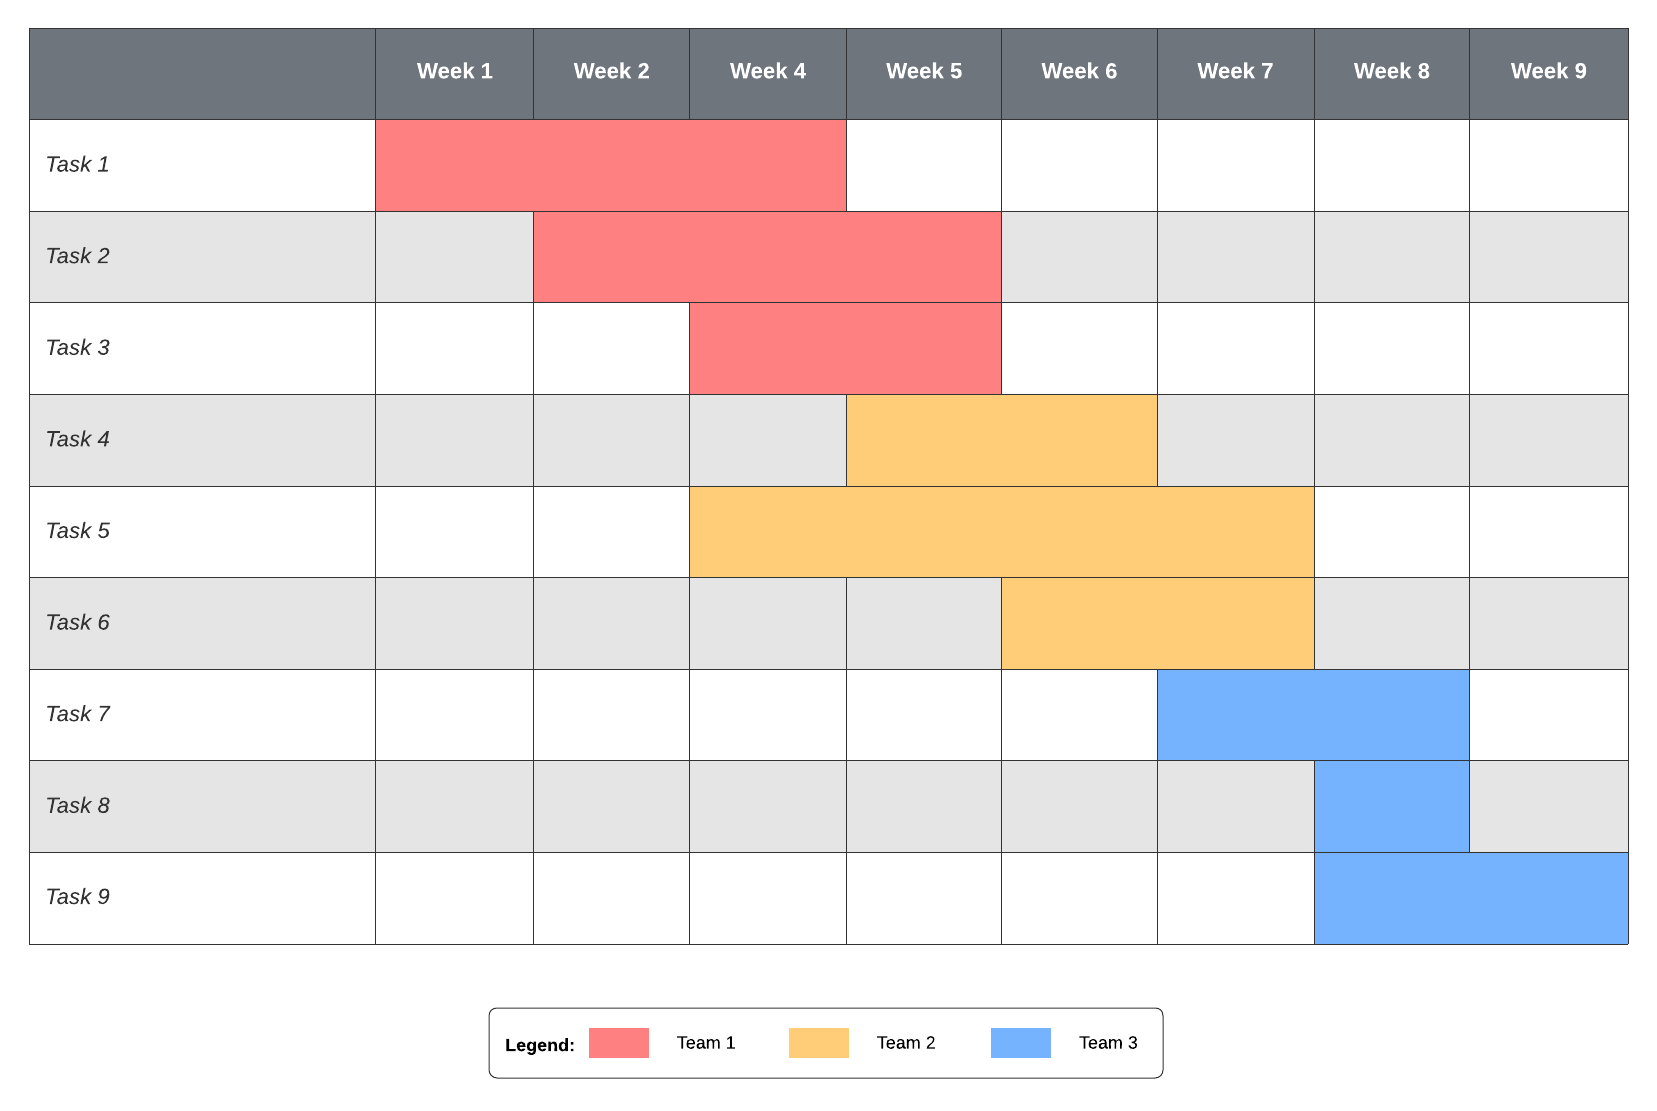
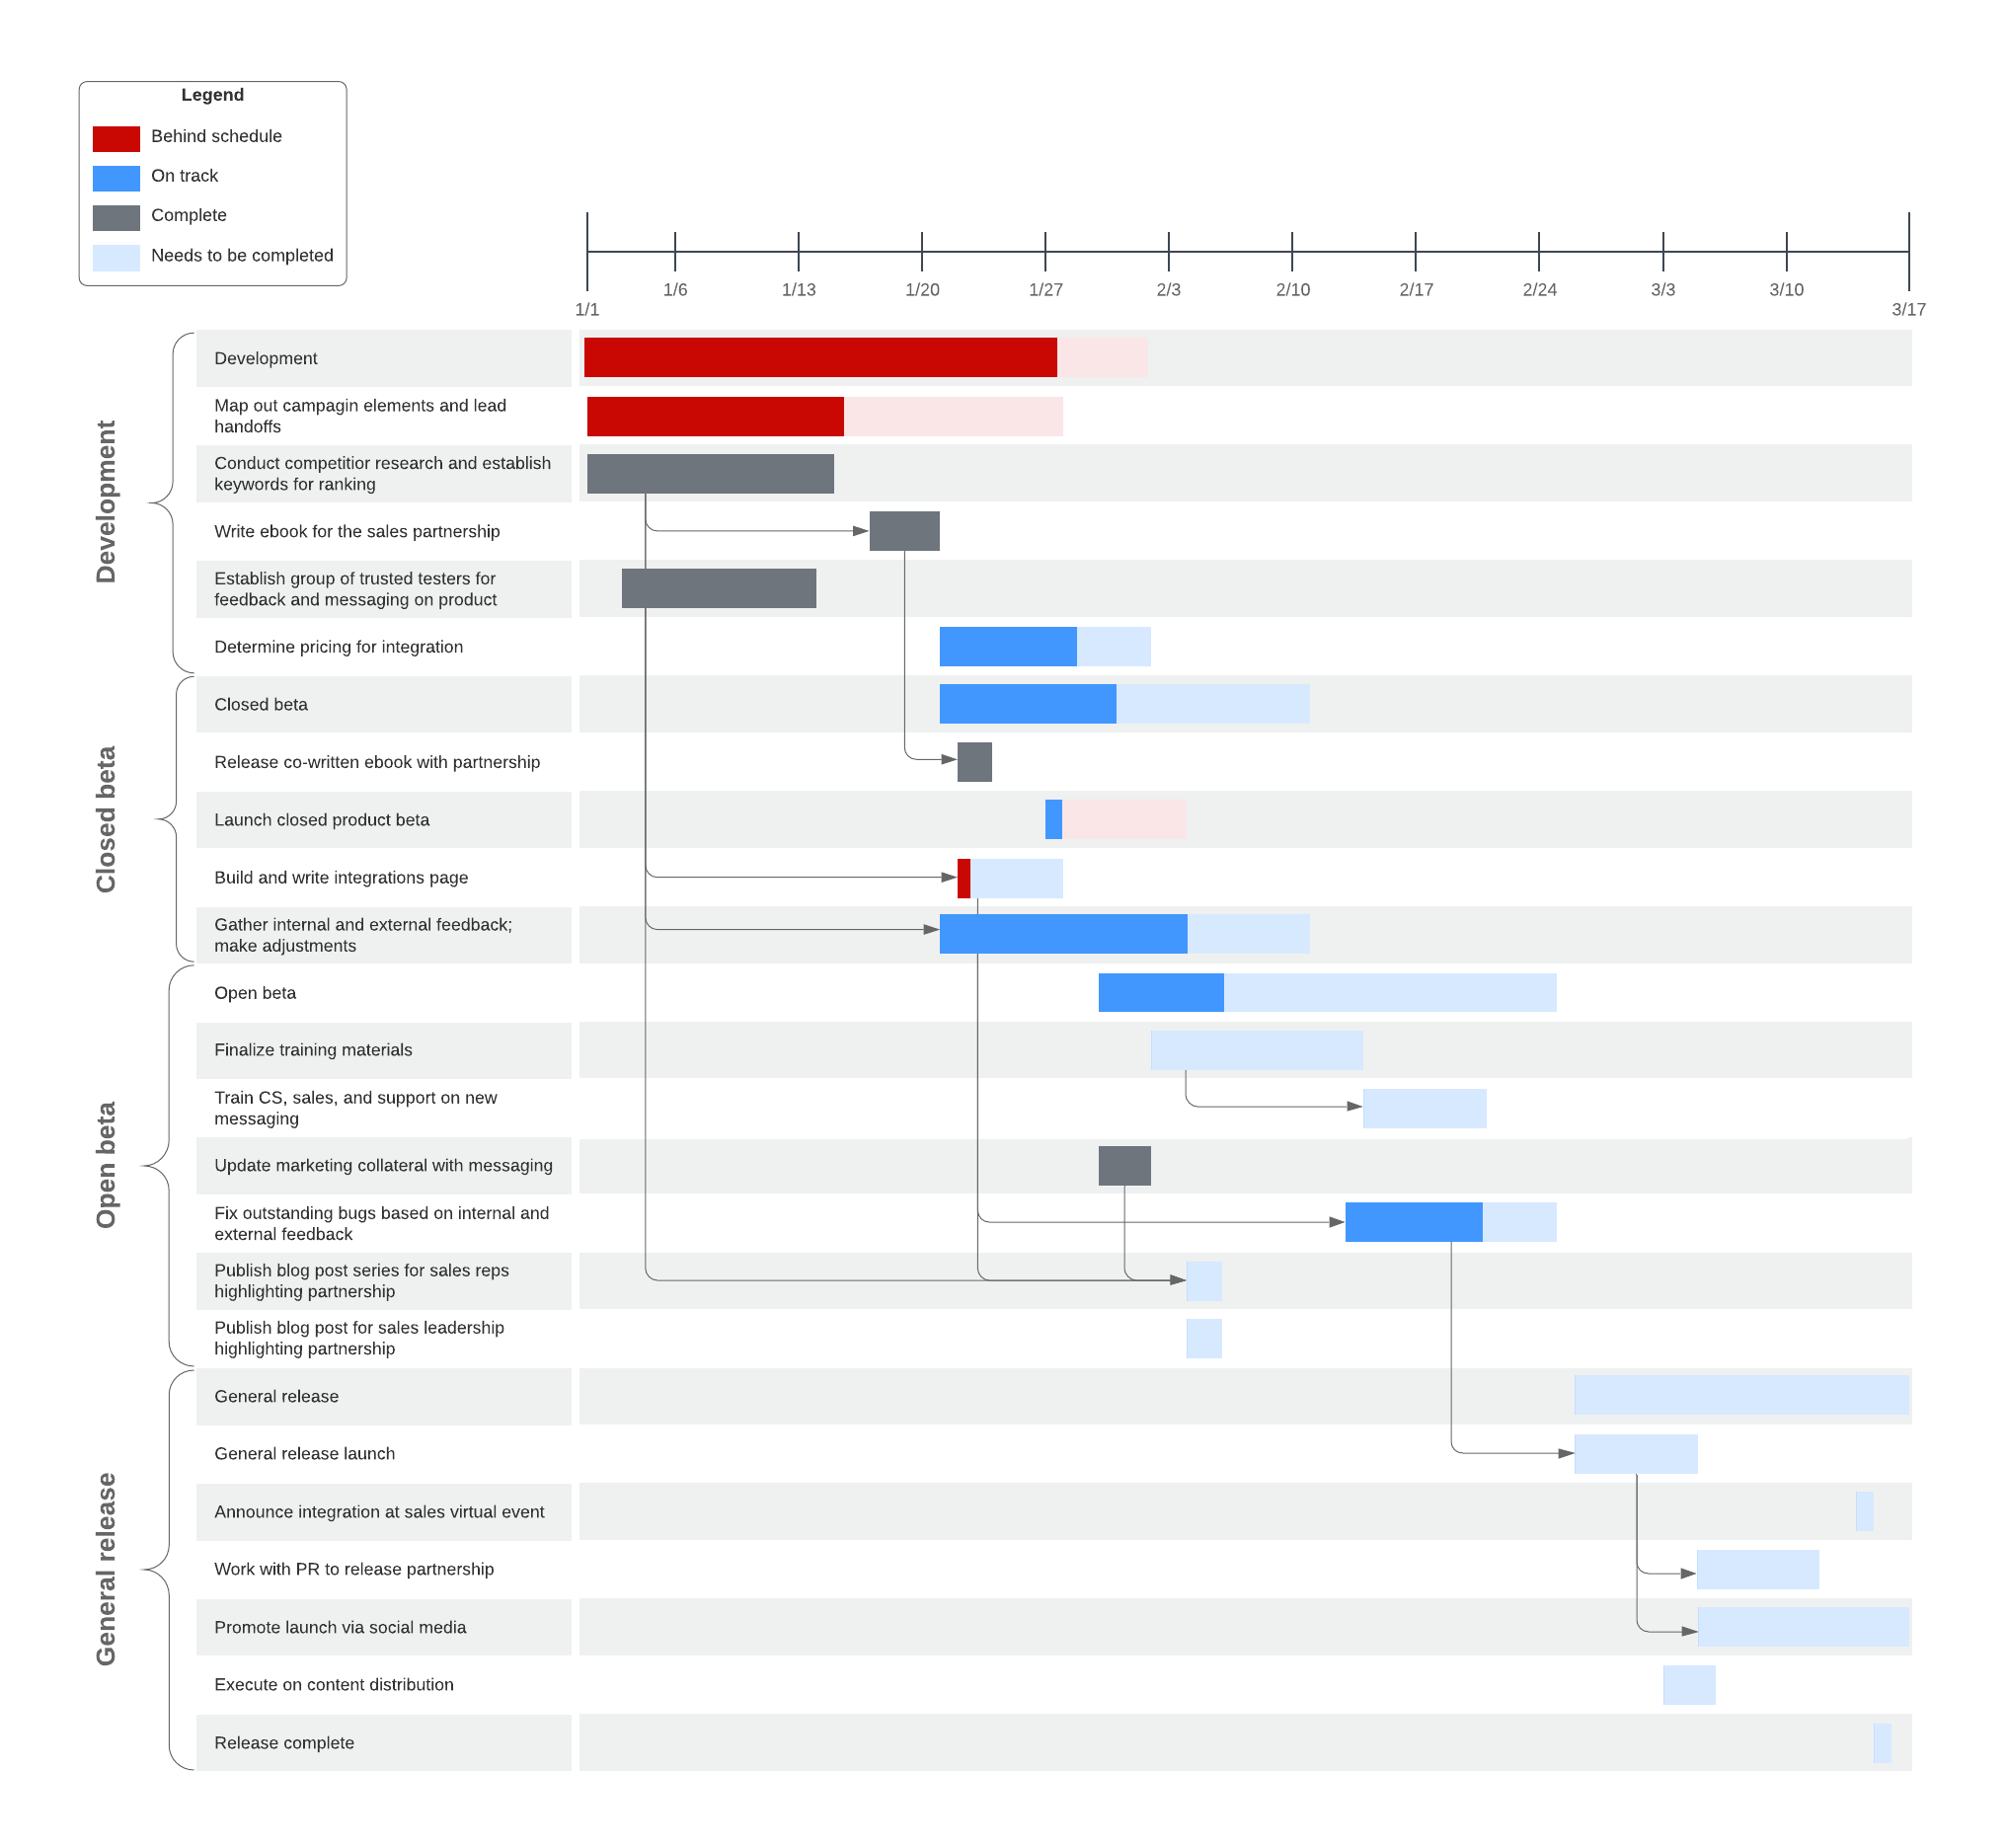
Ensure your project goes off without a hitch when you get started with one of our Gantt chart templates. Just click the template to open it with your Lucidchart account and start editing.
Choose Lucidchart to create a Gantt chart for Excel
Pick the program that makes the most sense for your goal. If you need to store a lot of data, Excel is clearly your best option. To plan and execute a project with many moving pieces, save yourself the time and headache, and choose Lucidchart to build your Gantt chart. With dozens of templates, easy-to-use tools, and an intuitive interface, Lucidchart helps you visualize your entire project from the beginning.
Ready to learn more about Gantt charts?
Lucid has resources to learn how using a Gantt chart can help you adapt when changes come your way.

Everything you need to make a diagram
Make a polished, professional diagram for free with Lucidchart. No matter what you have in mind, we have the tools you need to build it. Make an account and start diagramming today.
Sign up free