Contents
All about Gantt charts
6 min
Now that you have the basics covered, you can get to work on creating your own Gantt chart. By breaking big efforts into visible, time-bound pieces, a Gantt chart can make even intimidating work feel more manageable.
Ready-to-use Gantt chart templates
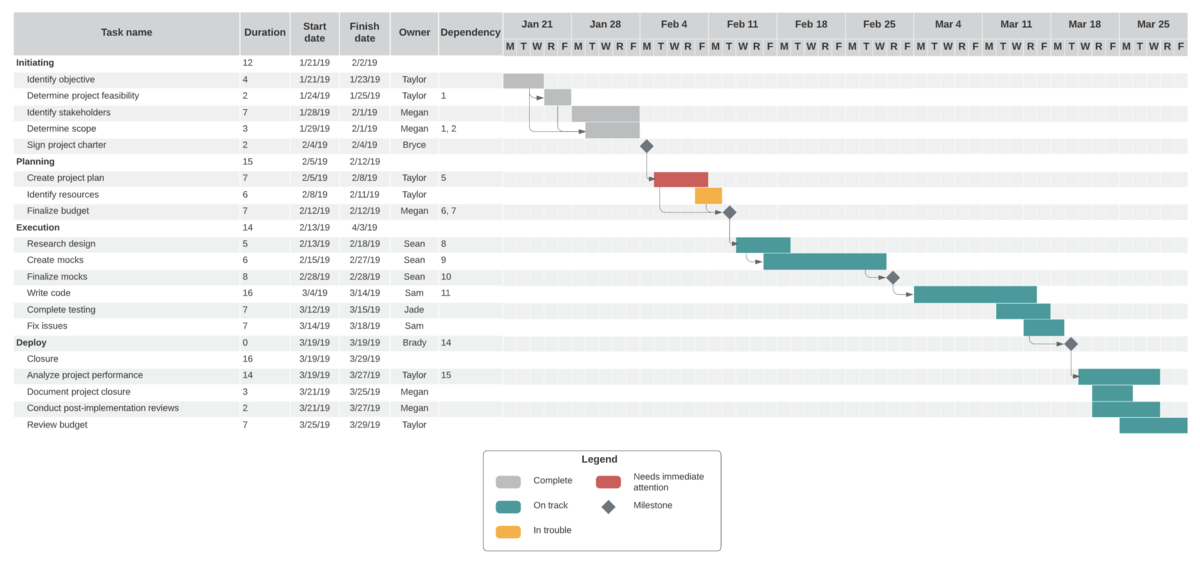
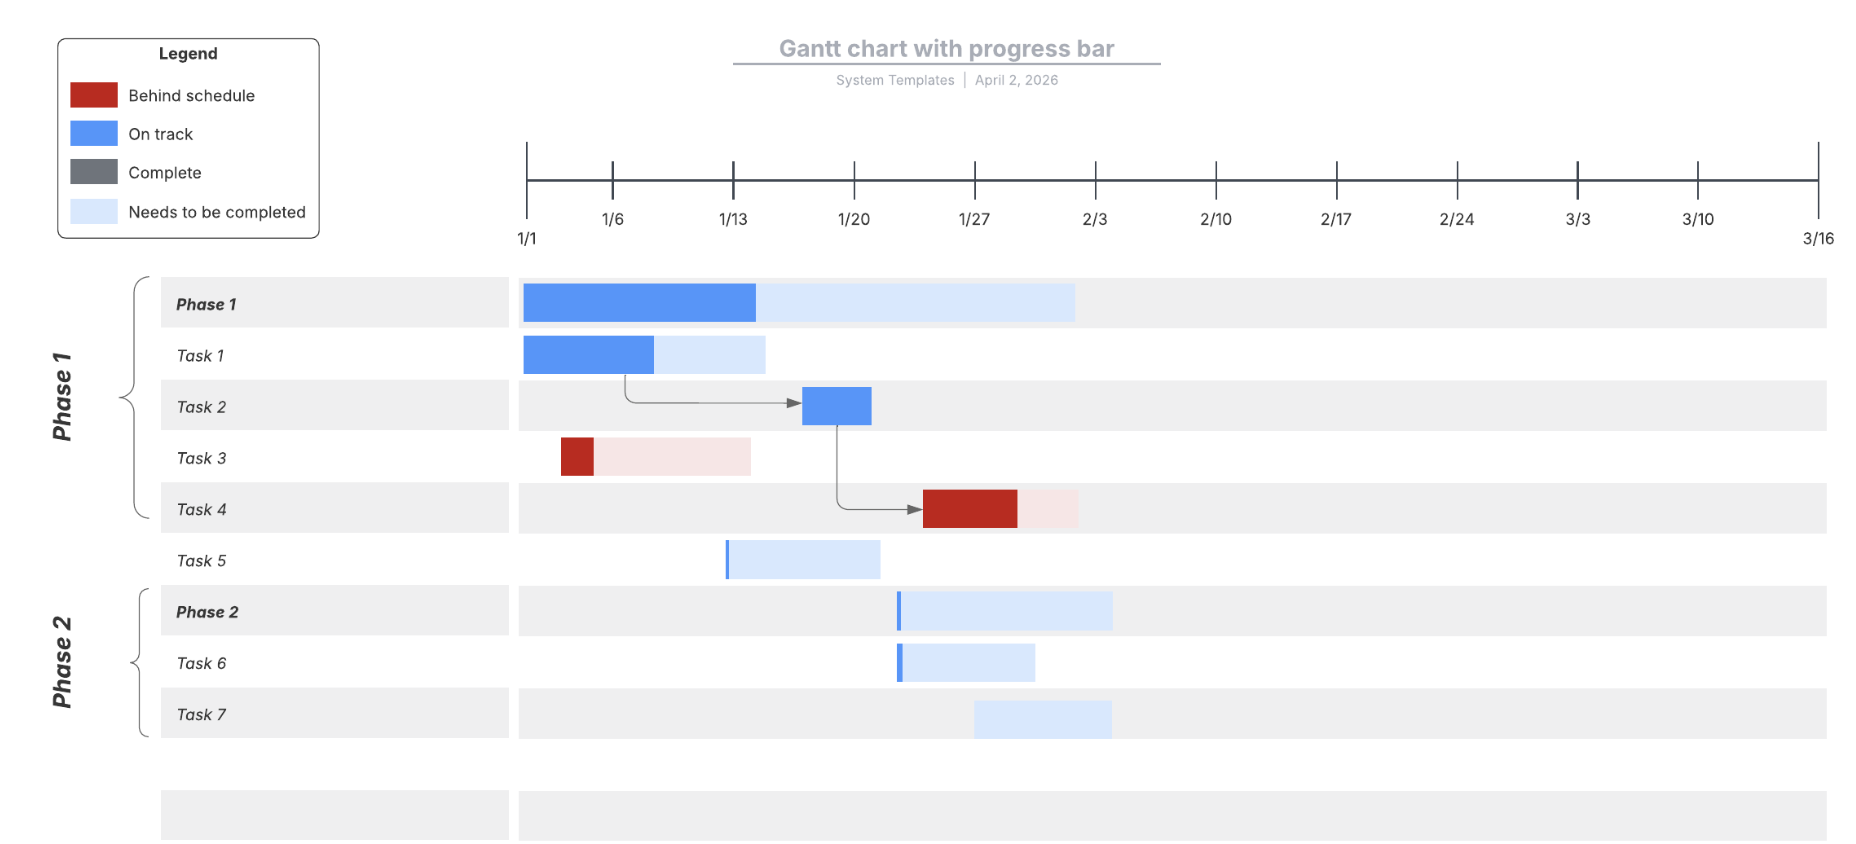
Use our Gantt chart templates to build timelines, indicate the status of tasks, and collaborate with your team.

Additional resources on Gantt charts
Gantt chart maker
Lucidspark takes Gantt charts to the next level. Drag and drop shapes, import data, access templates, and so much more.
PERT chart vs. Gantt chart
This blog post compares the Gantt chart vs. PERT chart and highlights the differences between them so you can choose the right tool for the job.
Gantt chart alternatives
Not sure whether a Gantt chart is your best option for project management? Discover alternative visuals, including timelines, Kanban boards, and Scrum boards.
Frequently asked questions
What is a Gantt chart?
Who invented the Gantt chart?
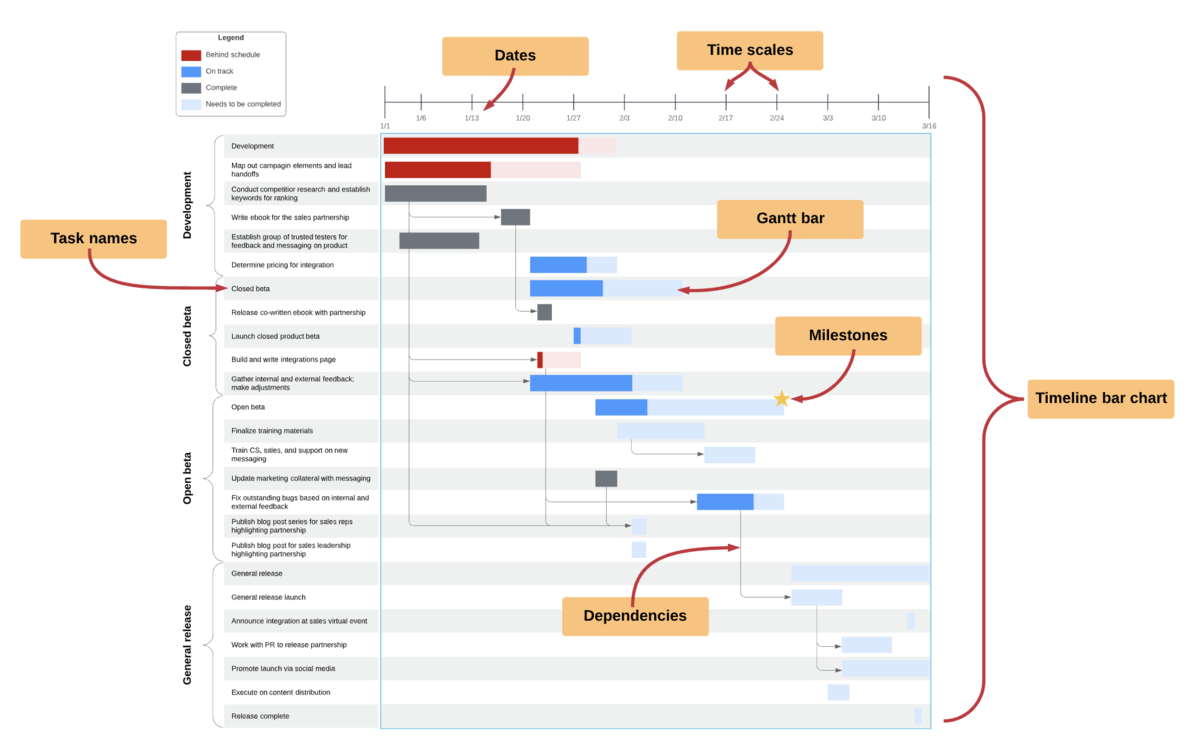
What are the main components of a Gantt chart?
How does a Gantt chart help with project management?
What are the advantages of using Gantt charts?
What are the disadvantages of Gantt charts?
Who can use a Gantt chart?
How do you create a Gantt chart?
Everything you need to whiteboard online
In addition to our online whiteboard tools, Lucidspark offers support and training resources to help you ideate, plan, and build with your team.
Get Support