Key takeaways
You can build a Venn diagram in Google Docs, Word, PowerPoint, Excel, or Lucidchart, so start with the tool your team already uses.
In PowerPoint and Excel, you can use the built-in SmartArt relationship graphics on the Insert tab or take advantage of the Lucidchart add-in.
In Word, you can draw shapes manually, use SmartArt, or embed a live, editable diagram with the Lucidchart add-in.
In Google Docs, the Lucidchart add-on lets you create, insert, and update diagrams without leaving your document. Google Drawings gives you a no-add-on option inside Google Docs using circles and text boxes.
Lucidchart's Venn diagram shape library and templates let you style overlaps, fills, and labels in a few clicks. Begin with a Venn diagram template or Lucid AI to skip manual setup.
A Venn diagram uses overlapping circles to show what two or more groups have in common and where they differ. Learning how to make a Venn diagram helps you compare options, map the overlap between sets, brainstorm ideas, and understand how concepts relate.
This guide covers how to make a Venn diagram in Google Docs, Word, PowerPoint, Excel, and Lucidchart, with clear steps, templates, and styling tips. Start with Lucid’s in-depth guide on what a Venn diagram is, opens in a new tab for a deeper primer.
How to make a Venn diagram: Which tool is right for you?
Pick your tool based on where the diagram will live and how often it will change. For quick static visuals, use the office apps you already work in, or use Lucidchart when you want a reusable, shareable diagram.
Google Docs or Word: Embed a diagram inside a text document.
PowerPoint: Add a Venn diagram to a slide for a presentation.
Excel: Turn categories in a spreadsheet into a visual.
Lucidchart: Build a polished, collaborative diagram you can reuse anywhere.
If your sets don't all overlap the same way, review our blog post on Euler diagram vs. Venn diagram before you choose a layout.
How do you make a Venn diagram in Google Docs?
You can make a Venn diagram in Google Docs in two ways. Use the Lucidchart add-on for a live, editable diagram, or use Google Drawings for a quick, built-in option.
Option 1: Use the Lucidchart add-on in Google Docs
The Lucidchart add-on integrates with Google Workspace so you can create, insert, or update a diagram directly from your document.
Install the add-on
Open a Google Doc.
Select Extensions > Add-ons > Get add-ons.
Search for and select Lucidchart.
When the pop-up appears, grant the permissions that give Lucidchart access.
Insert an existing diagram
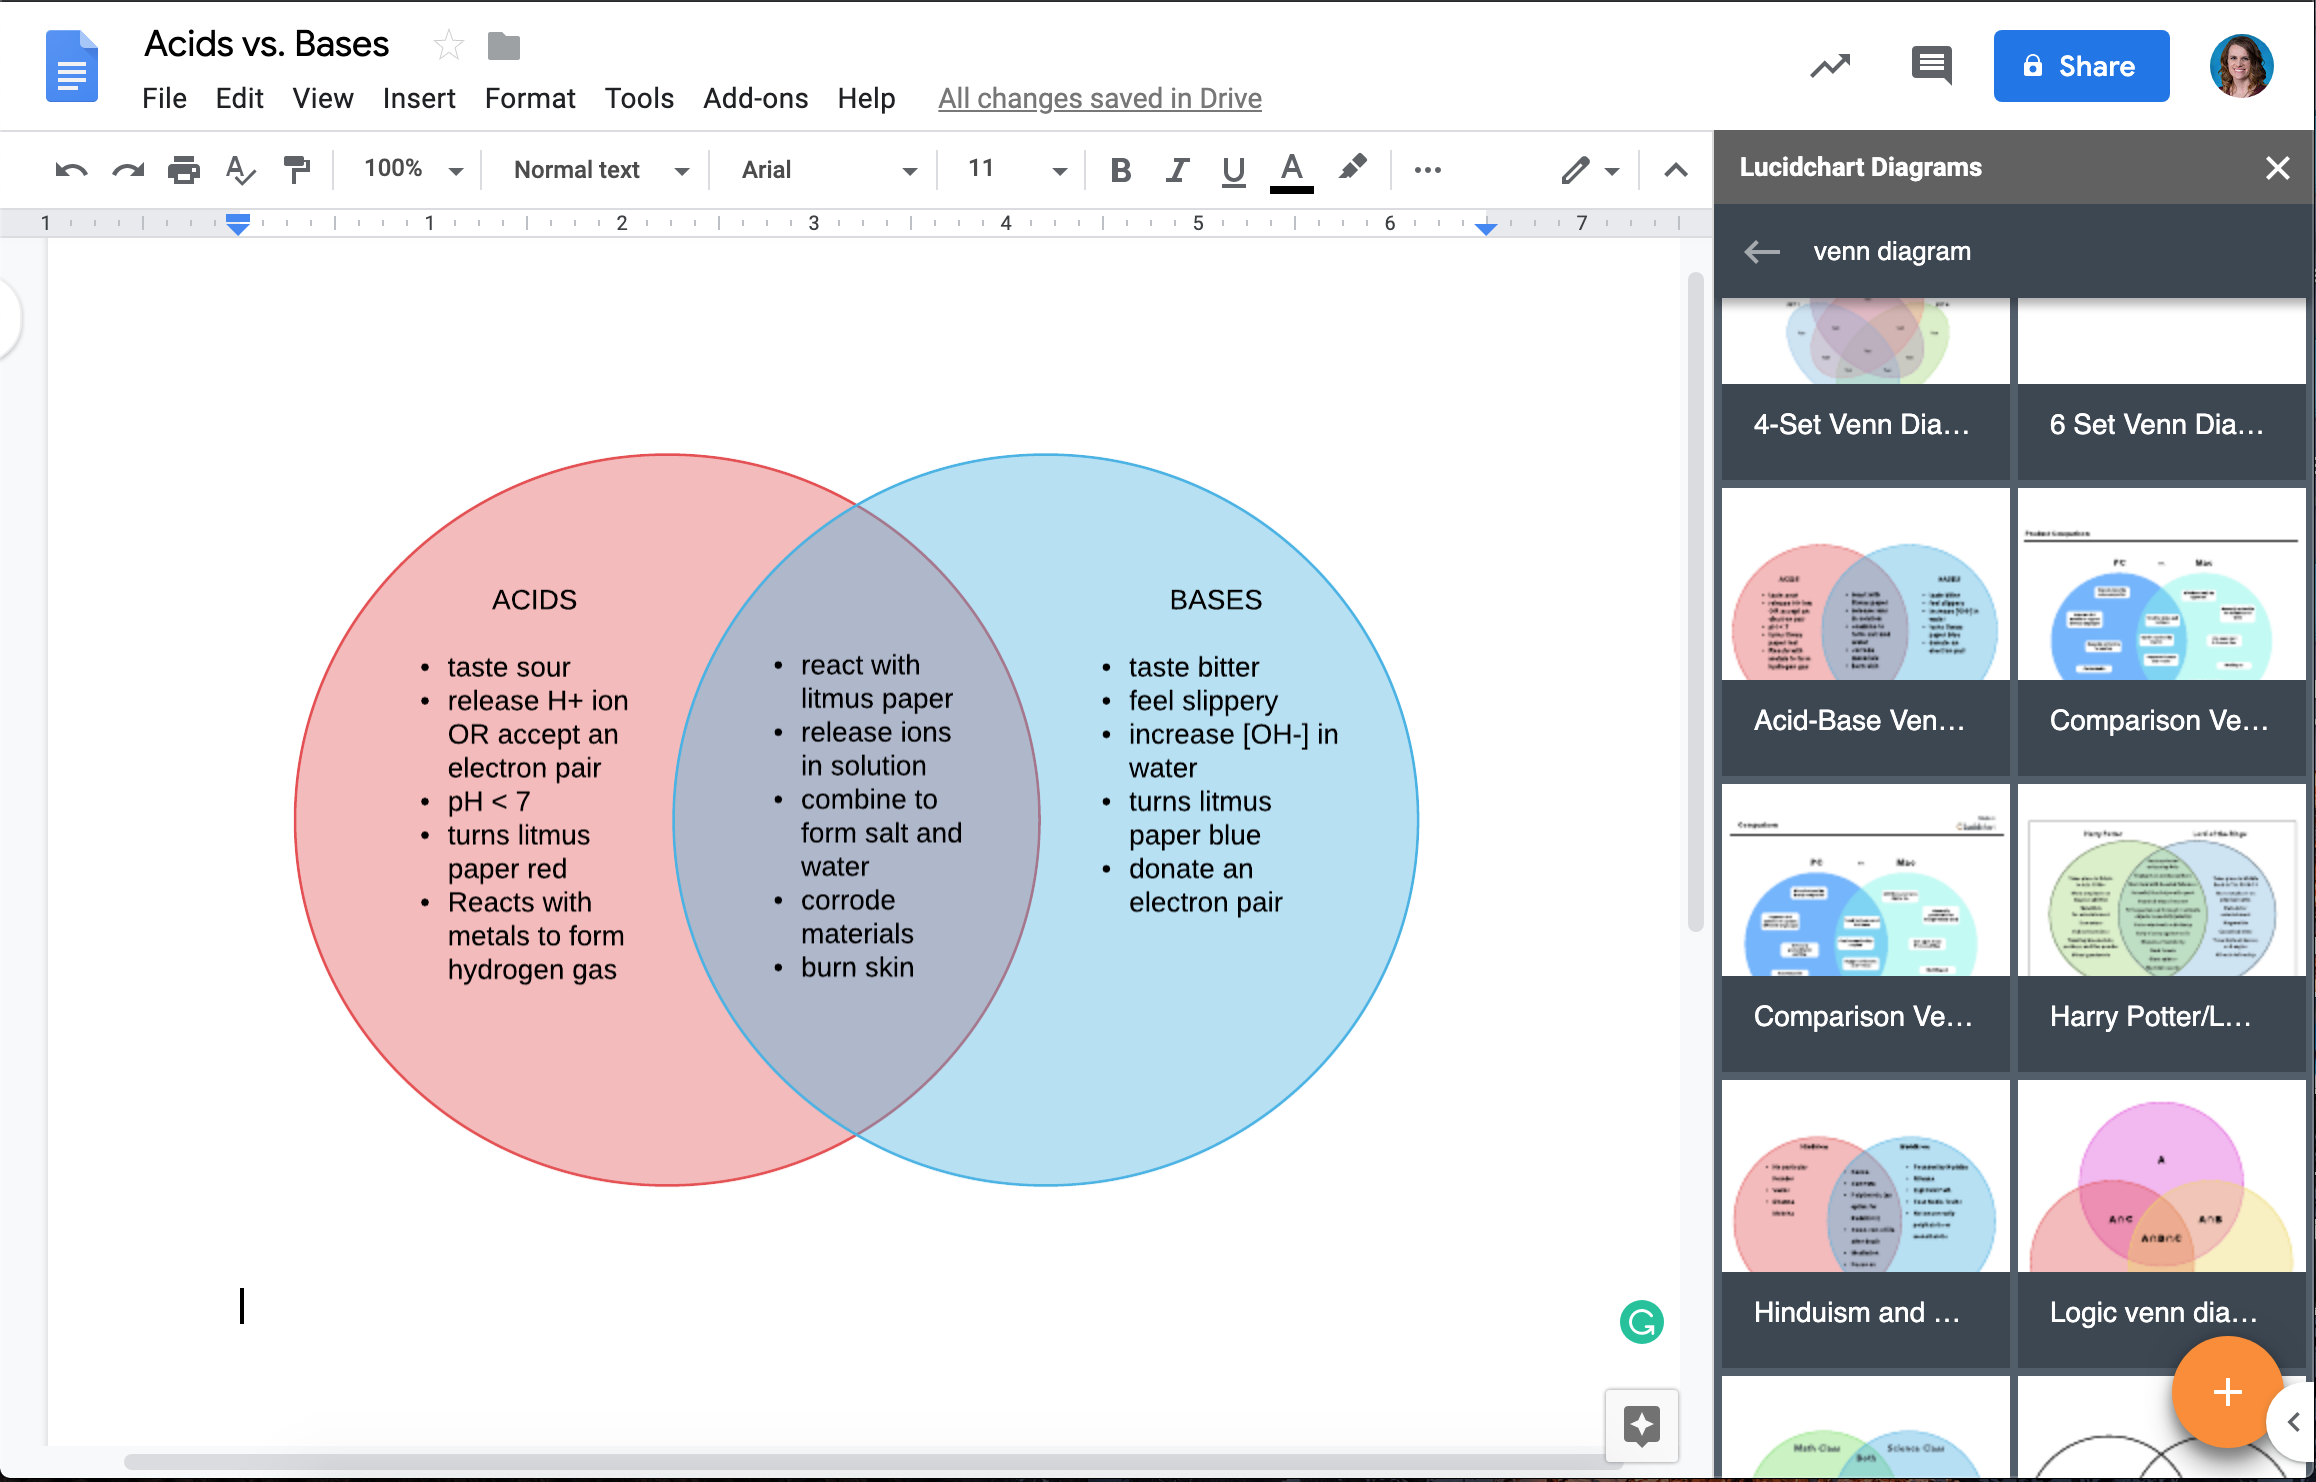
In your Google Doc, select Extensions > Add-ons and choose Lucidchart.
Choose your Venn diagram from the right-hand sidebar and click +.
Preview your selection, then click Insert.
Create a new diagram
Select Extensions > Add-ons, open Lucidchart, and choose Insert diagram.
Select a template to customize, or start from a blank document.
Edit the template or drag and drop shapes to build your diagram in Lucidchart.
Return to your Google Doc, select the new diagram, and click + to preview and insert it.
Option 2: Use Google Drawings
Open a Google Doc.
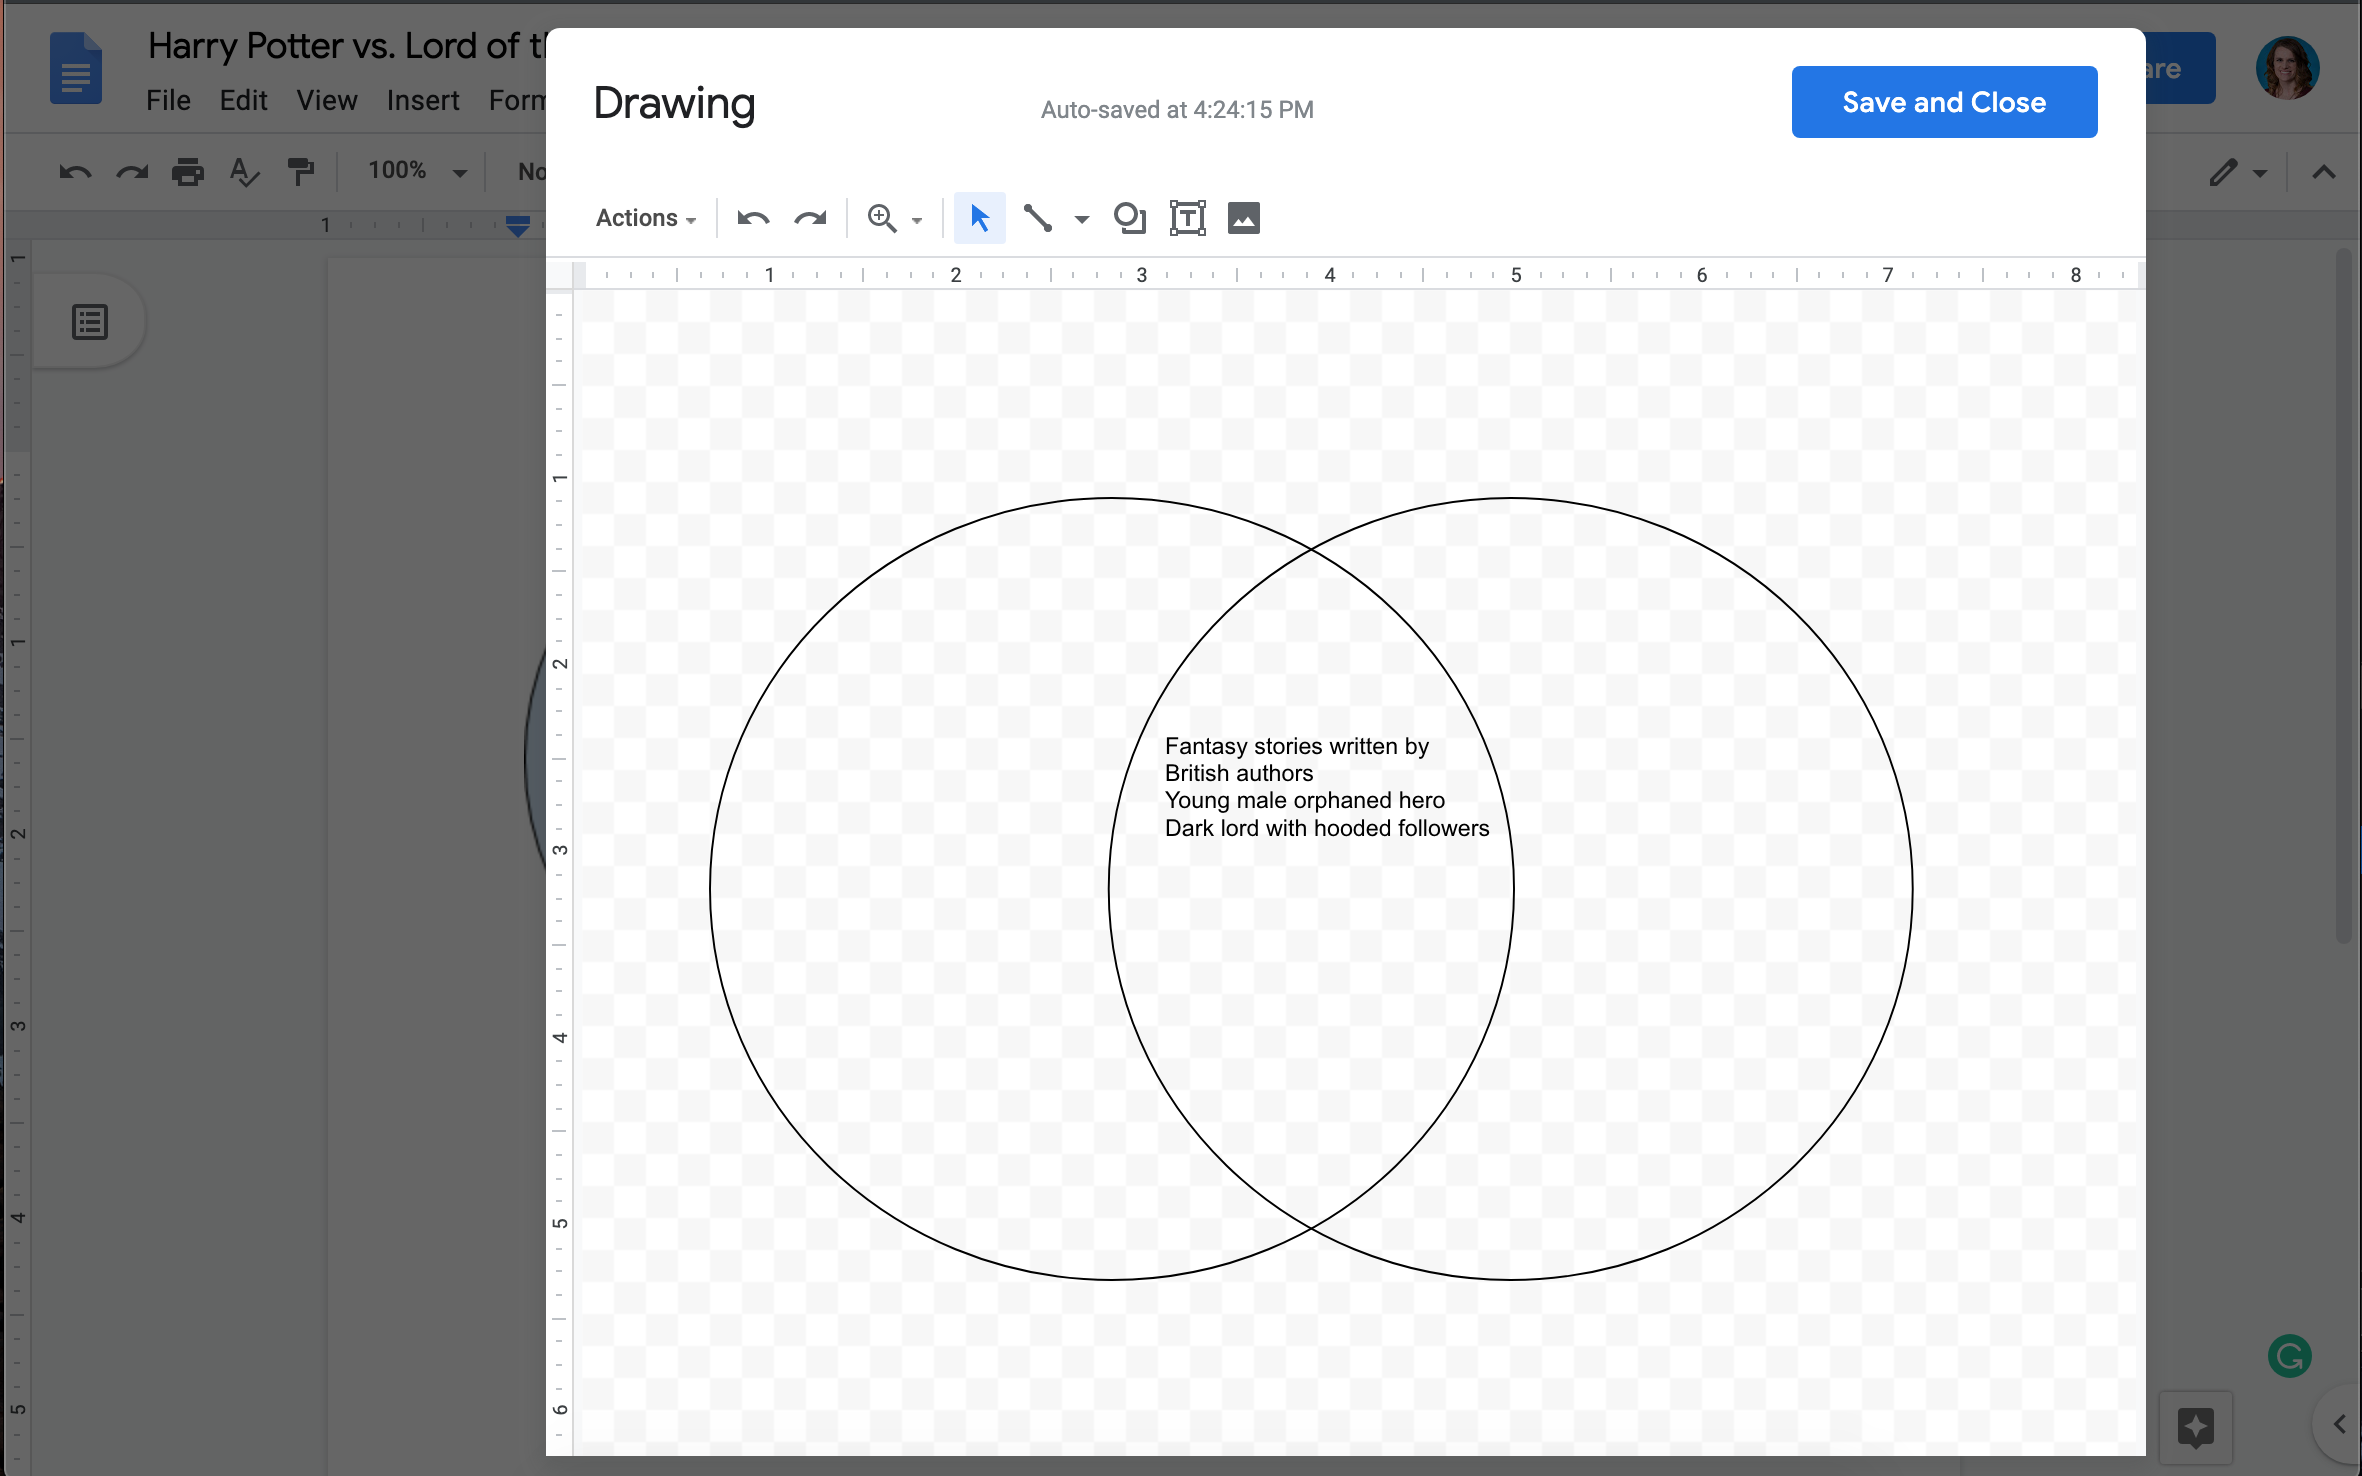
Select Insert > Drawing > + New.
Use the shape icon to add circles, then add text boxes to complete your diagram.
Click Save and close.
How do you create a Venn diagram in PowerPoint?
Venn diagrams are fantastic for presentations when you need to compare concepts or show overlapping relationships to your audience. To add a Venn diagram in PowerPoint, you can leverage the Lucidchart add-in or use built-in SmartArt.
Option 1: Use the Lucidchart add-in for PowerPoint
Instead of trying to perfectly align shapes in PowerPoint, you can use the Lucidchart add-in to quickly import a polished, presentation-ready diagram.
Get the Lucidchart add-in for PowerPoint
Open your PowerPoint presentation.
Navigate to your add-ins menu, search for the Lucidchart add-in, and select Add.
Follow the setup instructions to complete the installation. Once the integration is complete, the Lucidchart add-in panel should open automatically.
Log in to your Lucidchart account to view your diagram library.
Choose and insert your Venn diagram
From the add-in, you can select an existing Venn diagram from your document list. Alternatively, you can create a brand-new diagram by opening the editor to build from scratch or use a template.
Once your Venn diagram is ready, click Insert to place it directly onto your PowerPoint slide. You will now have a beautiful, expert-quality Venn diagram perfectly integrated into your presentation.
Option 2: Make a Venn diagram with SmartArt
Open a presentation and go to the slide where you want the diagram.
Go to the Insert tab and click the SmartArt icon.
Select a Venn diagram option and click OK.
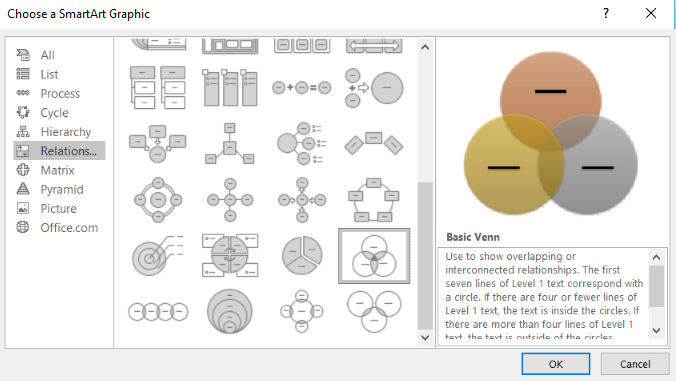
Then, you can format your Venn diagram in PowerPoint.
Add text: Fill out the text fields for each circle in the bullet list that appears.
Style circles: Right-click a circle and select Format Shape to open the formatting panel.
Change the design: Click the Design tab to adjust the standard layout.
Export: Choose File > Export > Change File Type to save as a PNG.
How do you make a Venn diagram in Excel?
If you’re working with data in Microsoft Excel and need to add a visual representation, you can include a Venn diagram using one of two methods: using the SmartArt tool directly in Excel or inserting a Venn diagram from Lucidchart using a free add-in.
Option 1: Make a Venn diagram in Excel with the SmartArt tool
Open a new Excel worksheet.
Write each category you want to capture in the spreadsheet columns.
Go to the Insert tab and click the SmartArt icon.
Choose the Venn diagram template you want to use.
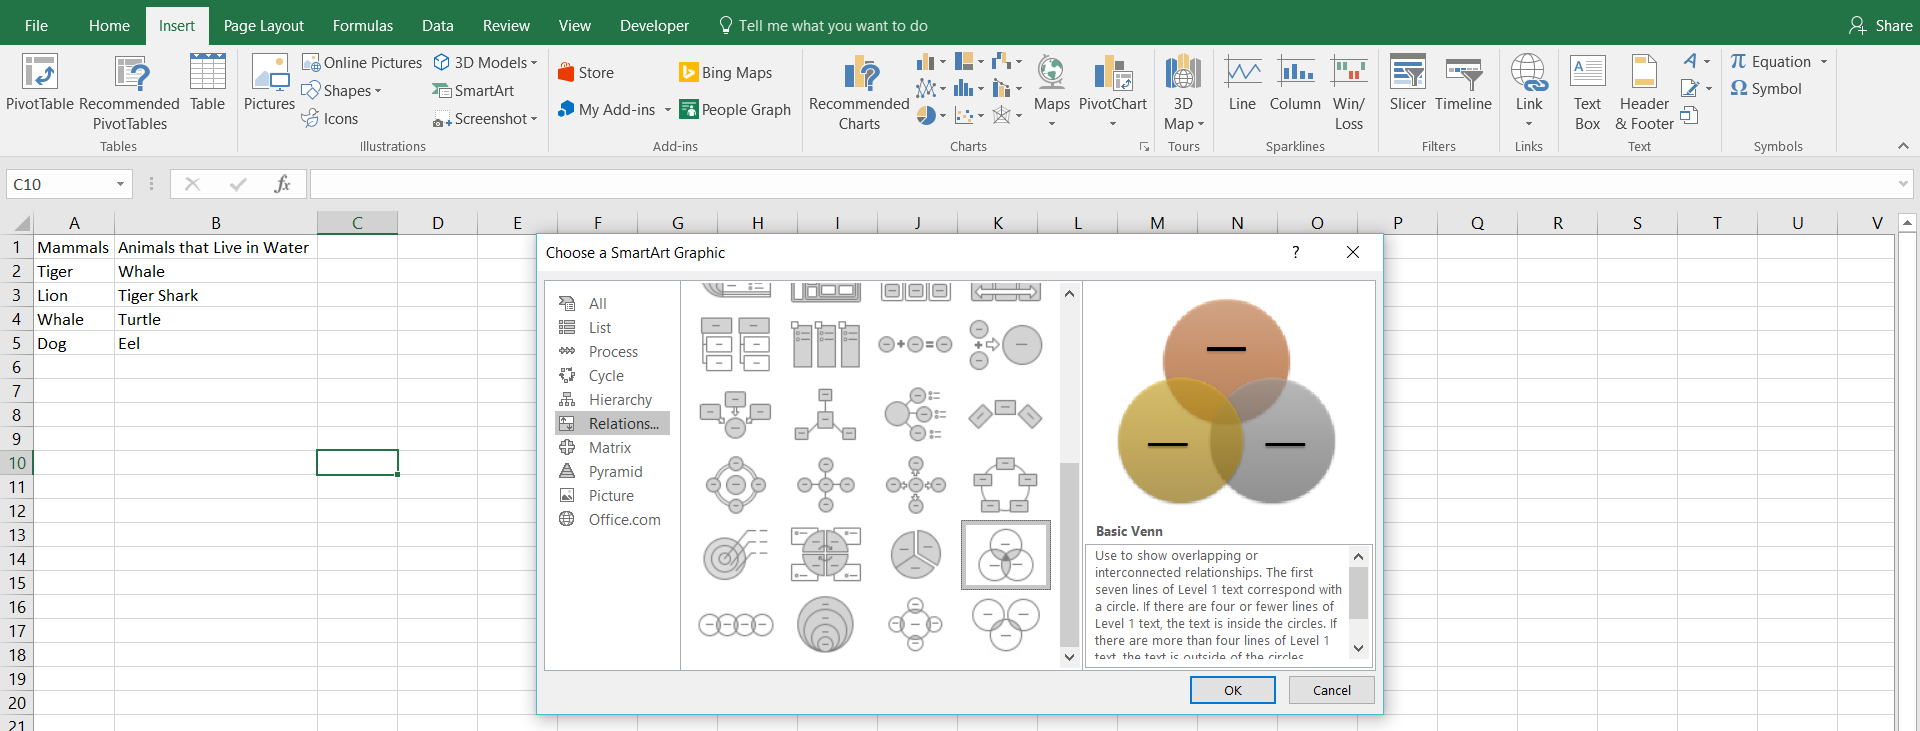
To format your Venn diagram in Excel, you can:
Add titles: Enter text in the menu that appears after you choose a template.
Add circles: Click into the diagram, then click Add Shape on the Design tab.
Remove circles: Select a shape and press Delete.
Style circles: Right-click a circle, select Format Shape, and change the color.
Add content: Draw text boxes on the circles and fill them with your lists.
Option 2: Use the Lucidchart add-in for Excel
To add a Venn diagram, you don’t have to struggle with Excel’s basic shape tools or rigid SmartArt. By using the free Lucidchart add-in for Microsoft Excel, you can create and insert professional diagrams without ever leaving your spreadsheet.
Install the Lucidchart add-in
Open an Excel workbook.
Go to the Insert tab, click on Add-ins, and then select Get Add-ins.
Use the search bar to find "Lucidchart."
Click Add next to the Lucidchart add-in and accept the terms and conditions.
The Lucidchart panel will become available within Excel. Log in with your Lucidchart credentials to access your existing documents.
Insert your Venn diagram
To build a new diagram, open the panel and click Create New Diagram to launch the Lucidchart editor. Alternatively, if you have already built a Venn diagram, you can just search for it and select it from your list of documents.
Select your Venn diagram from the list and click Insert.
Your diagram will appear on your spreadsheet as a high-resolution image.
If you ever need to make changes to the overlapping circles or text, select Edit in the add-in panel, update the diagram in the pop-up window, and click Insert again to apply the updates to your spreadsheet.
How do you make a Venn diagram in Word?
You can make a Venn diagram in Word in two ways. Embed a live diagram with the Lucidchart add-in, or build one with Word's shape library or SmartArt.
Option 1: Use the Lucidchart add-in for Word
The Lucidchart add-in integrates with Microsoft so you can insert a diagram without leaving your document.
Install the add-in
Open a Microsoft Word document.
Click File in the top toolbar.
Select Get Add-ins.
Click More Add-ins.
Search "Lucid" in the add-ins store.
Choose the Lucidchart add-in and click Add.
Follow the prompts to finish setup.
Insert a diagram
Open a Microsoft Word document.
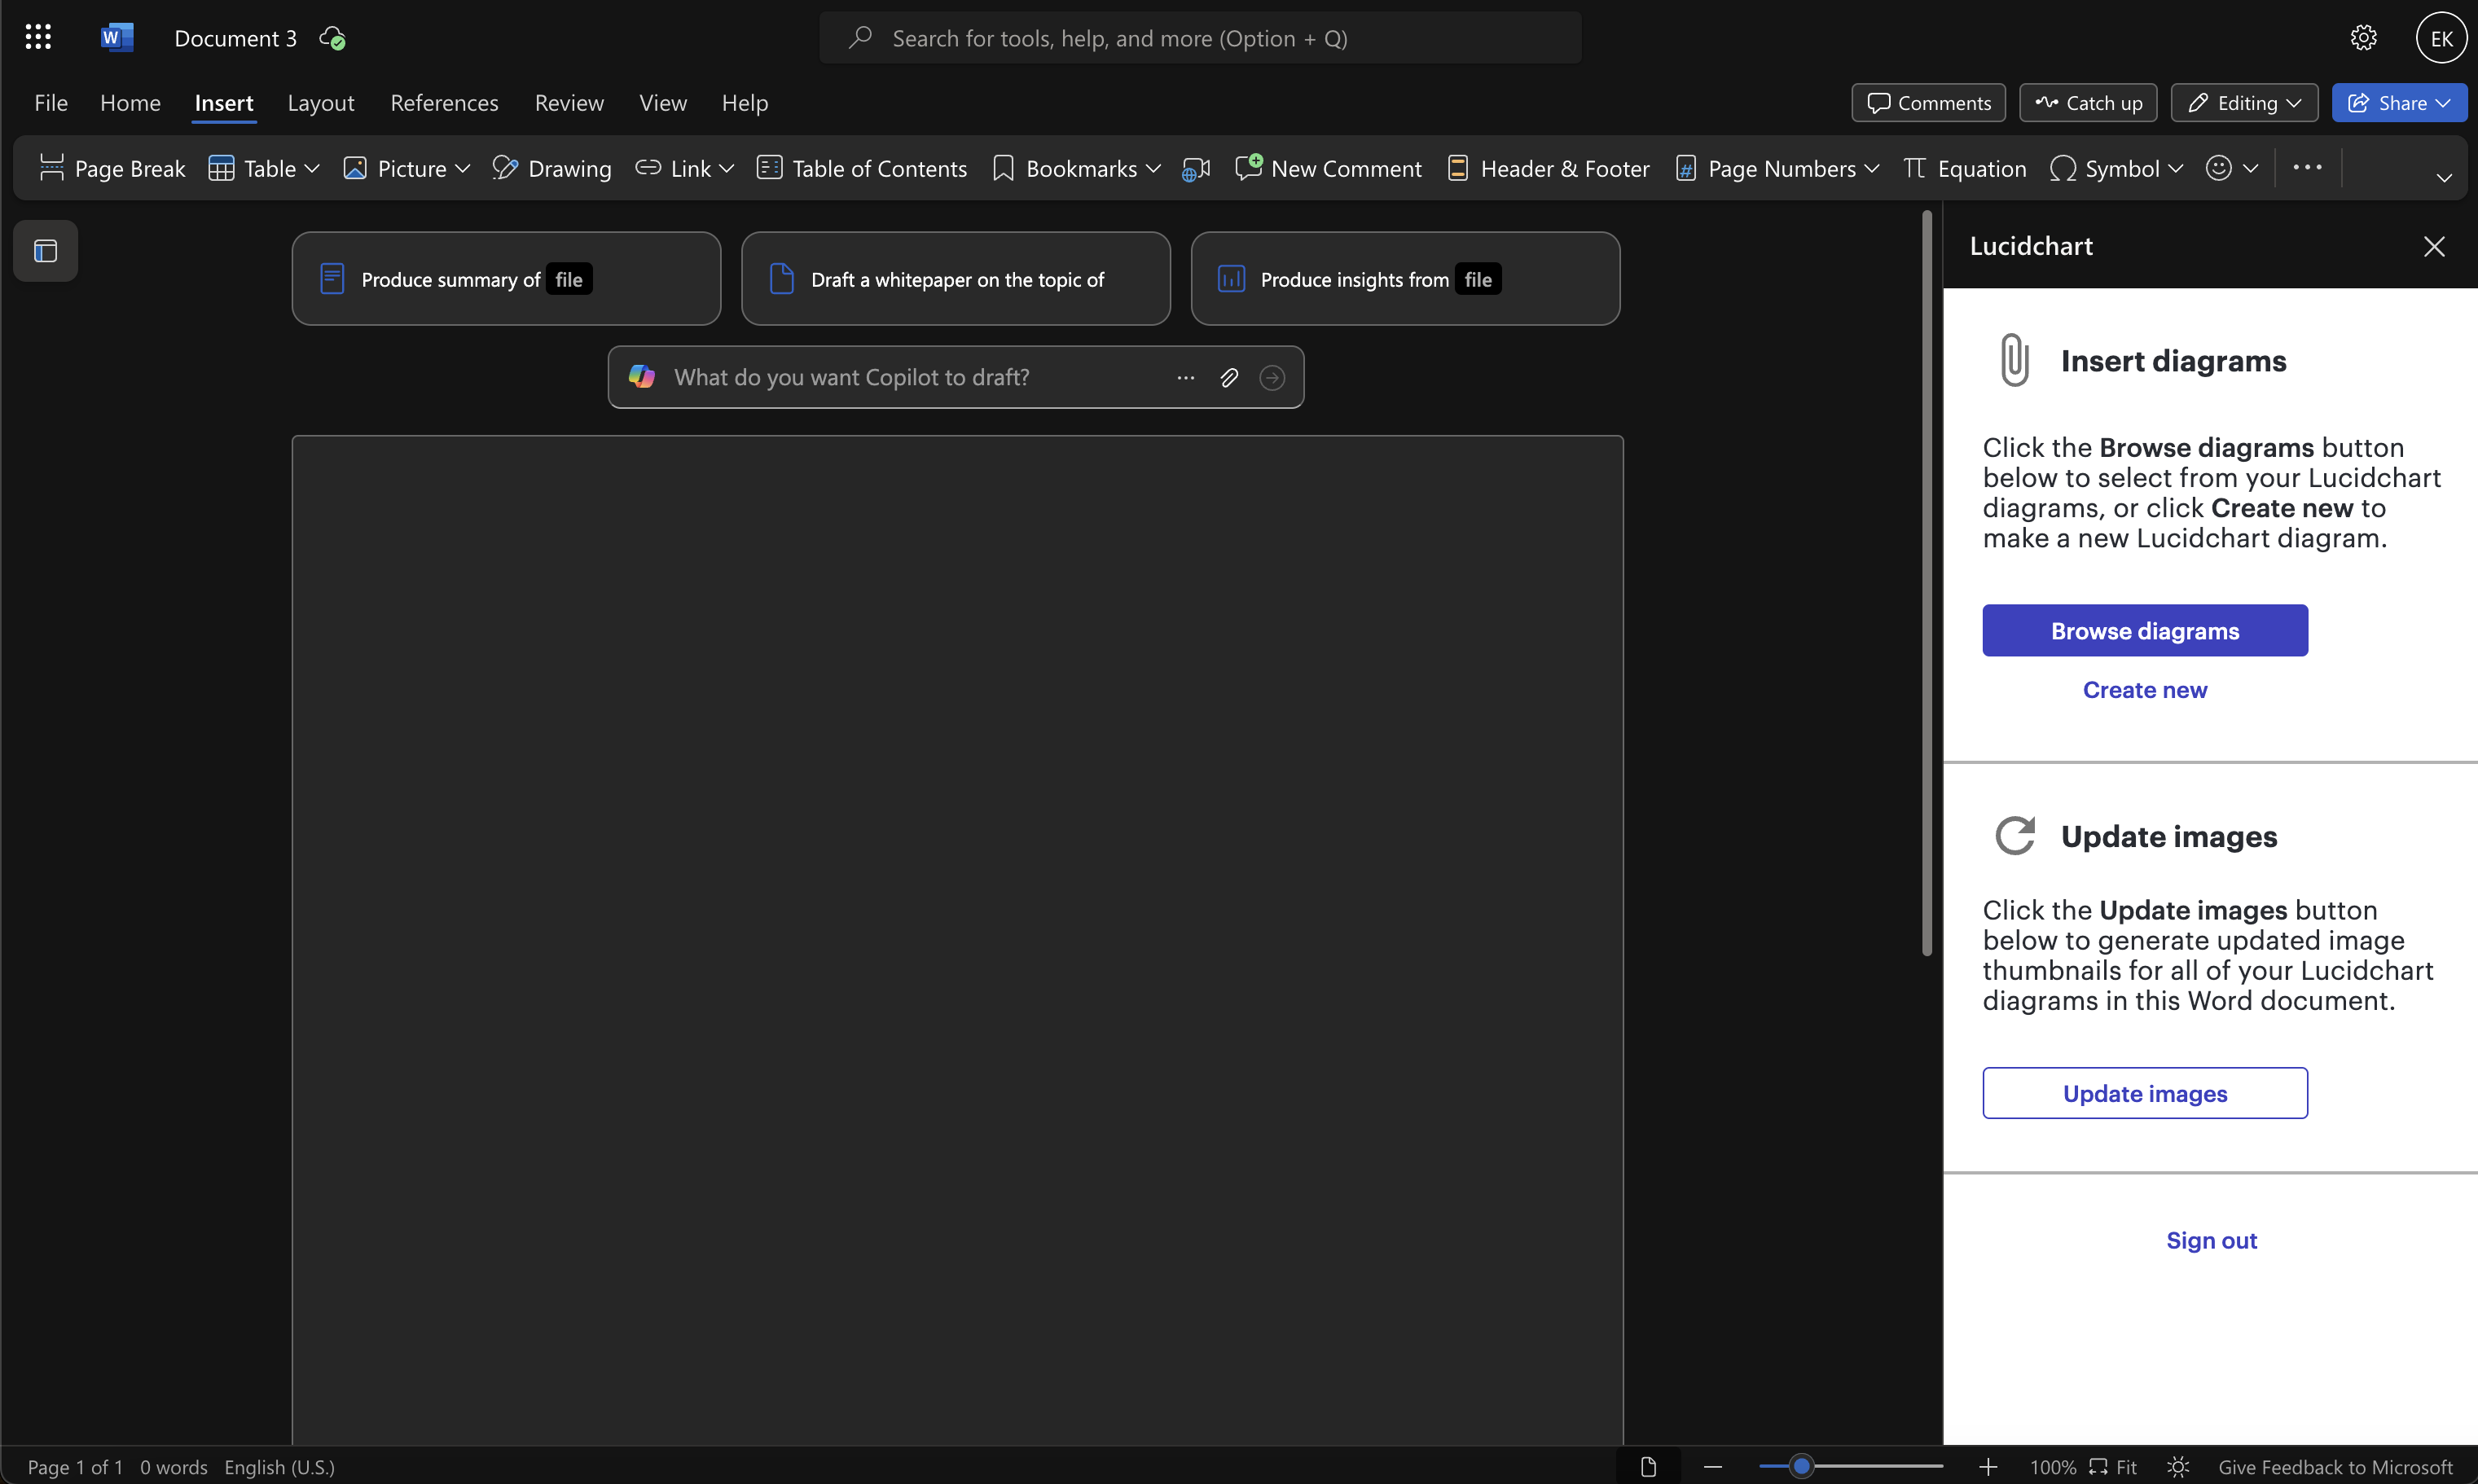
Click Insert in the toolbar.
Click My Add-ins and select the Lucidchart add-in.
Log in to Lucid if prompted.
In the panel that appears, select the diagram you want to insert.
Option 2: Use the shape library or SmartArt
To use the shape library:
Go to the Insert tab and select Shapes in the Illustrations group.
Add shapes and lines to build your diagram.
Return to the Insert tab and choose Text Box to add labels.
Save your document.
To use SmartArt graphics:
Go to the Insert tab and select SmartArt in the Illustrations section.
Open the Relationship tab, select a Venn diagram layout, and click OK.
Click [Text] in the Text pane to add your labels.
Format the colors and sizes as needed.
Save the document.
How do you make a Venn diagram in Lucidchart?
Build a Venn diagram in Lucidchart to get a reusable, collaborative visual you can share and edit anywhere. Trusted by 100 million users across more than 180 countries, Lucidchart is a Venn diagram maker built for both technical and non-technical teams.
1. Sign up for a free Lucidchart account
Create a free account to open the editor and start a new document.
2. Add shapes or start from a template
Build it manually: In Lucidchart, add the Venn diagram shape library in the left-hand toolbar. Then drag a shape onto the canvas.
Start from a template: On your documents page, click + New and select Create from template. Search "Venn diagram" and choose one of the Venn diagram templates.
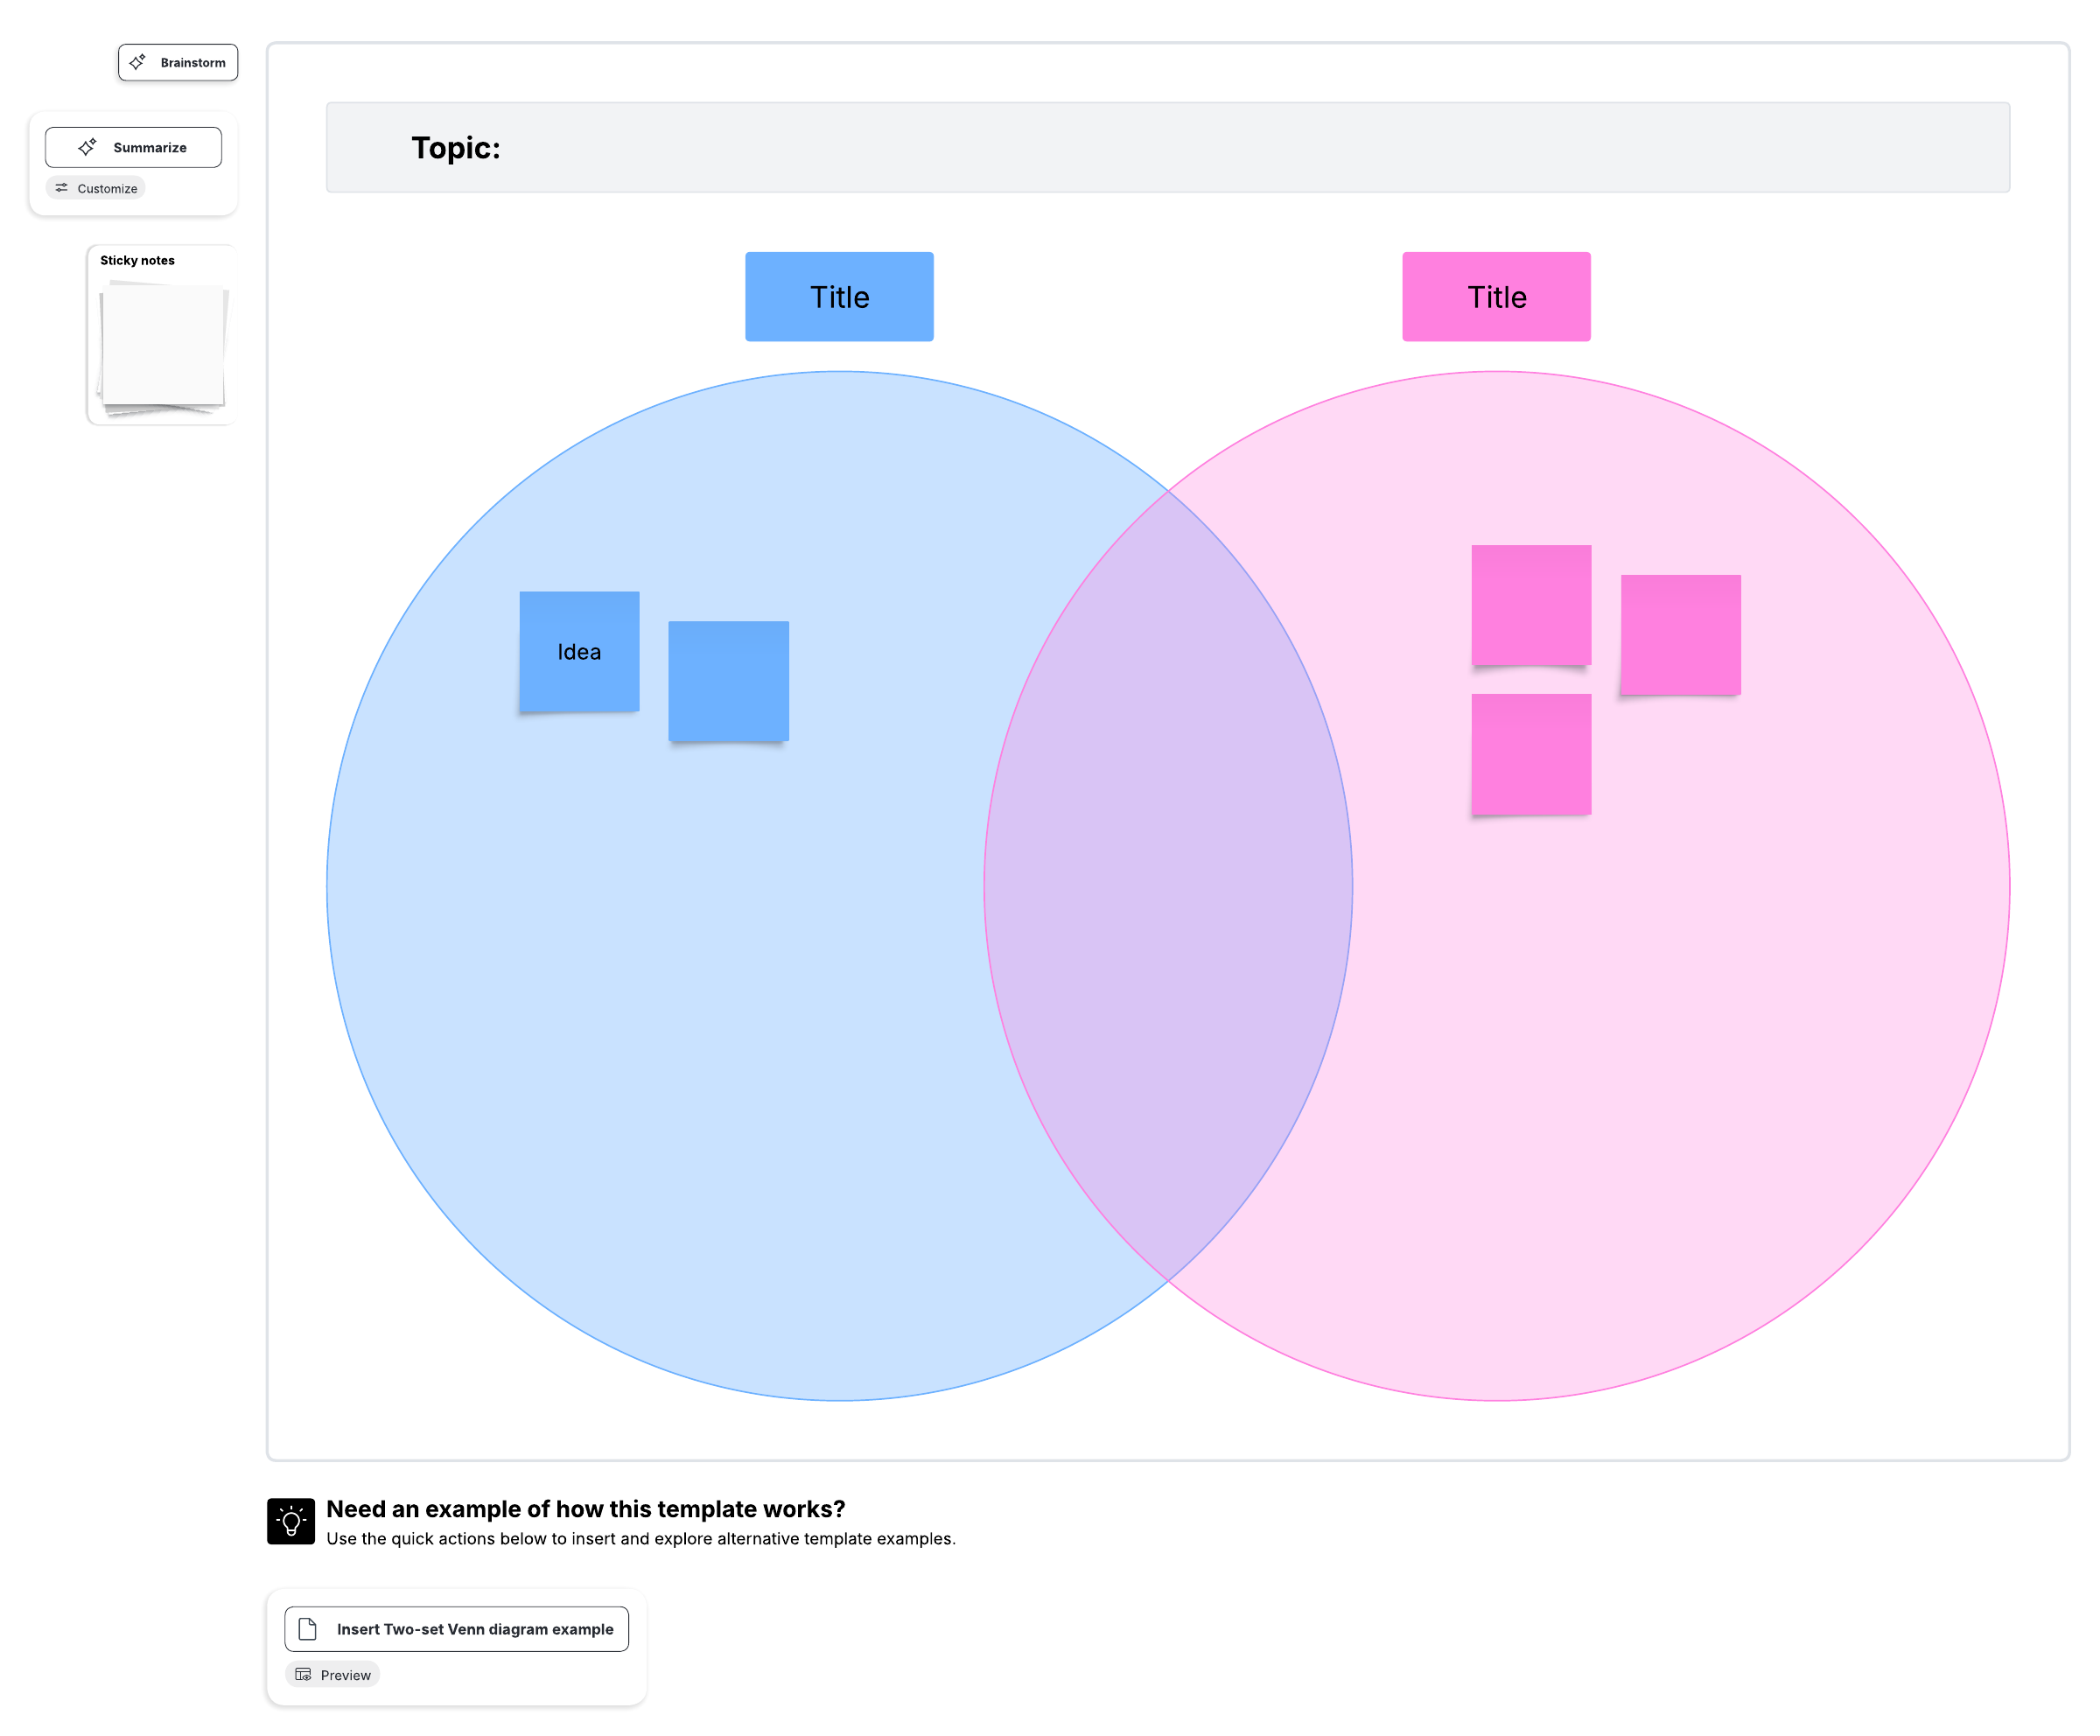
3. Style your Venn diagram
For quick edits, click any shape. You can use the shape editing bar to set font size, alignment, fill color, and gradients.
Ready to build your own Venn diagram? Sign up for free, opens in a new tab and start building a Venn diagram in Lucidchart today.
How do you make a Venn diagram in Google Slides?
You can make a Venn diagram in Google Slides by embedding your Lucidchart diagrams into Google Slides or using the built-in Venn diagram in Google Slides.
Option 1: Use the built-in diagram tool in Google Slides
Click Insert in the top menu bar and select Diagram.
In the right-side panel that opens, click Relationship.
Browse the layouts and select the Venn diagram template.
Alternatively, you can click Insert > Shape to add custom circle shapes. Then, add text boxes for labels.
Option 2: Use the Lucidchart add-on for Google Slides
It’s easy to insert your Venn diagrams in Google Slides with the Lucidchart add-on. This keeps your presentation diagrams consistent with the rest of your work.
Open a presentation and select Extensions > Add-ons > Get add-ons.
Find and install Lucidchart, then grant the requested permissions.
Click the Lucidchart icon in the right-side toolbar, select your Venn diagram, and insert it onto the slide.
Teams use Lucidchart to create Venn diagrams because it’s easy to customize visuals, collaborate with teammates, and integrate with other applications, ensuring your diagrams are consistent across tools.