Key takeaways
A Venn diagram uses overlapping circles or shapes to show the logical relationships between two or more sets, making similarities and differences easy to see.
The overlapping region, called the intersection, holds the items that belong to every set involved, while the union covers everything across all sets. Venn diagrams are clearest when they compare four sets or fewer.
Venn diagrams are used across math, statistics, logic, linguistics, computer science, teaching, and business to compare options and reason through decisions.
Named after English logician John Venn, who wrote about them in 1880, Venn diagrams build on the earlier Euler diagrams of Leonhard Euler and circle drawings by Gottfried Wilhelm Leibniz.
Venn diagrams show every possible relationship, even when a set is empty, which is the key difference from Euler diagrams, which exclude empty sets.
You can build a Venn diagram in Lucidchart, Google Docs, PowerPoint, Excel, or Word.
Venn diagrams help you see what groups have in common and what sets them apart. Whether you are comparing product features, analyzing survey data, or teaching set theory, a Venn diagram turns abstract relationships into something you can point to and discuss. In this guide, you will learn what Venn diagrams are, where they came from, how to read their symbols, and how to build your own.
What is a Venn diagram?
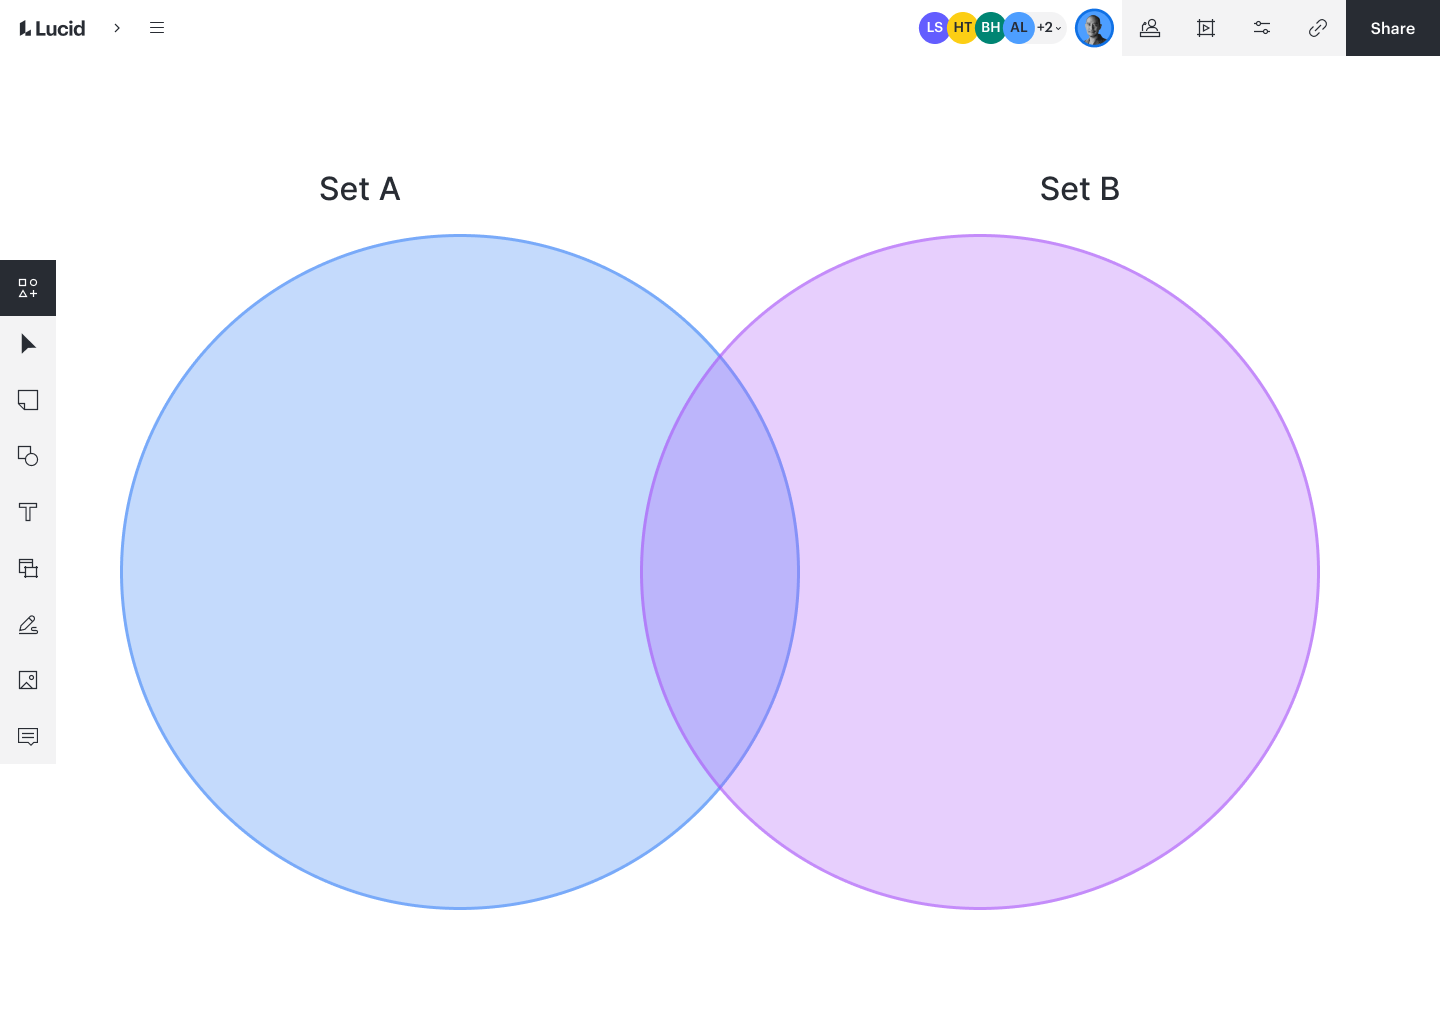
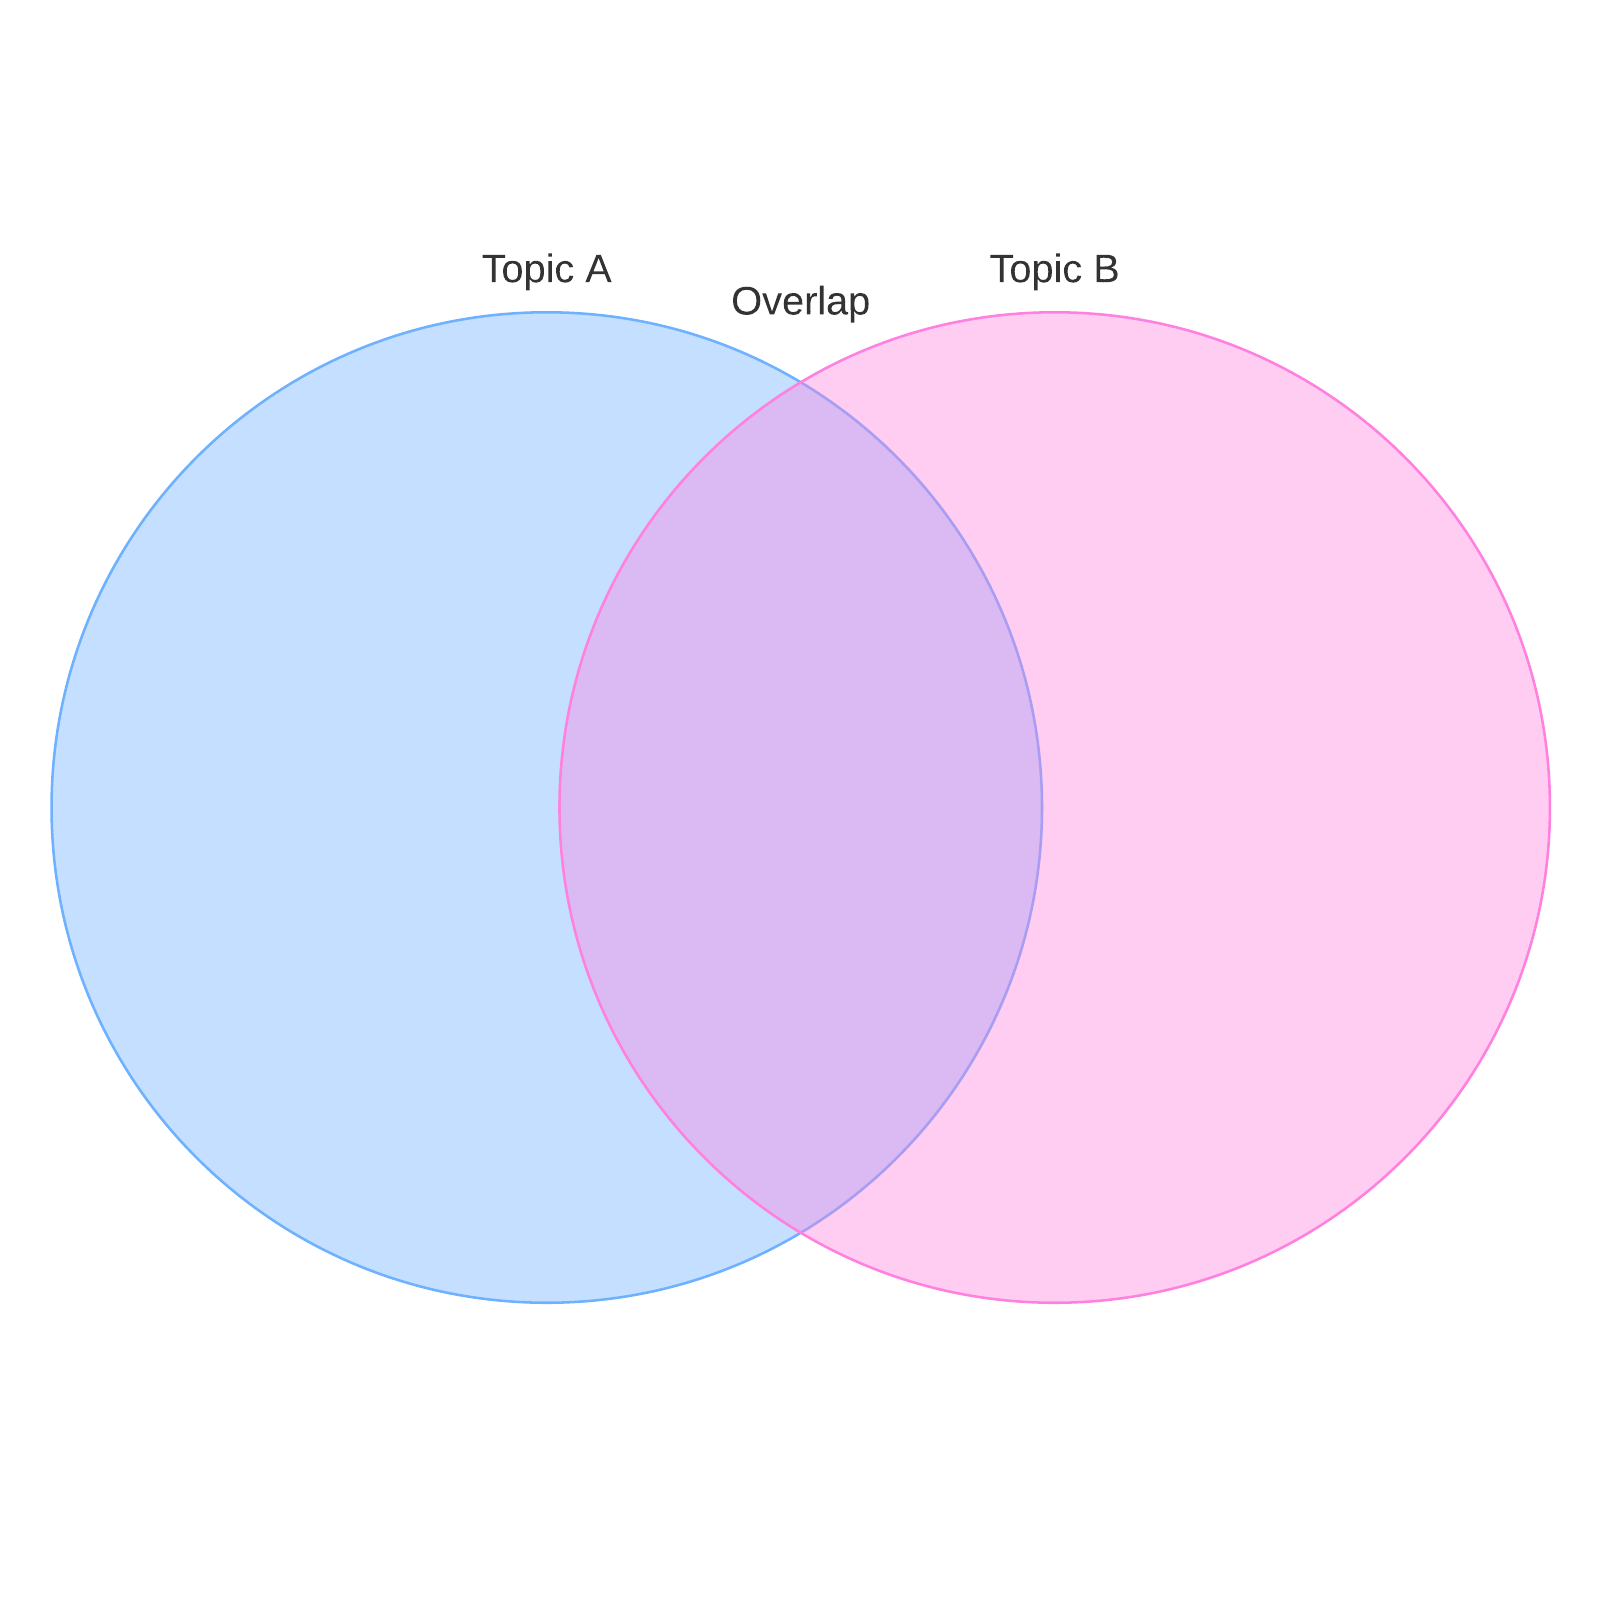
A Venn diagram uses overlapping circles or other shapes to illustrate the logical relationships between two or more sets of items. It graphically organizes these items to highlight their similarities and differences.
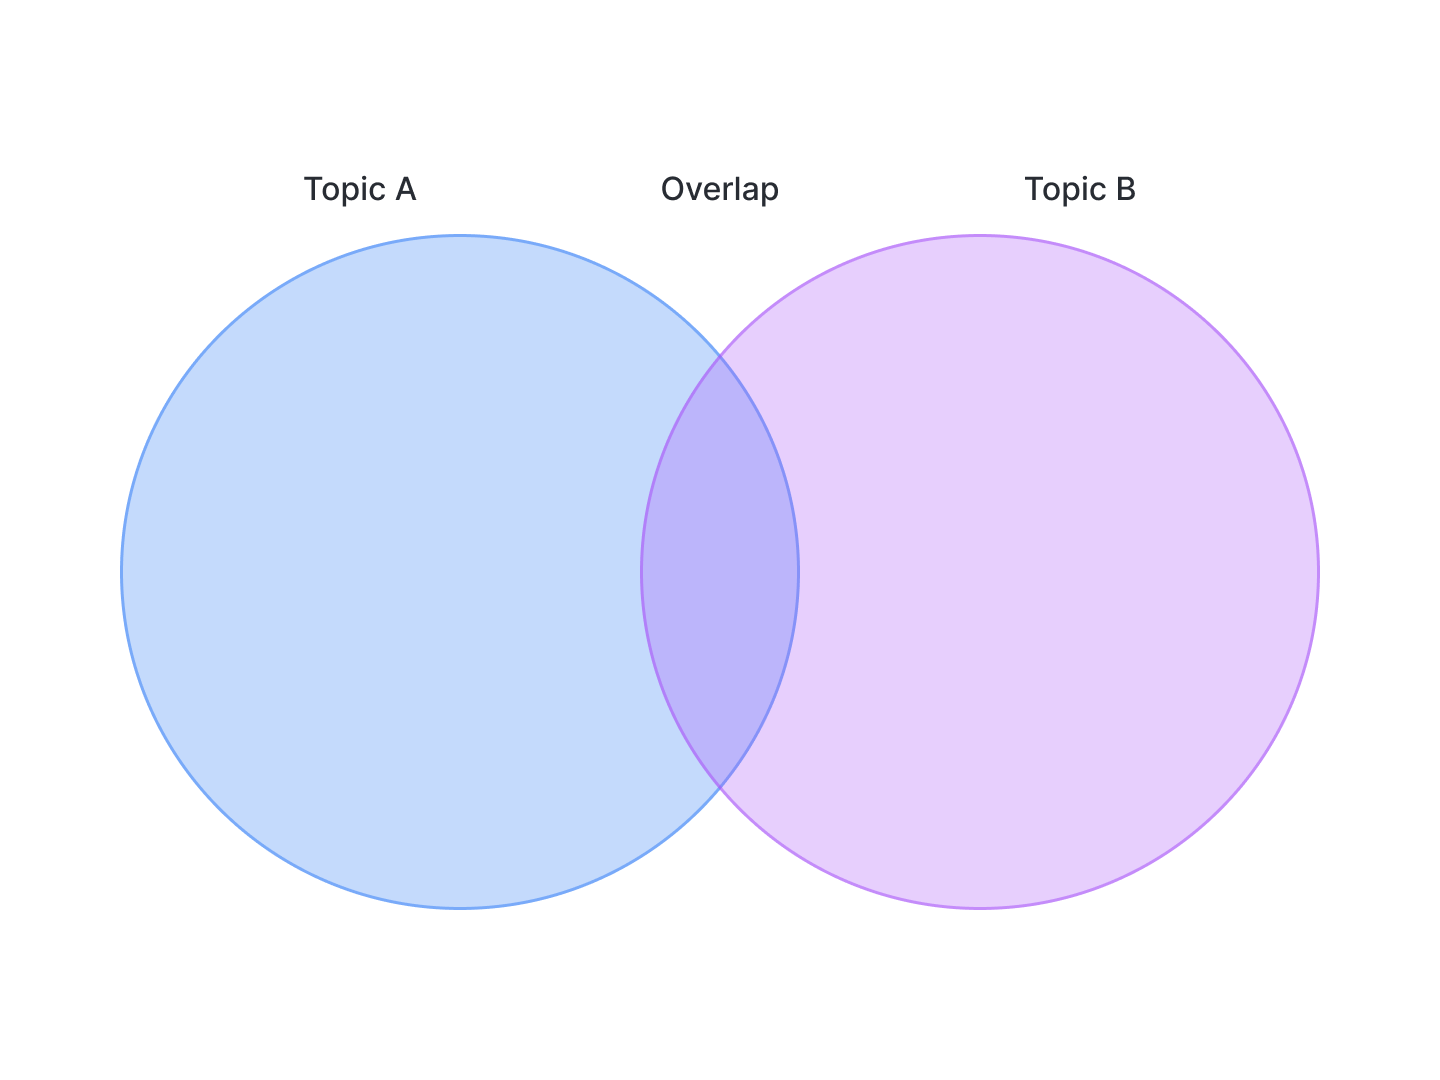
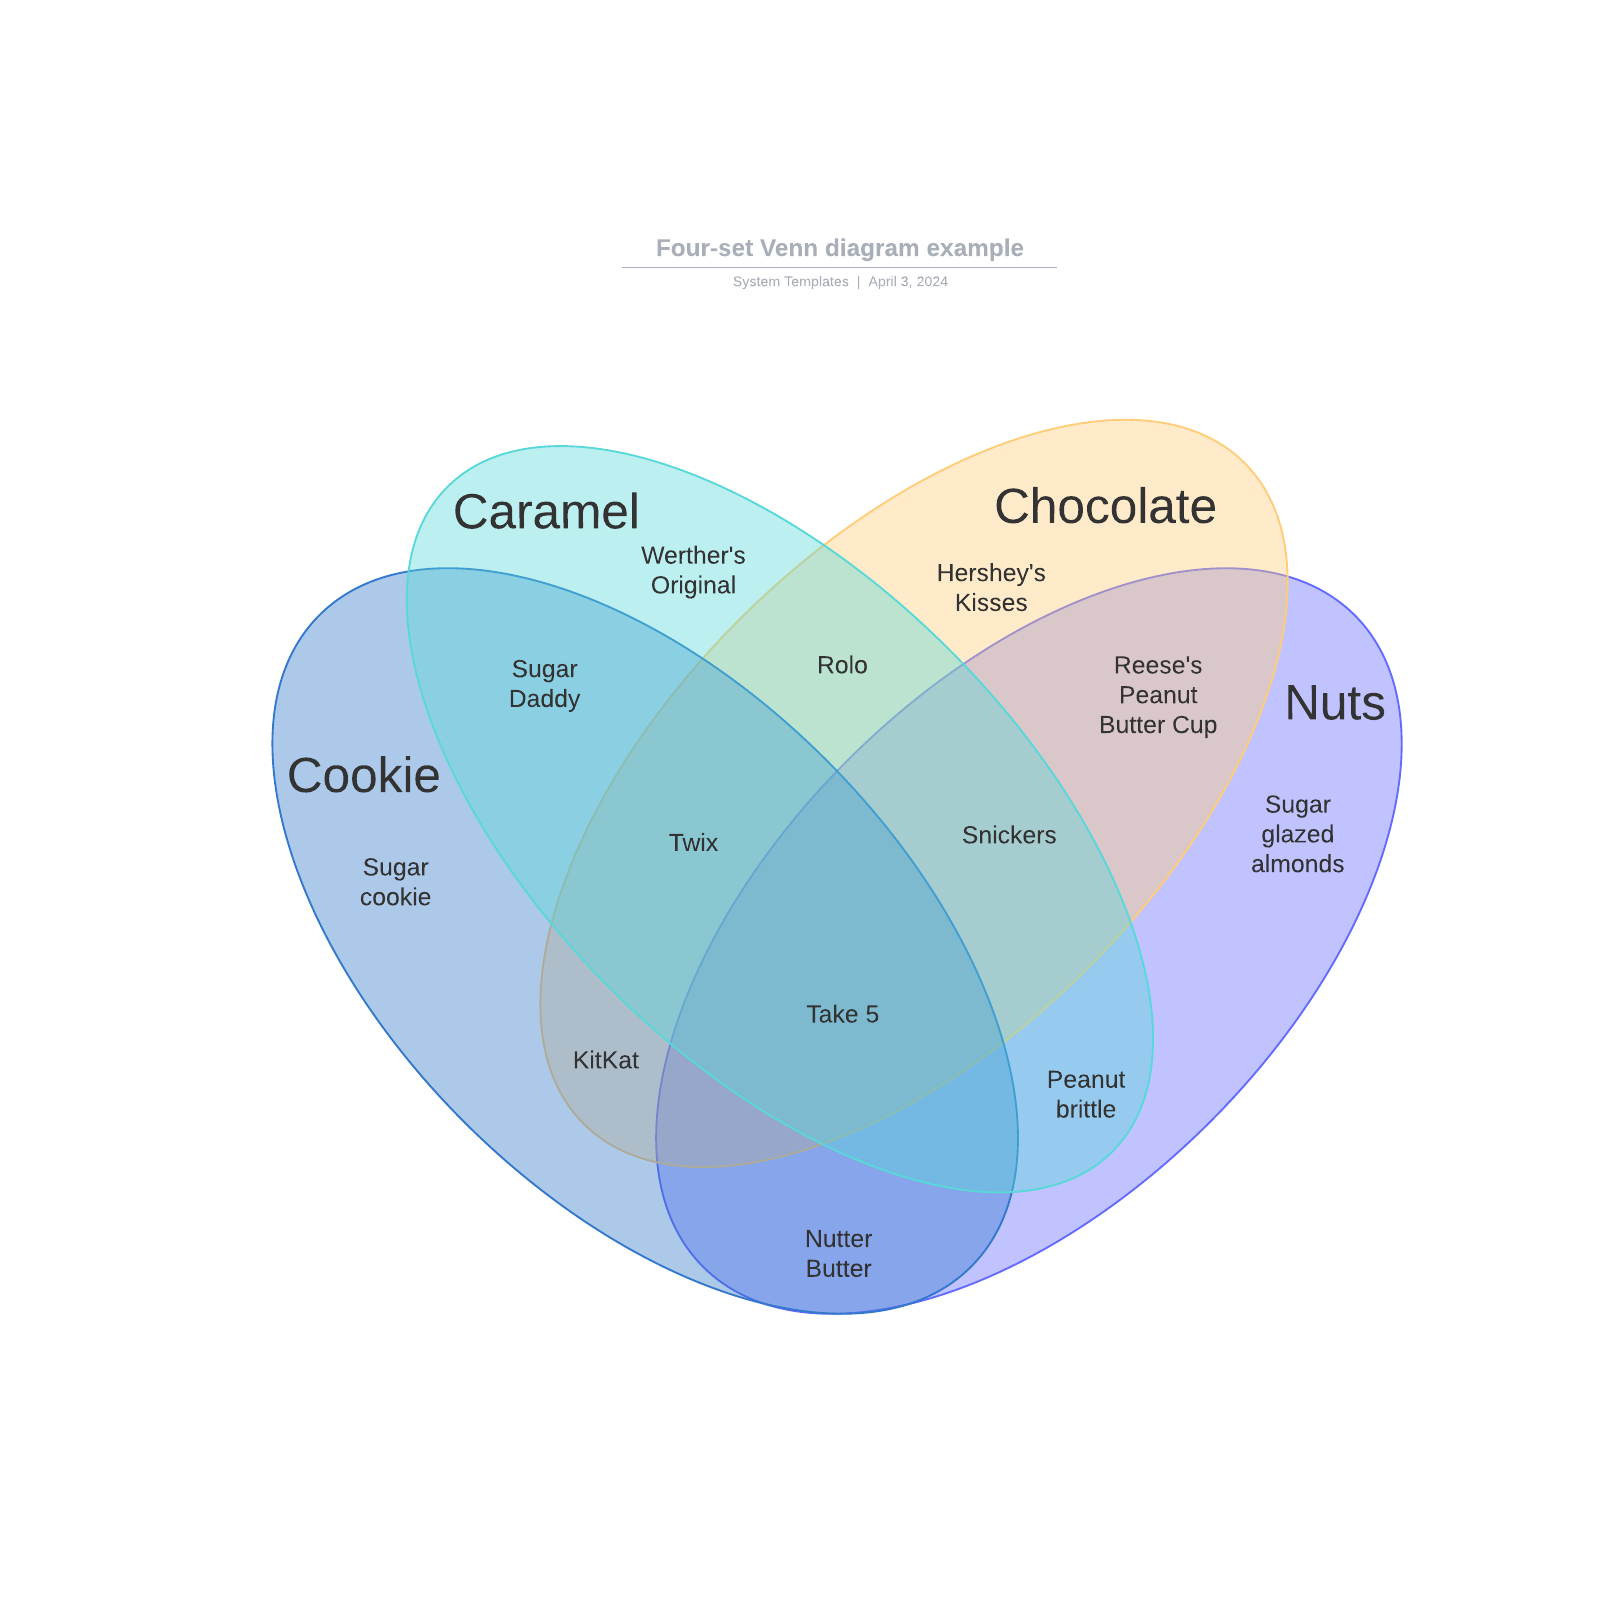
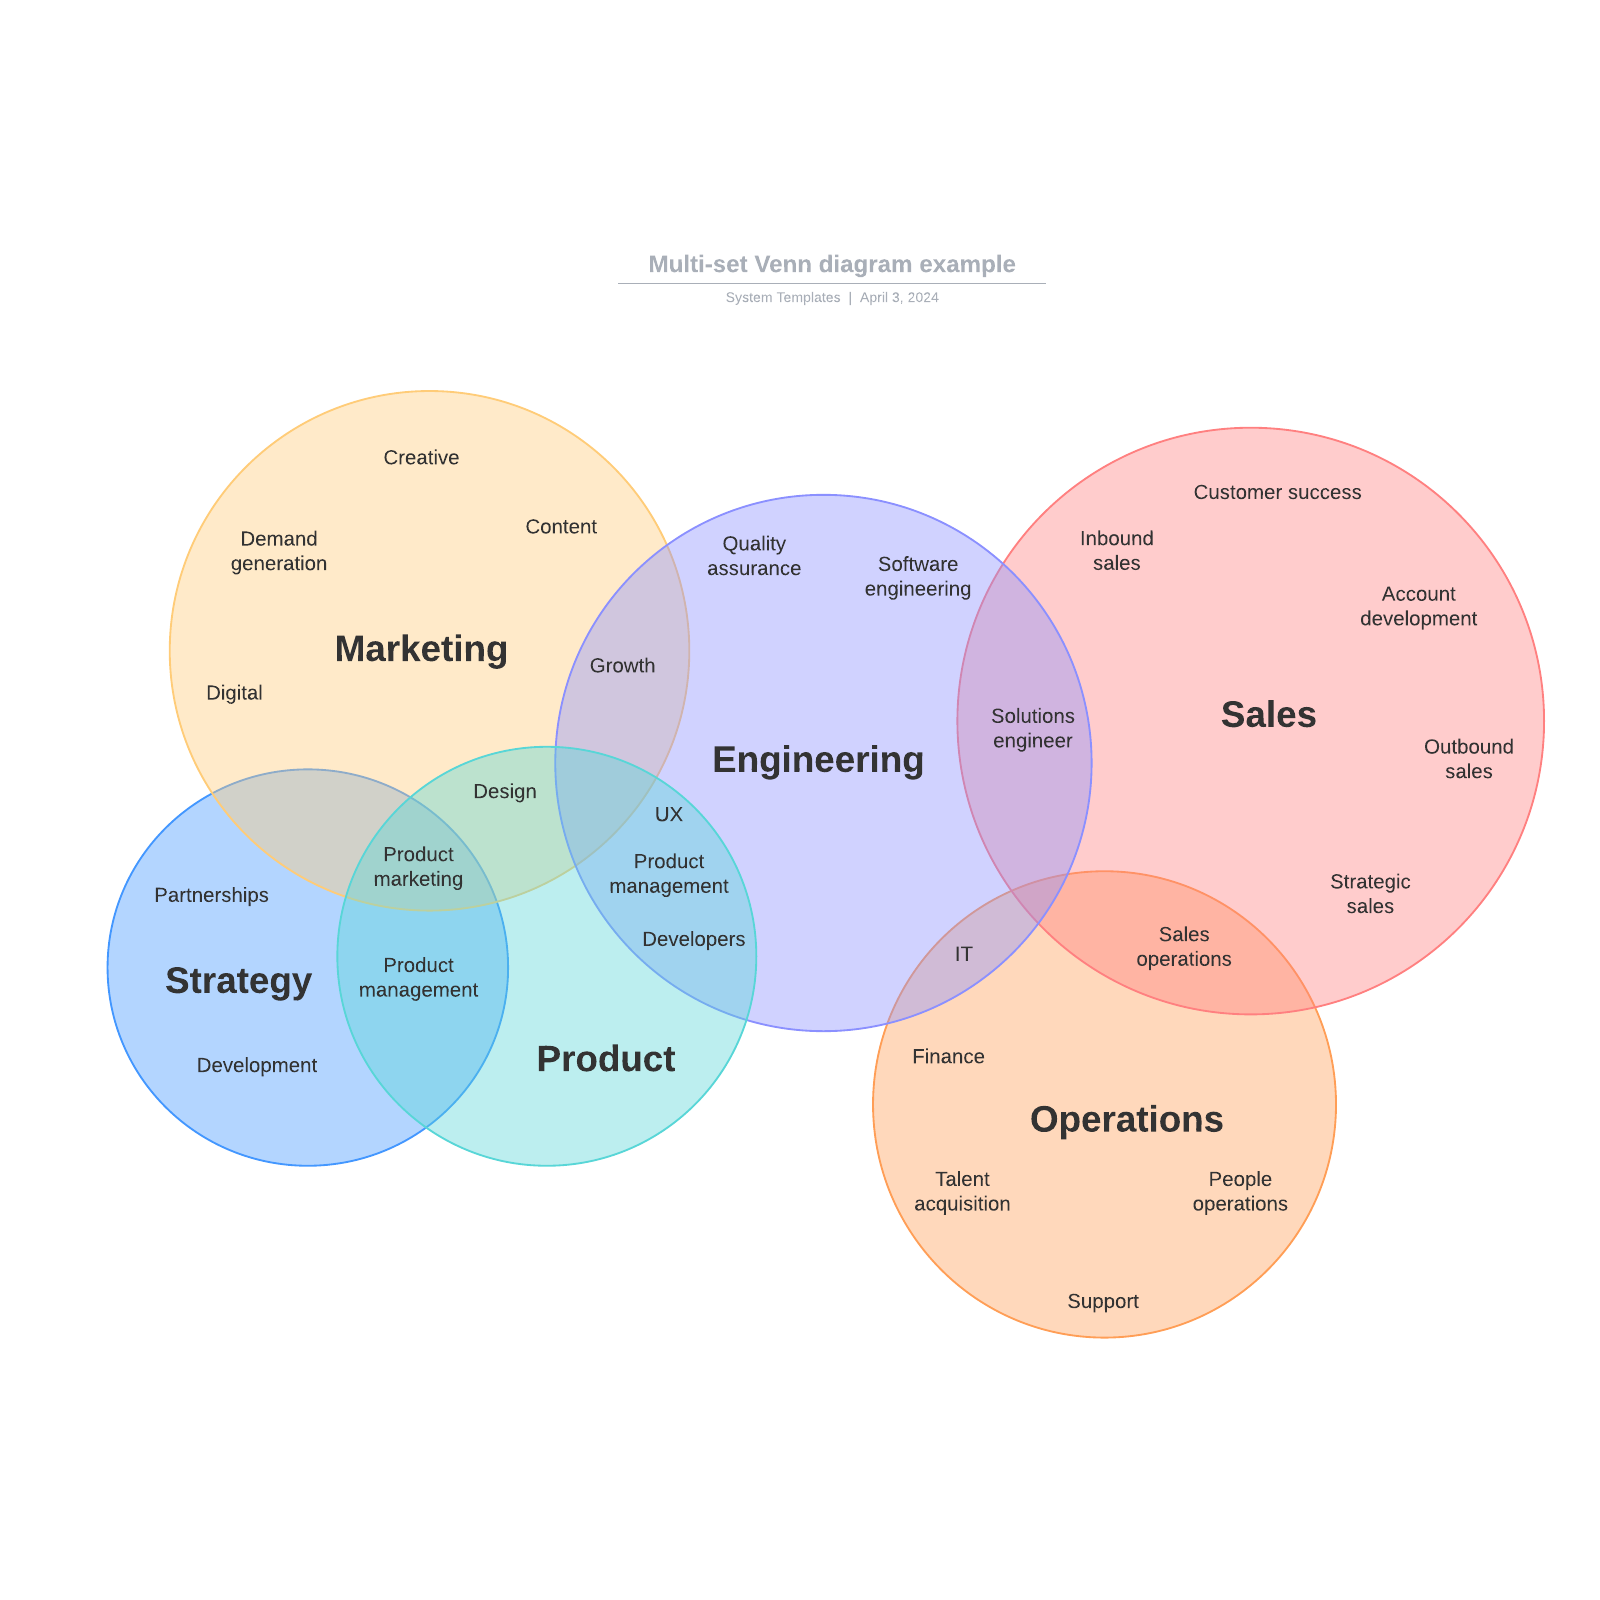
Venn diagrams, also called set diagrams or logic diagrams, can be as simple as two sets, or they can grow to seven or more. However, Venn diagrams are clearest when they compare four or fewer sets.
Venn diagrams are closely related to Euler diagrams, opens in a new tab. The key difference is that an Euler diagram omits a set when no items exist in it, while a Venn diagram shows every possible relationship, even when a set is empty.
Venn diagram purpose and benefits
There are many reasons to try a Venn diagram:
Visually organize information to see relationships between sets, such as commonalities and differences.
Compare two or more choices to clearly see what they share and what distinguishes them, which is useful when selecting a product or service.
Solve complex mathematical problems by mapping sets and their overlaps.
Compare data sets, find correlations, and predict the probability of certain occurrences.
Reason through the logic behind statements or equations.
Venn diagram use cases
Venn diagrams are widely used across different subjects and industries, including:
Math: Venn diagrams teach basic concepts such as sets, unions, and intersections, and they support advanced work in set theory, an entire branch of mathematics.
Statistics and probability: Analysts use Venn diagrams to compare data sets, assess degrees of overlap, and predict the likelihood of specific events in predictive analytics.
Logic: Venn diagrams help determine the validity of arguments and conclusions in deductive reasoning.
Linguistics: Researchers use Venn diagrams to study the commonalities and differences among languages.
Reading comprehension: Students draw Venn diagrams to compare and contrast ideas they read about.
Computer science: Programmers use Venn diagrams to visualize computer languages and hierarchies.
Business: Teams use Venn diagrams to compare and contrast products, services, or processes and to communicate those comparisons clearly.
Venn diagram history
Venn diagrams are named after English logician John Venn, who used them in a paper published in the Philosophical Magazine and Journal of Science in 1880. However, the Venn diagram’s roots go back even further.
In the 1200s, philosopher and logician Ramon Llull of Majorca used a similar type of diagram, and German mathematician and philosopher Gottfried Wilhelm Leibniz drew comparable circle diagrams in the late 1600s. In the 1700s, Swiss mathematician Leonhard Euler developed what became known as the Euler diagram, the most direct forerunner of the Venn diagram. The term "Venn diagram" wasn’t published until 1918. Venn diagrams have continued to evolve over time into the diagrams that we know and use today.
Venn diagram glossary
Keep these terms in mind when making and interpreting Venn diagrams.
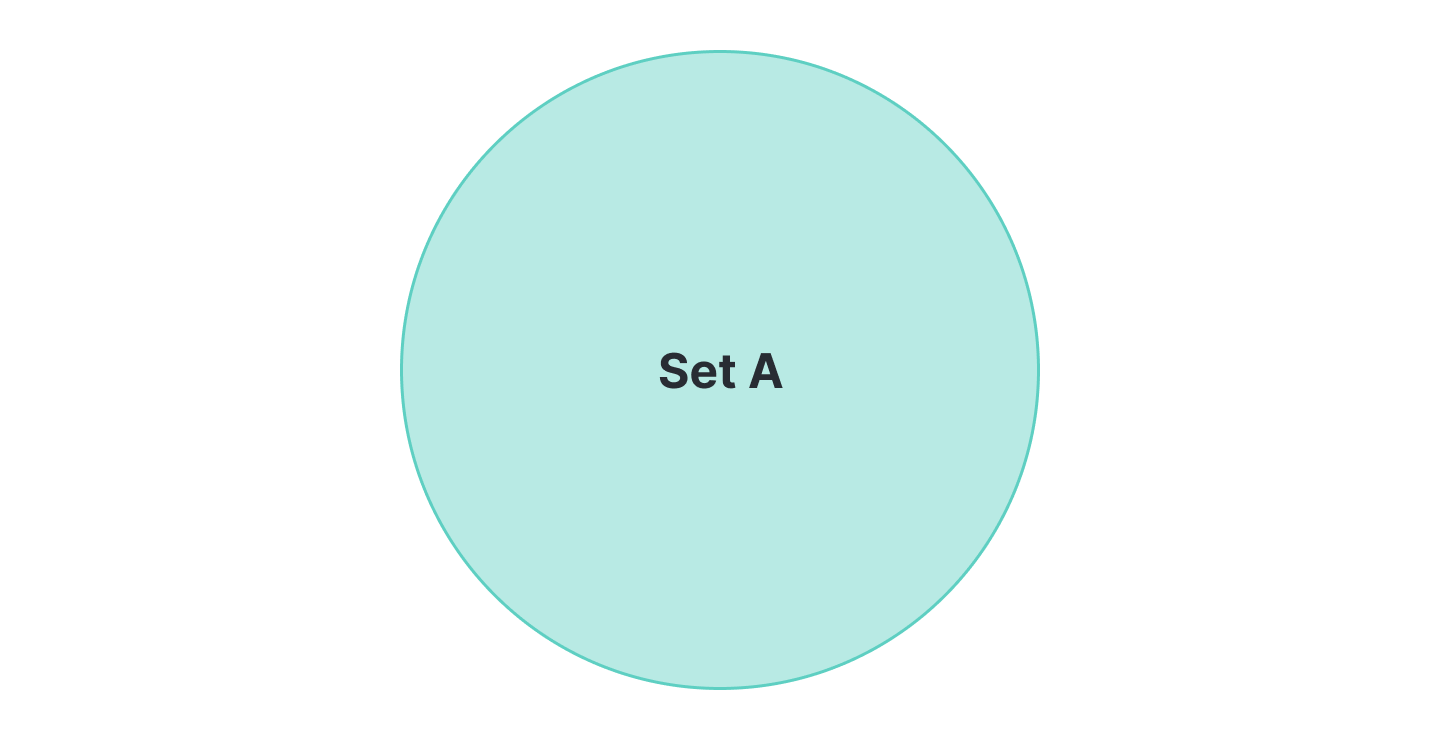
Set: a collection of things, which may be called items, objects, or members
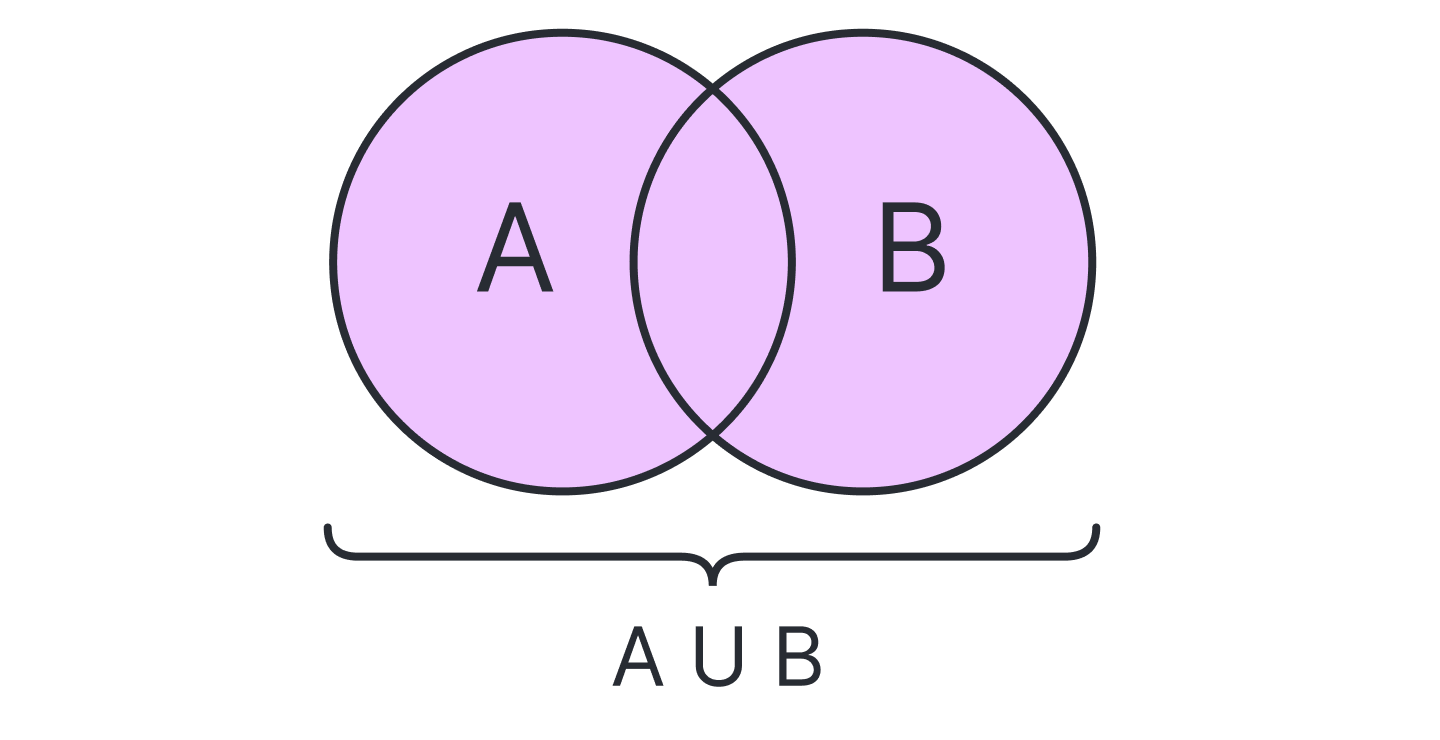
Union: all items across all of the sets
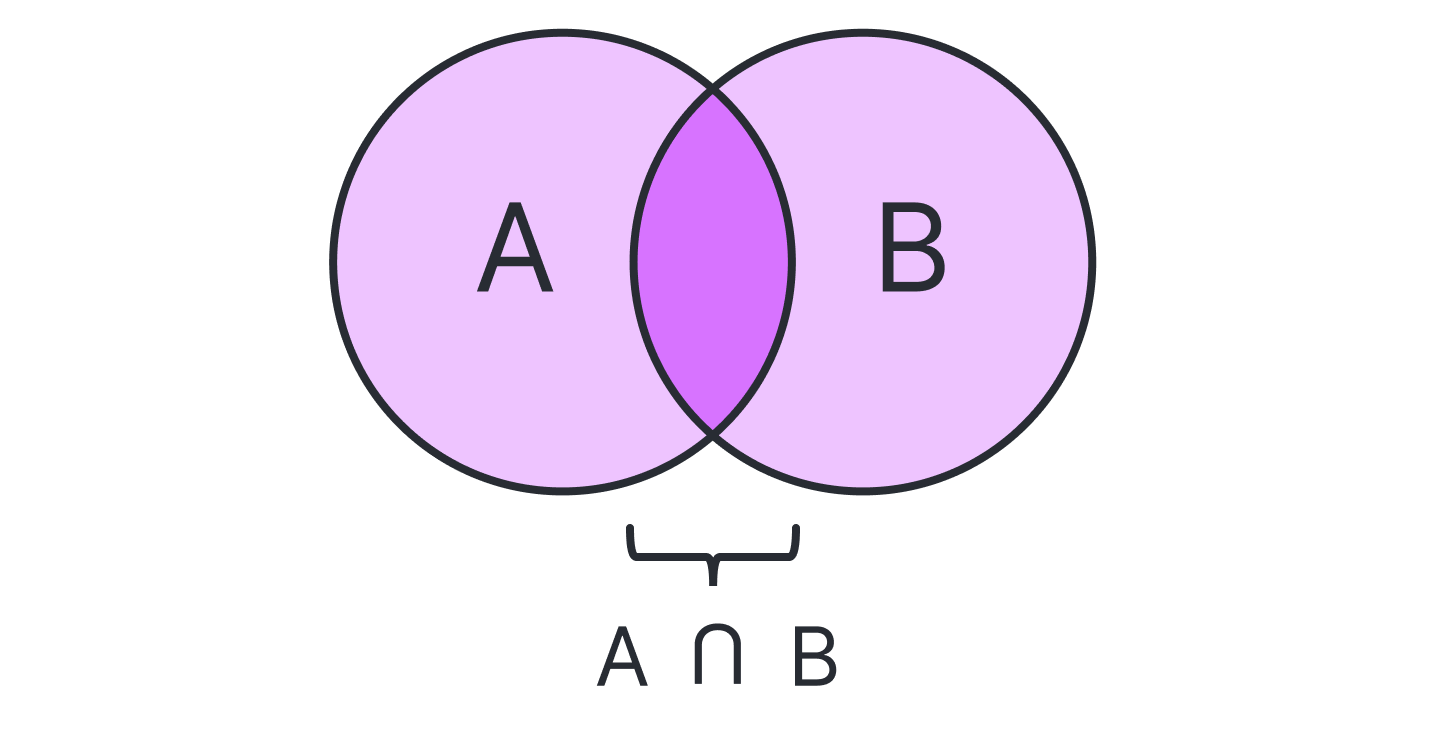
Intersection: the items that overlap between sets, sometimes called a subset
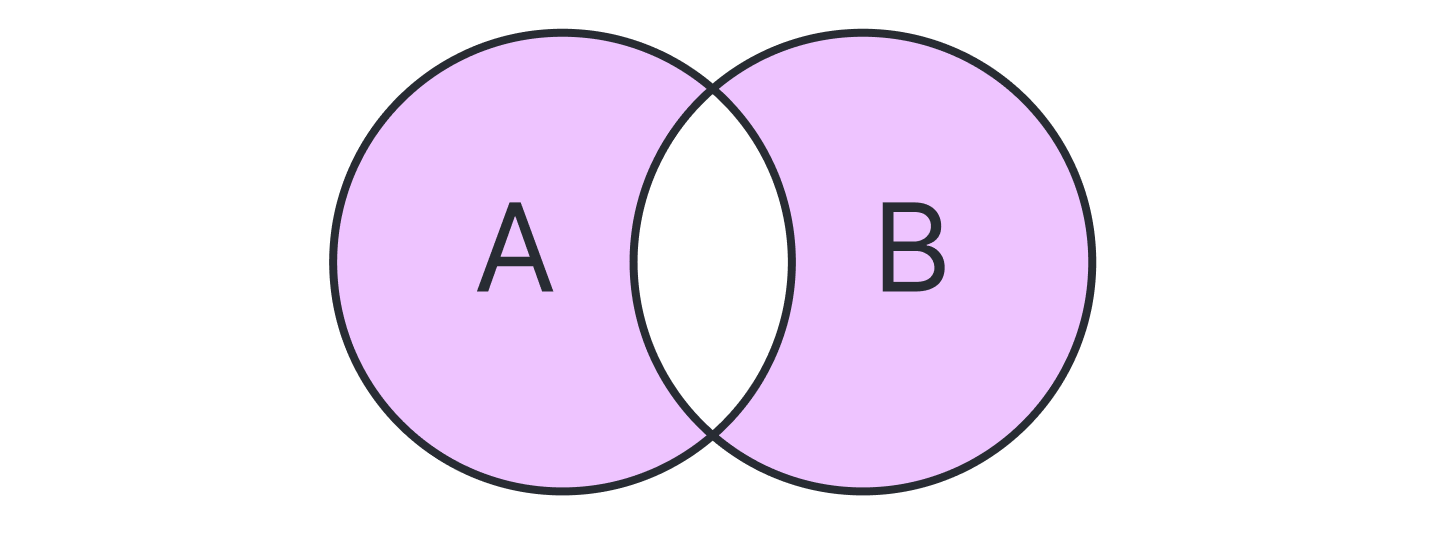
Symmetric difference of two sets: everything except the intersection
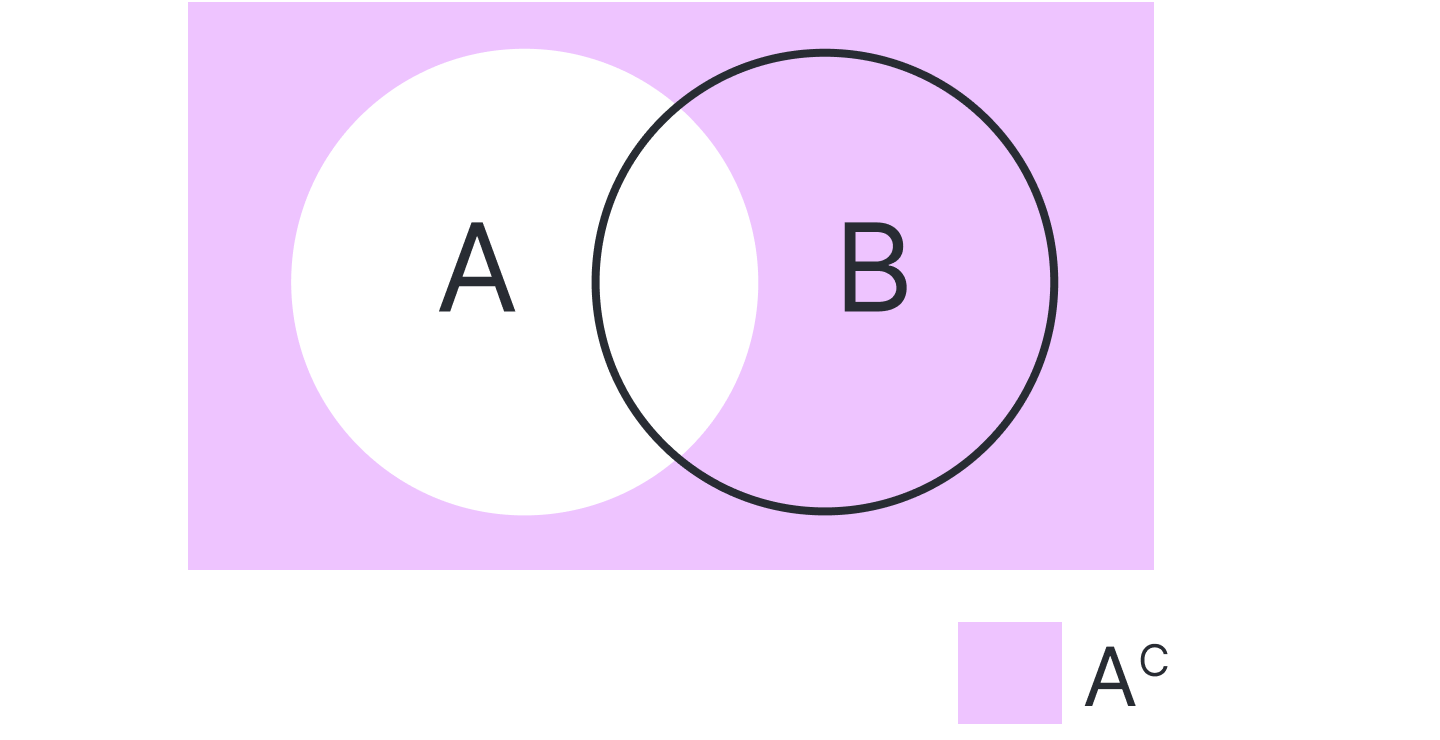
Absolute complement: everything that is not in the set
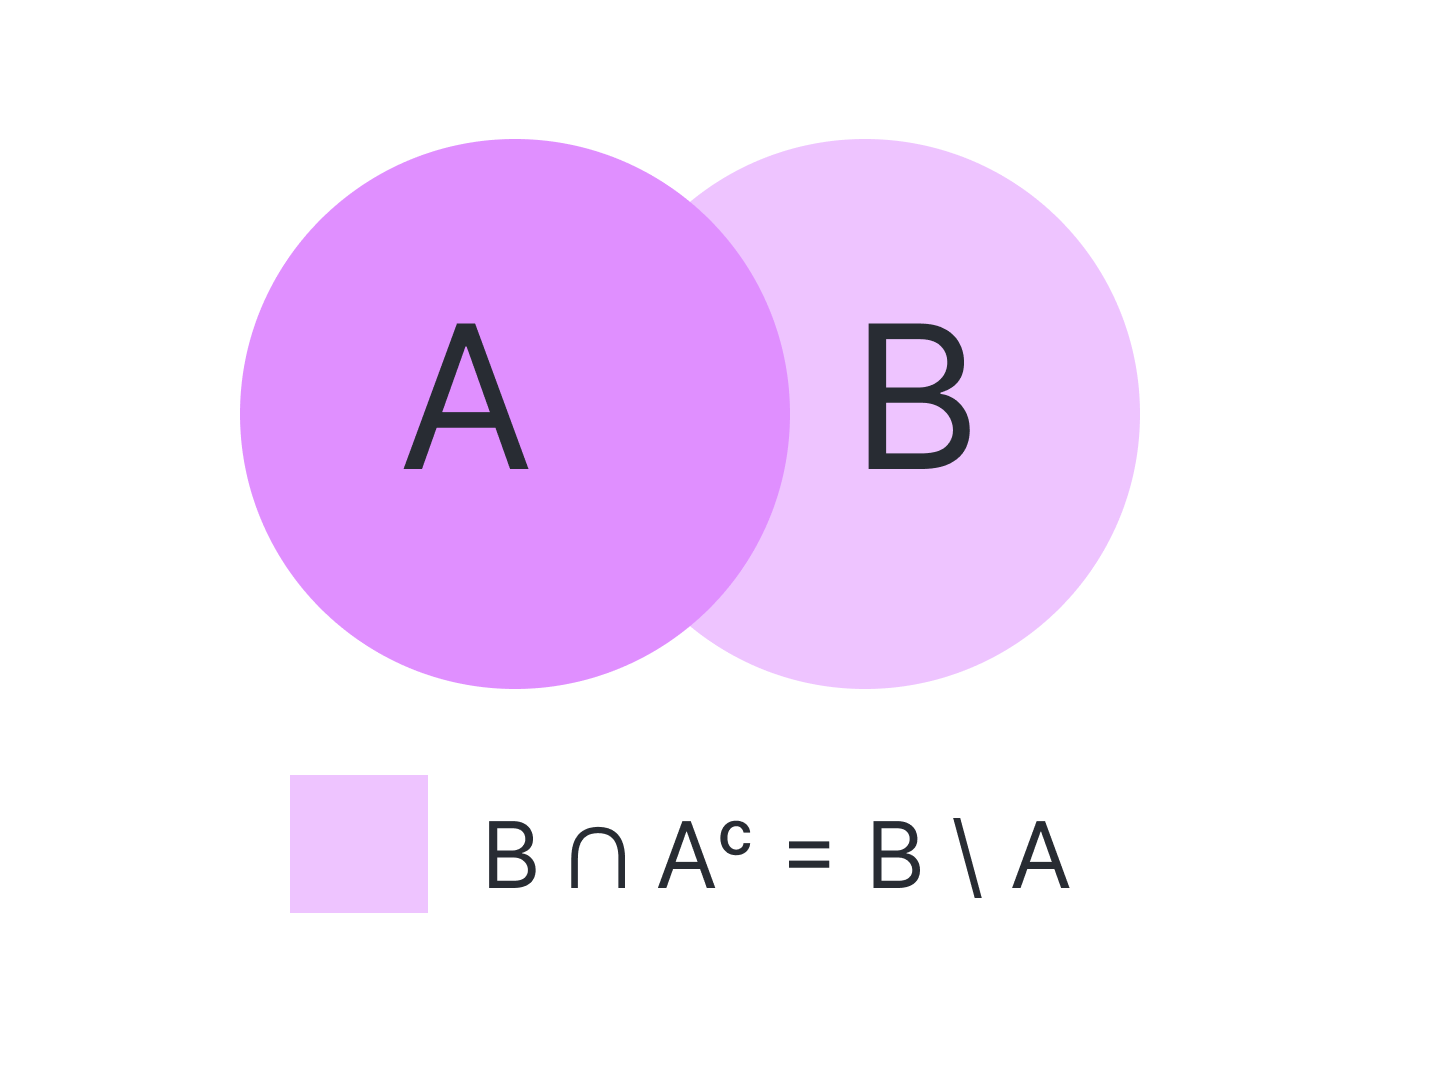
Relative complement: items in one set but not the other
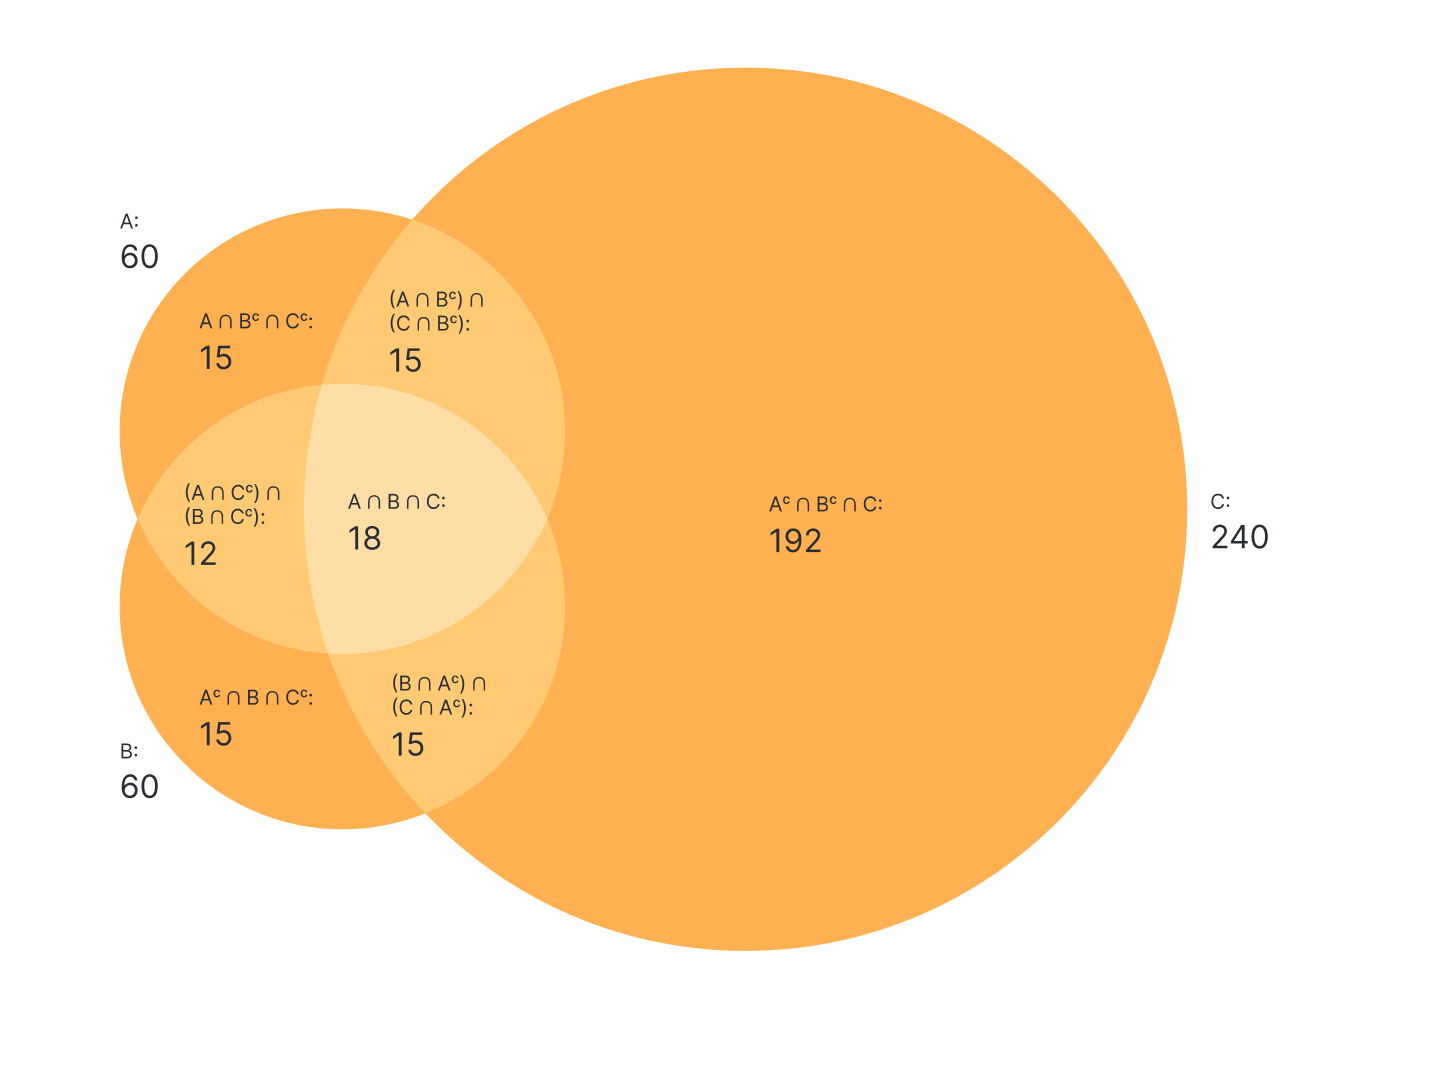
Scaled Venn diagram: also known as an area-proportional Venn diagram, a variation where the shapes are sized by their proportional representation of the whole
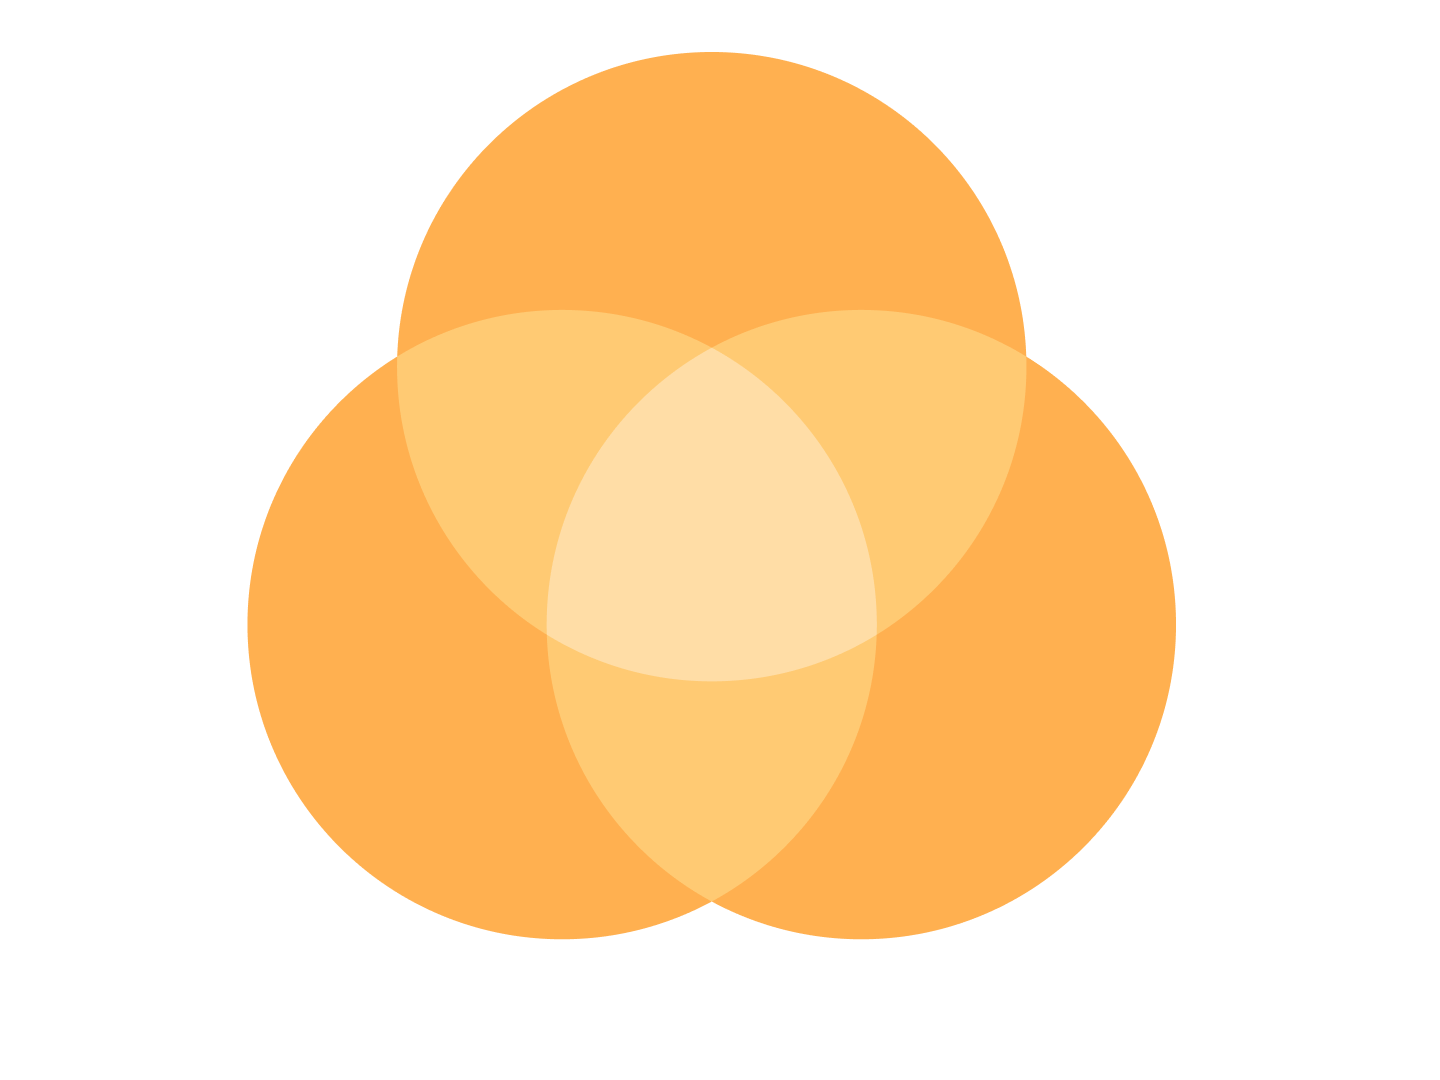
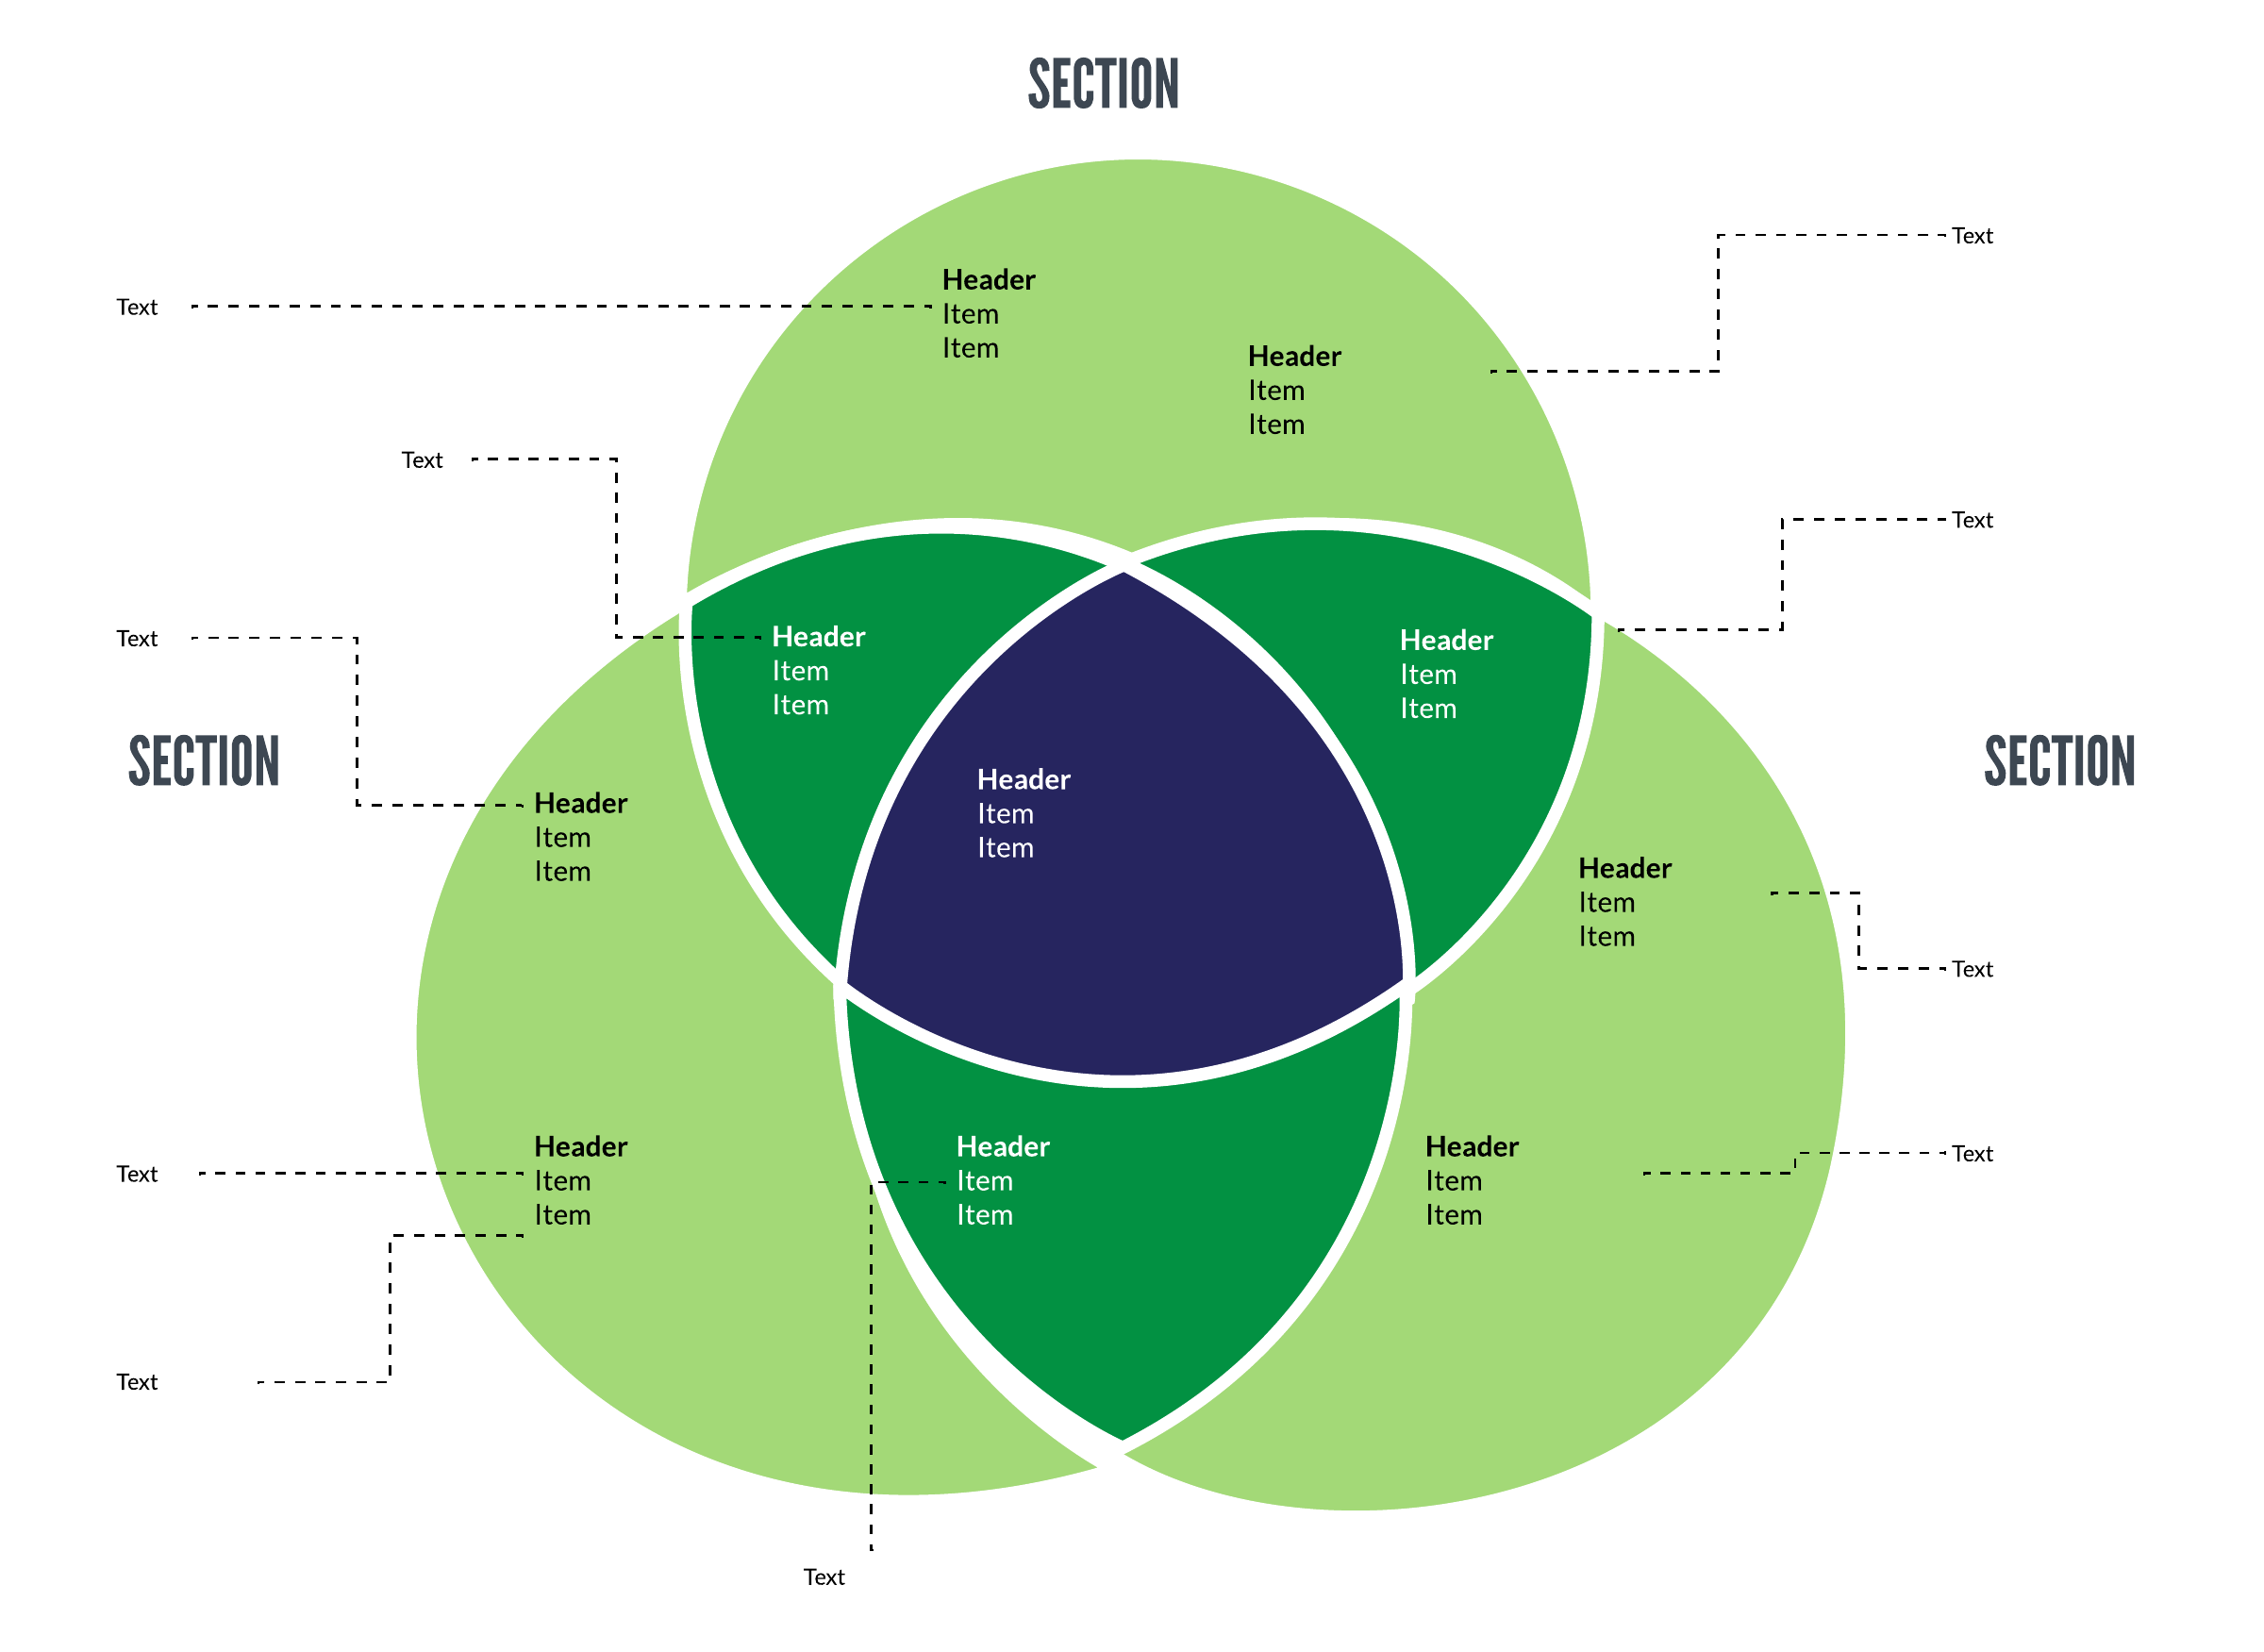
Reuleaux triangle: the shape formed from the intersection of three circles, as in a three-set Venn diagram
Set notation: the mathematical notation used to express sets and subsets (in brackets), unions (with a “U”-like symbol), and intersections (with an upside-down “U” symbol)
Set theory: the longstanding branch of mathematics dealing with sets
How do you make a Venn diagram?
You make a Venn diagram by defining your sets, listing the items in each, and then drawing overlapping circles so shared items sit in the intersection. You can do this by hand, in a dedicated diagram maker, opens in a new tab like Lucidchart, or with apps such as Google Docs, PowerPoint, Excel, and Word.
For step-by-step instructions on each tool, see our full guide on how to make a Venn diagram, opens in a new tab.
Example Venn diagram
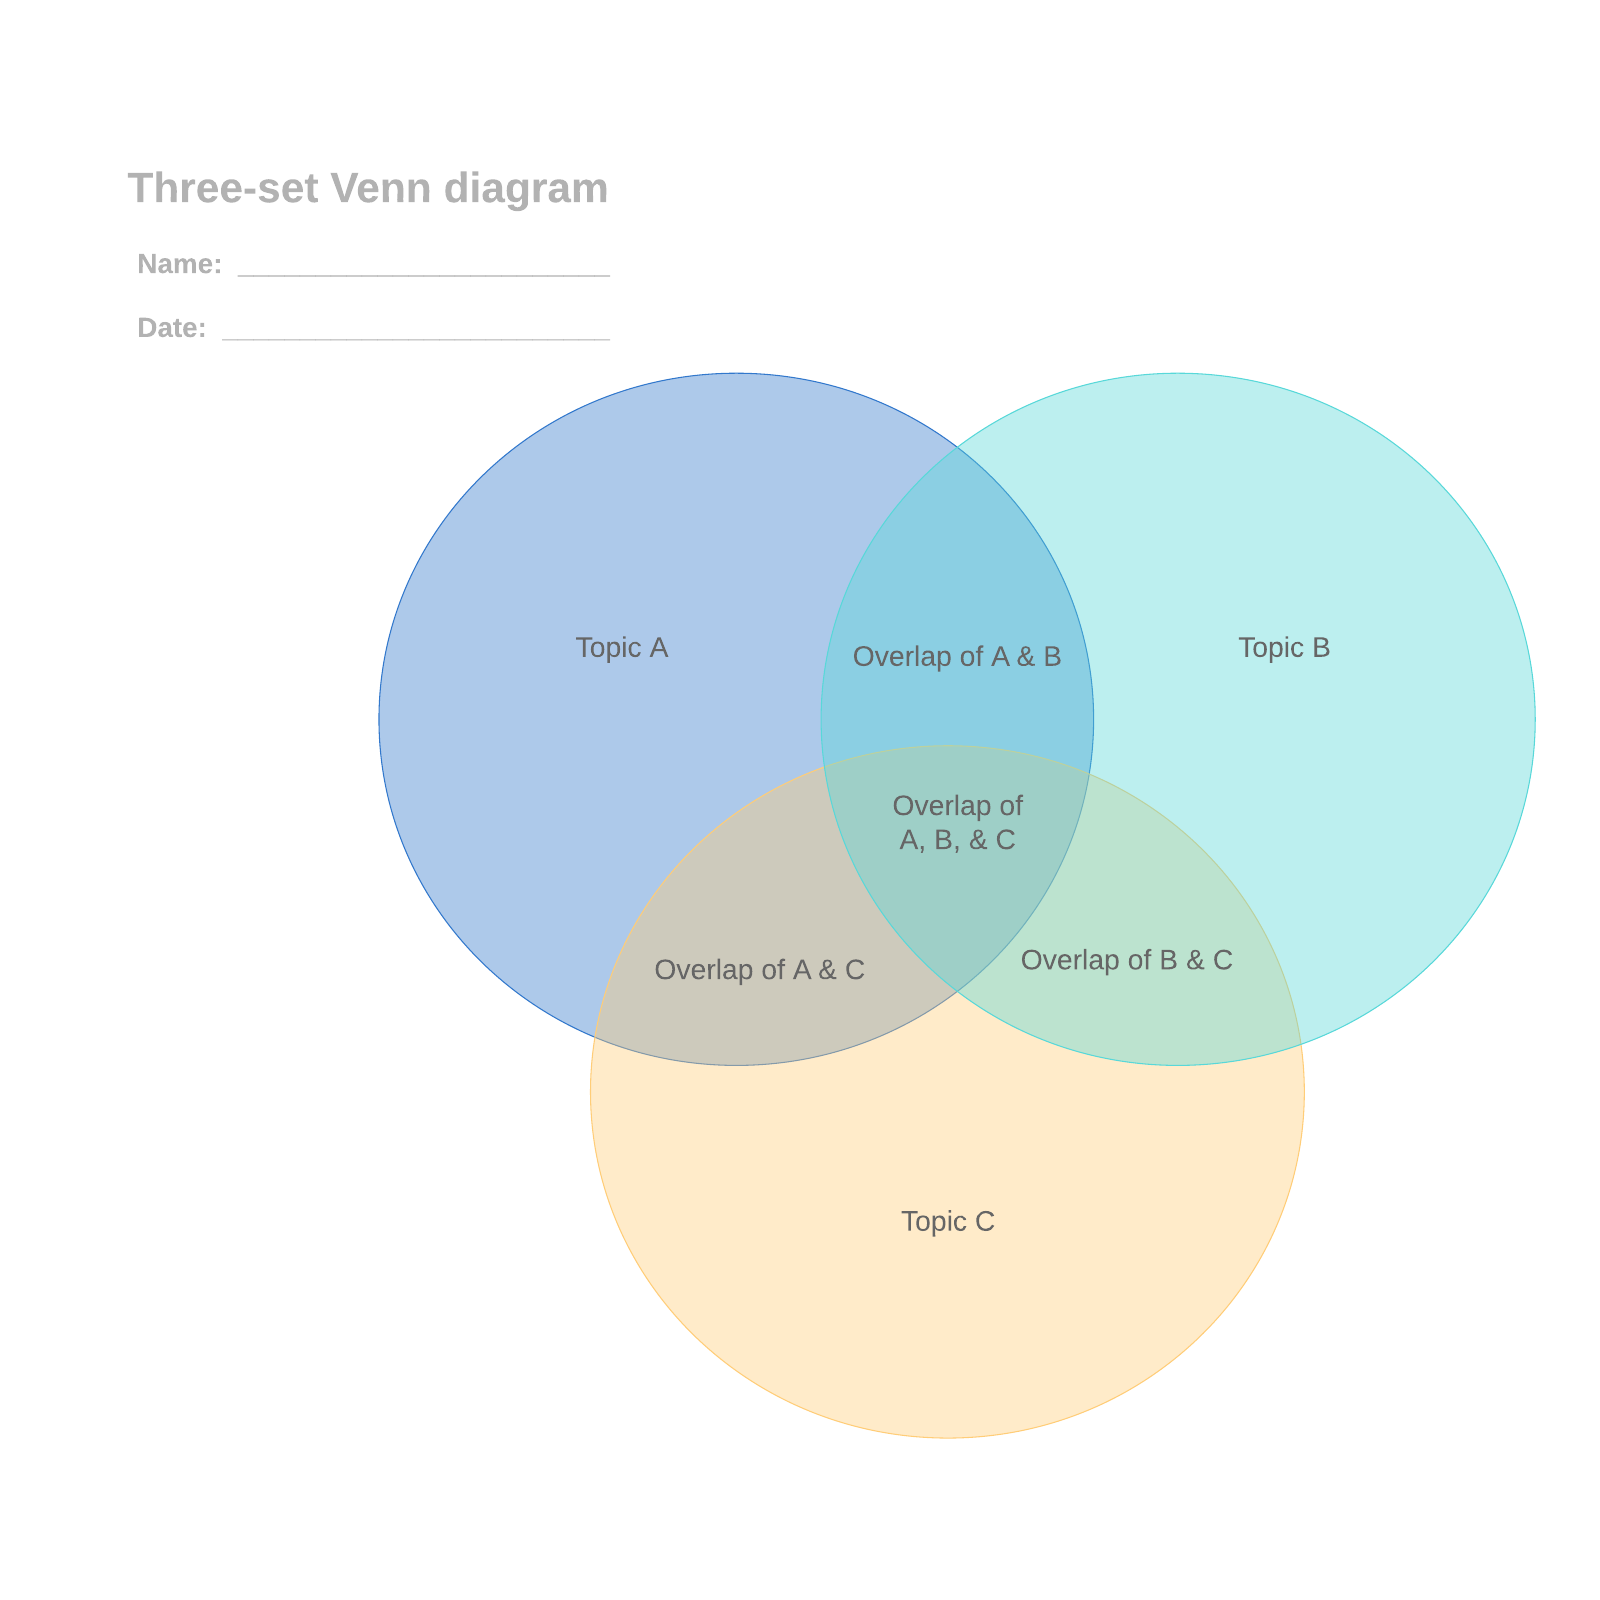
To illustrate the purpose of a Venn diagram, say a family is trying to decide which pet to get. They create a Venn diagram to help them decide.
Set A contains Family Member A’s preferences: dog, bird, hamster.
Set B contains Family Member B's preferences: dog, cat, fish.
Set C contains Family Member C's preferences: dog, cat, turtle, snake.
The overlap, or intersection, of all three sets contains only one item: dog. The family could deduce that this is the best pet for them. Real Venn diagrams can get far more involved, but this pet example shows how quickly an intersection reveals a shared answer.