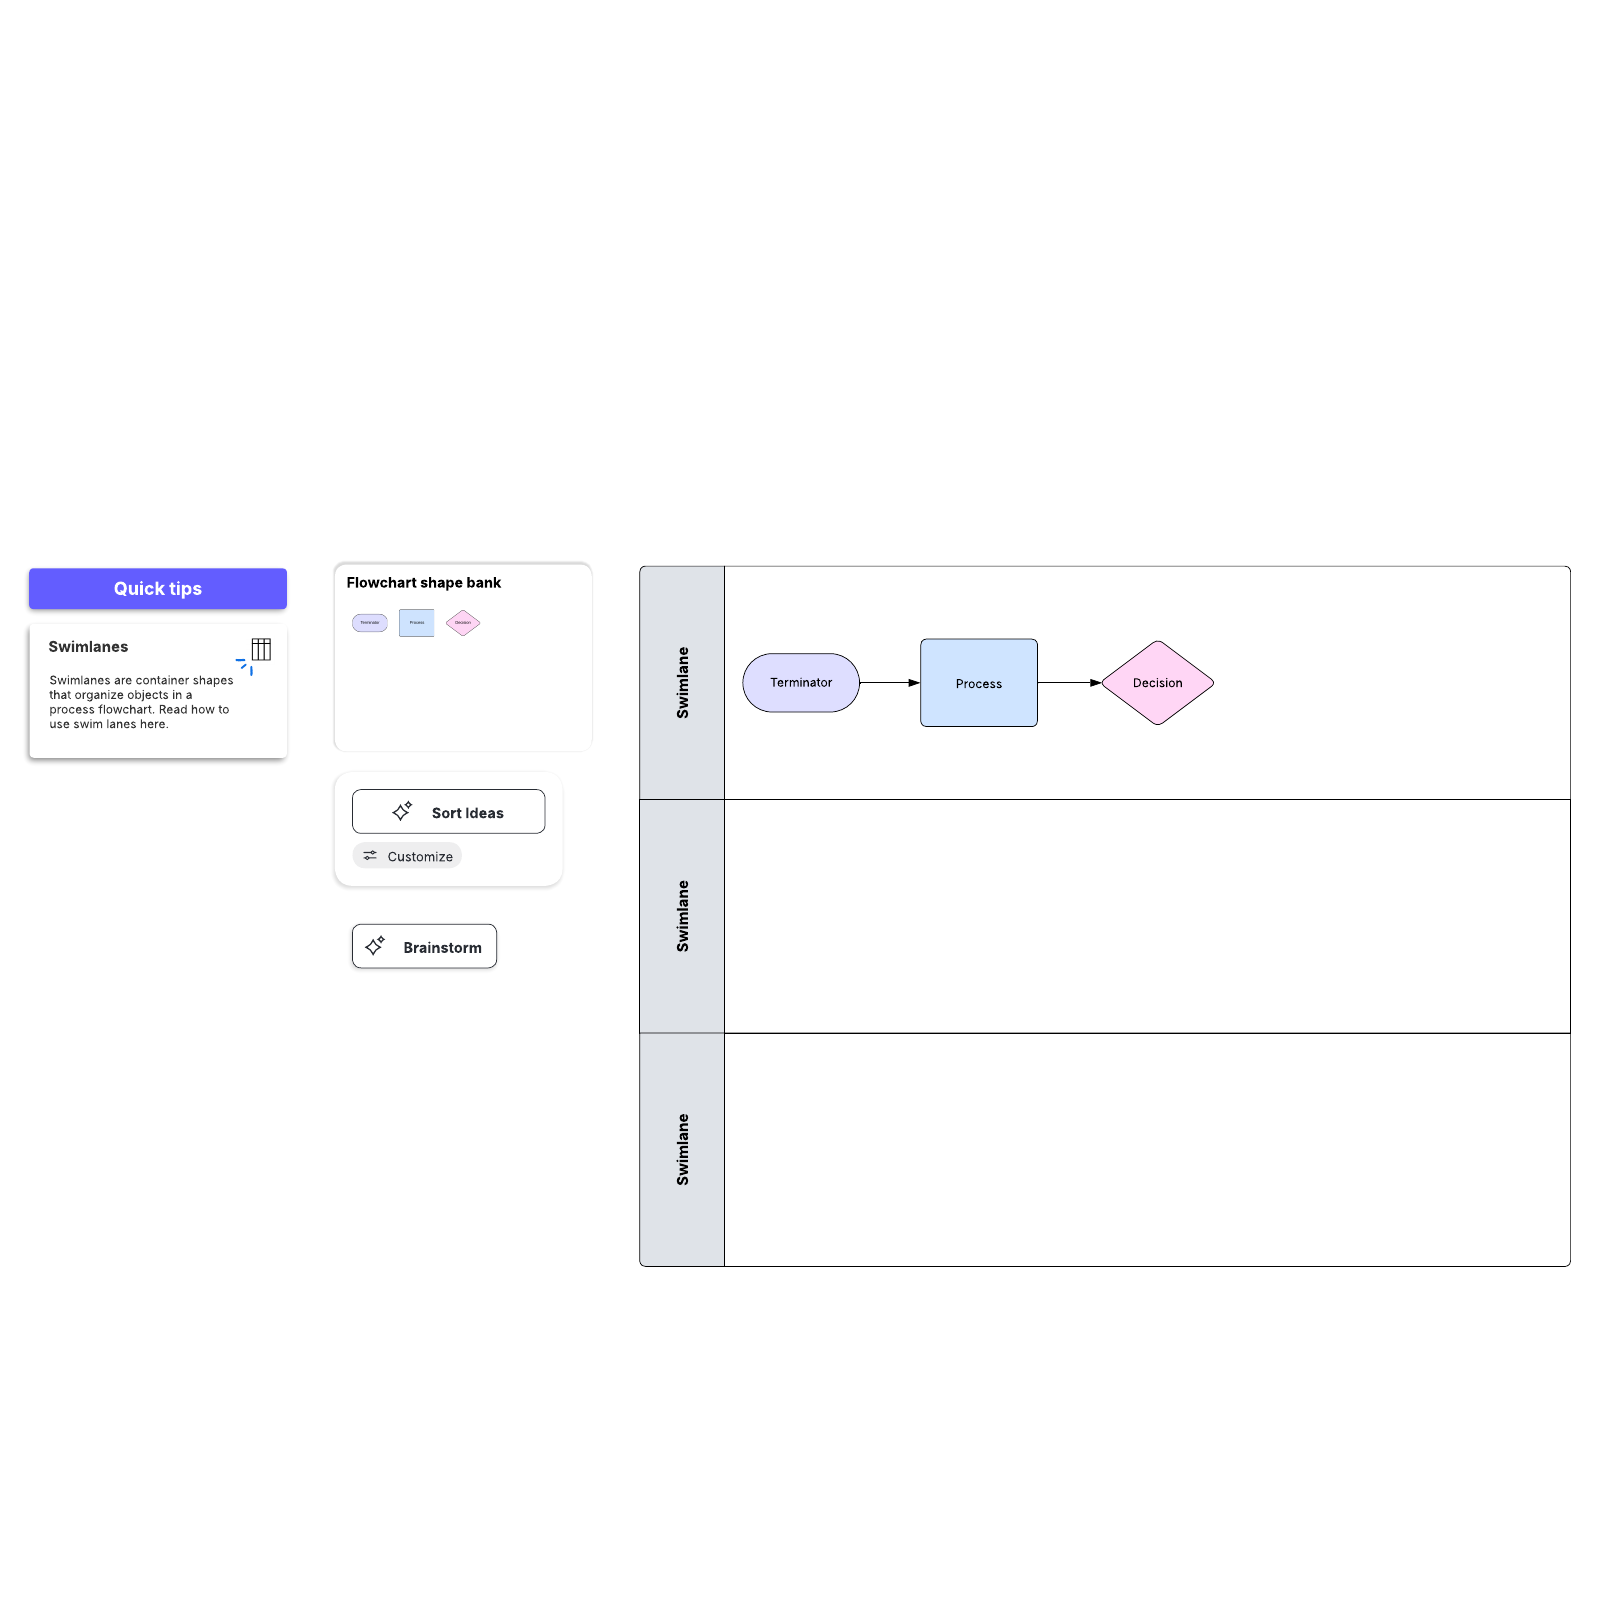
Nothing ruins a PowerPoint presentation like a wall of text—especially when a visual provides more impact. Whether you're mapping a critical decision or describing a complex process, a professional flowchart adds clarity to any deck. While PowerPoint offers basic shape tools, Lucidchart is an intelligent diagramming application, helping you avoid the formatting frustrations that often arise before a deadline.
Use this guide to learn how to create flowcharts in both PowerPoint and Lucidchart.
How to create a flowchart in Microsoft PowerPoint
For many students, educators, and professionals, Microsoft PowerPoint is the go-to presentation software—and with good reason. When it comes to creating flowcharts, however, PowerPoint is extremely limited; it simply wasn't designed for intelligent diagramming. Lucidchart allows you to create beautiful, detailed diagrams easily and quickly.
There are two ways to build flowcharts in PowerPoint: with SmartArt or with the Shapes library. This tutorial will cover both methods, touching on some of the pros and cons of each approach.
Before you start adding boxes and arrows, it helps to prep your slide for clean alignment—especially if you're building a flowchart with individual shapes.
Optional: Set up a grid for easier alignment
Before you start drawing shapes on your slide, take a minute to prepare your virtual workspace by adding a grid. Grids can help you align shapes and ensure consistent dimensions for each object. This is particularly useful when you're manually placing and resizing multiple process and decision boxes.
To set up a grid:
-
Select the View tab and click the Gridlines box.
-
Edit your grid by selecting the arrow icon in the corner beneath the Gridlines box to get to the Grid Settings menu
-
Enable useful features like Snap objects to grid and Display smart guides when shapes are aligned.
Create a flowchart with SmartArt
SmartArt graphics are pre-made collections of shapes—very basic, rigid diagram templates, essentially. Using SmartArt to build charts and diagrams can be faster than starting from scratch, but you'll sacrifice flexibility. SmartArt is a great option if you want a quick, simple diagram. It should, however, only be used for the most rudimentary diagrams. SmartArt graphics are clip art images: Additional elements can be added, but your options are limited to one or two preselected shapes.
If you choose to use SmartArt to build your diagram, follow these steps:
1. Select a flowchart from the SmartArt drop-down menu
In MS PowerPoint, navigate to the slide where you want to add a flowchart. Click Insert > SmartArt to open a drop-down list with a variety of diagram types. Hover your mouse over "Process" to see the various flowchart options. To insert one of these diagrams, simply click it and then click OK. If you decide the layout isn't right after inserting it, you can swap it without rebuilding everything from scratch. To replace your graphic, select it and click Delete. Then re-open the SmartArt dialog (Insert > SmartArt) and choose a different graphic.
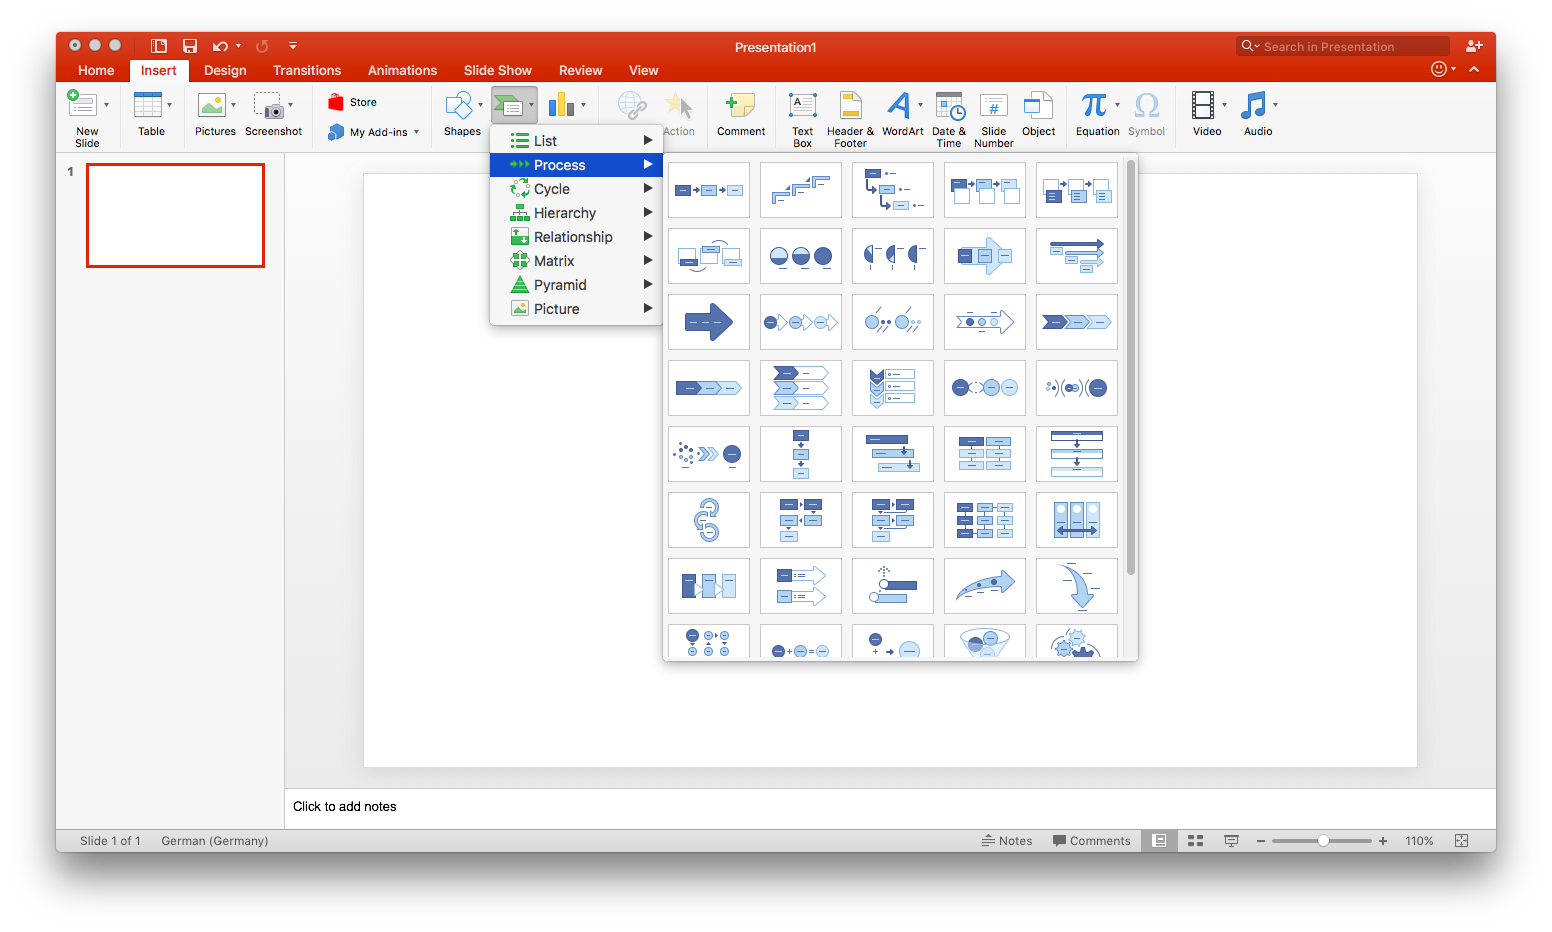
2. Add text and shapes to your flowchart
To add text to a SmartArt graphic, click on the filler text and begin typing. The text boxes will automatically resize to fit your content.
To add shapes and other elements, select the whole SmartArt graphic and click Add Shape, located in the toolbar's upper left corner. While you can drag shapes to move them, some SmartArt layouts limit how many shapes you can add, and complex reformatting can become cumbersome. You can also change the overall SmartArt layout after you've entered content.
To change the layout of a graphic, select it and click Design > Layout to pick another style. The chart layout can be edited without losing any text.
3. Customize your flowchart
When you select your SmartArt graphic, two tabs appear on the toolbar: SmartArt Design and Format. Use the SmartArt Design tab to change the diagram type, choose from preset color schemes, or add shapes. The Format tab, on the other hand, allows for more specific customizations, including individual shape color, text color, and font. Note that these tabs will only appear when SmartArt graphics are selected.
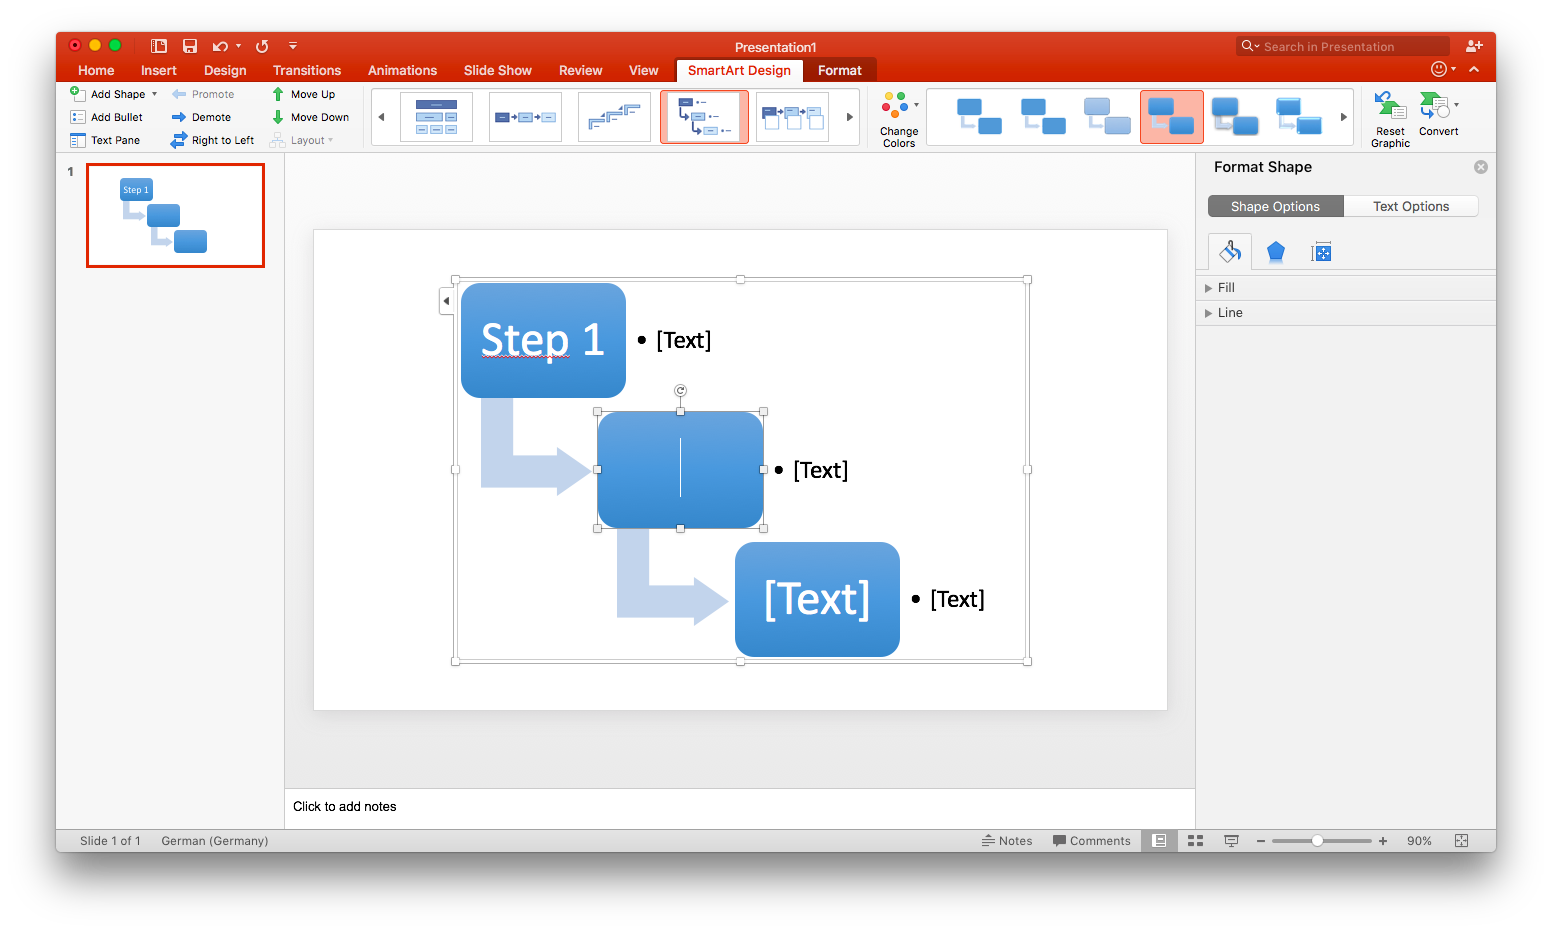
If you're looking for a traditional flowchart—one with process and decision boxes, and other flowchart-specific shapes—you'll have to use the shape library, as SmartArt doesn't offer any diagrams with these features.
Create a flowchart with the PowerPoint shape library
Using the shape library to create a flowchart will take substantially longer than using SmartArt because every box and arrow must be added individually. However, this method affords much more flexibility throughout the creation process.
1. Add and position shapes
Go to Insert > Shapes and scroll to the flowchart section. Hover over any shape to see its specific function, such as a decision or process box. Select a shape, then click and drag on the slide to draw it.
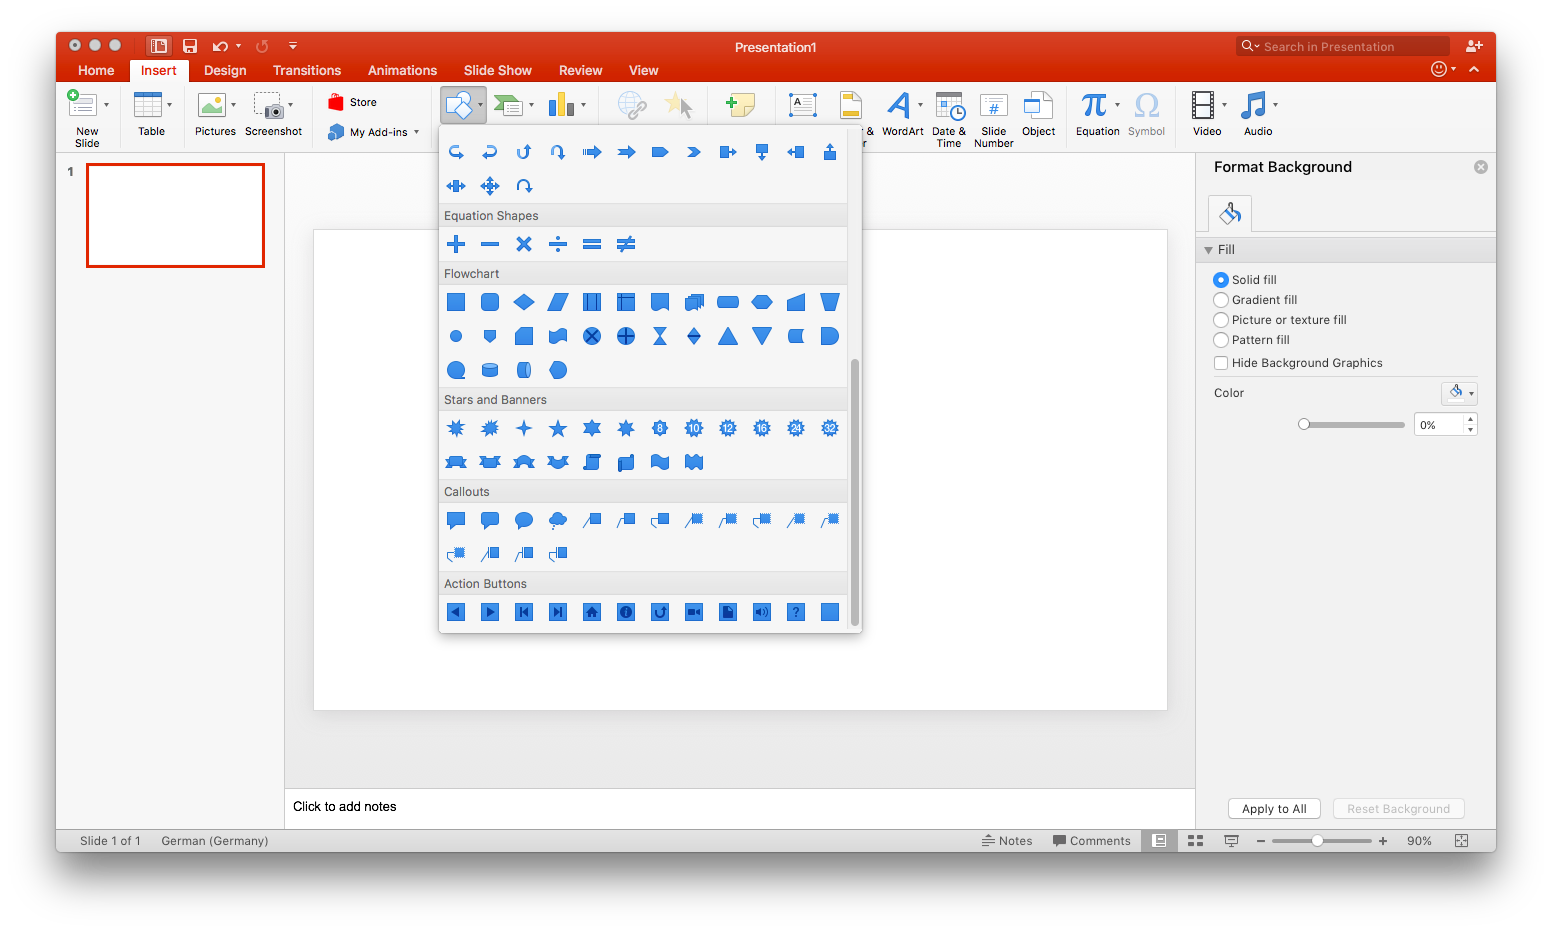
Pro tip: To save time, create one shape and then copy and paste it to the main consistent sizing. You can resize any object by dragging its corners or rotate it using the handle icon.
2. Connect shapes
To illustrate the flow of your diagram, go to Insert > Shapes and select a connector from the Lines section. Click and drag from one shape to another to link them. While these lines stay attached to the shapes, you may need to manually adjust them if you significantly rearrange your layout.
3. Label shapes and lines
To add text to an existing shape, select it and begin typing. For lines, you must manually add a text box by going to Insert > Text Box. If a specific shape doesn't support direct text entry, use a text box and place it over the object.
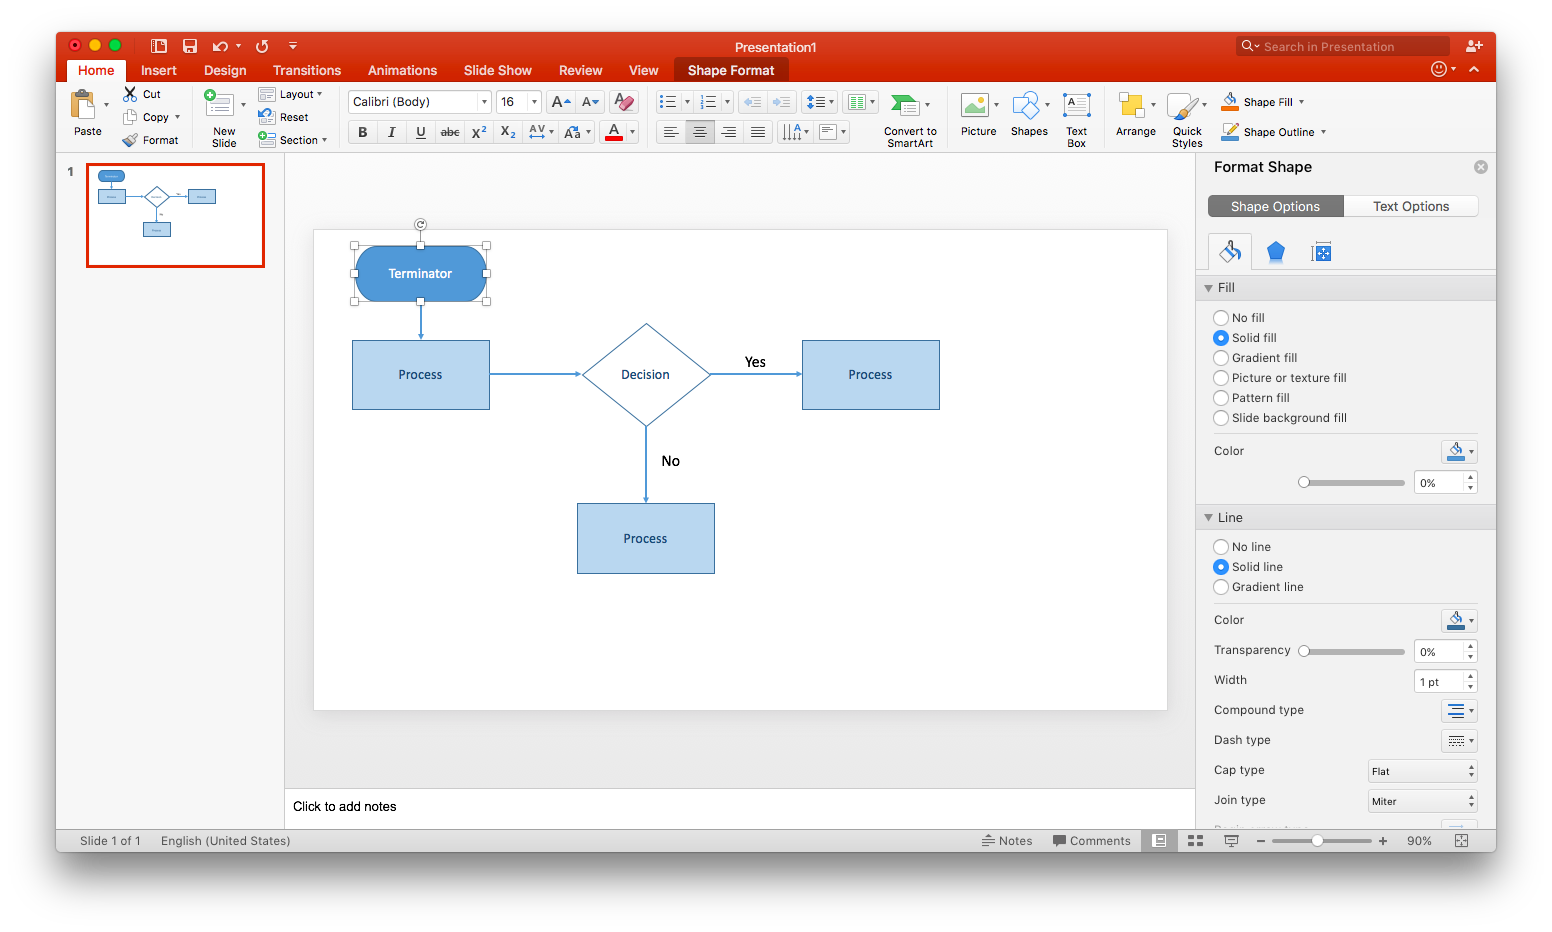
4. Customize your flowchart
At this point, every shape and line you've drawn is styled according to Microsoft PowerPoint's presets. If you like the look of your flowchart as is, skip this step.
Double-click any shape or line to open the Format Shape pane. You can then edit fill color, line weight, opacity, and many other elements of your diagram.
Alternatively, click and drag your mouse around each shape you want to select. Once the objects are selected, you can move them with the arrow keys or your mouse. You can also add formatting, such as a different color fill, and it will apply to the entire selection of shapes. Deselect by clicking on another part of the page.
How to create a flowchart using Lucidchart
While it's possible to create a flowchart in PowerPoint, using Lucidchart is a more efficient and intuitive solution. And thanks to the Lucidchart PowerPoint integration, you can bring your Lucidchart diagrams directly into your presentations!
Before getting started on your flowchart, you'll need a free Lucidchart account. Once registered, you're ready to move on to the steps below.
1. Choose a template or start from scratch
Lucidchart has dozens of pre-made flowcharts in its template library. From a blank Lucidchart document, click on the Templates icon on the left-hand toolbar. Type in "flowchart" and find the flowchart template you’d like to use. Click Use, and the template will appear in your document. From there, you can customize it to your process or workflow.
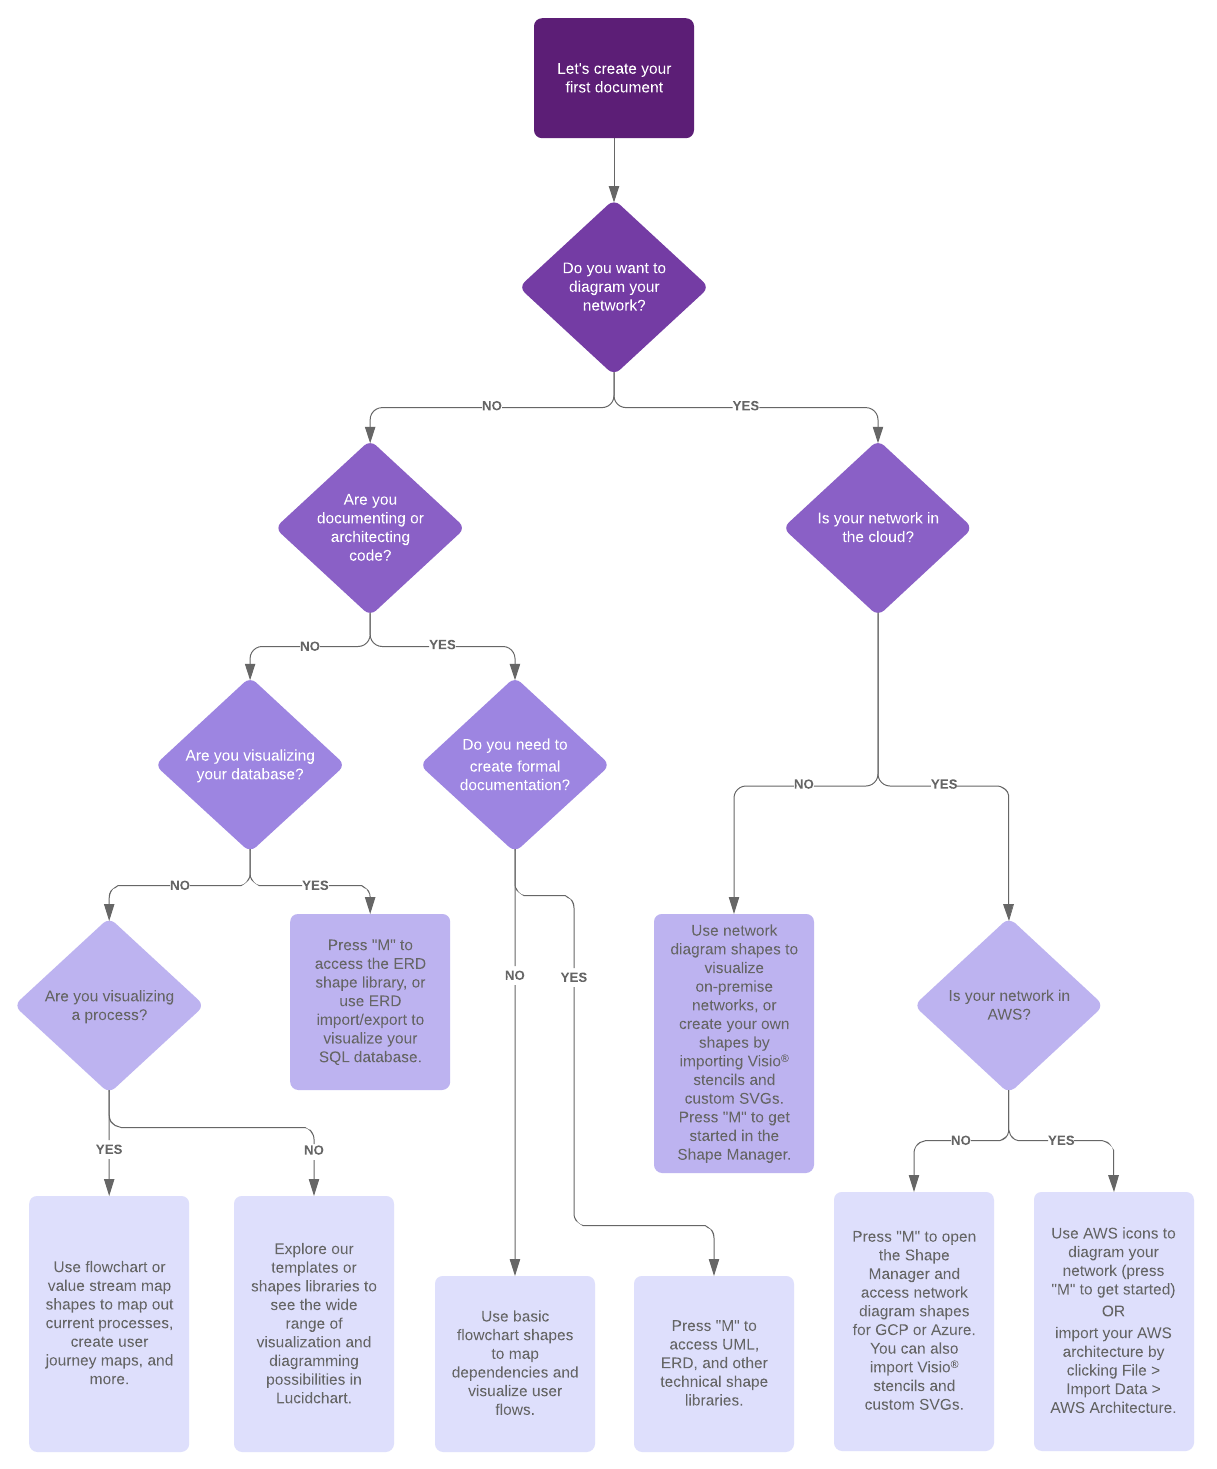
If you prefer to start from scratch, open a blank document by selecting + New > Lucidchart > Blank Document. With Lucidchart’s intuitive interface, adding shapes, lines, and text is simple. By default, the flowchart shape library is pinned to the Shape menu—simply drag and drop shapes onto your canvas to get started. To connect shapes, click and drag from the red nodes on an object; lines will intuitively snap to each other for a polished look.
If you need specialized symbols, you can enable additional libraries before you start building. Open the Shape library by clicking + Shapes in the left toolbar or by pressing “M” on your keyboard. Select the libraries you want to use and click Use selected shapes.
Lucidchart streamlines the process of adding steps and connectors. When you're ready to build your flowchart, follow these steps:
-
Drag a shape from the shape menu and drop it onto the canvas.
-
Hover over the border of an object. When a node appears, click and drag to draw a line.
-
Release the mouse to see the auto-prompt menu, and then select the next shape in your process.
You can also draw lines by right-clicking and choosing Draw line, or pressing “L” on your keyboard.
2. Add text
At this point, your diagram should look almost complete. But it's missing one crucial element: text. What decision is being made at each decision box? Which line represents yes? No?
Adding text to arrows and other shapes in Lucidchart is simple. All you need to do is double-click and start typing. To edit existing text, do the same.
Font, text size, color, and much more can be easily adjusted using the toolbar at the top of the editor. You can also create a text box by dragging the T icon from the toolbox and placing it on the canvas. Add text to any part of a line by double-clicking and typing on the line.
3. Format and style your flowchart
Apply a cohesive look to your entire diagram by selecting the Themes icon (the droplet symbol) on the right side of the editor. Choose from a variety of professional themes to instantly update your diagram’s color palette and styling.
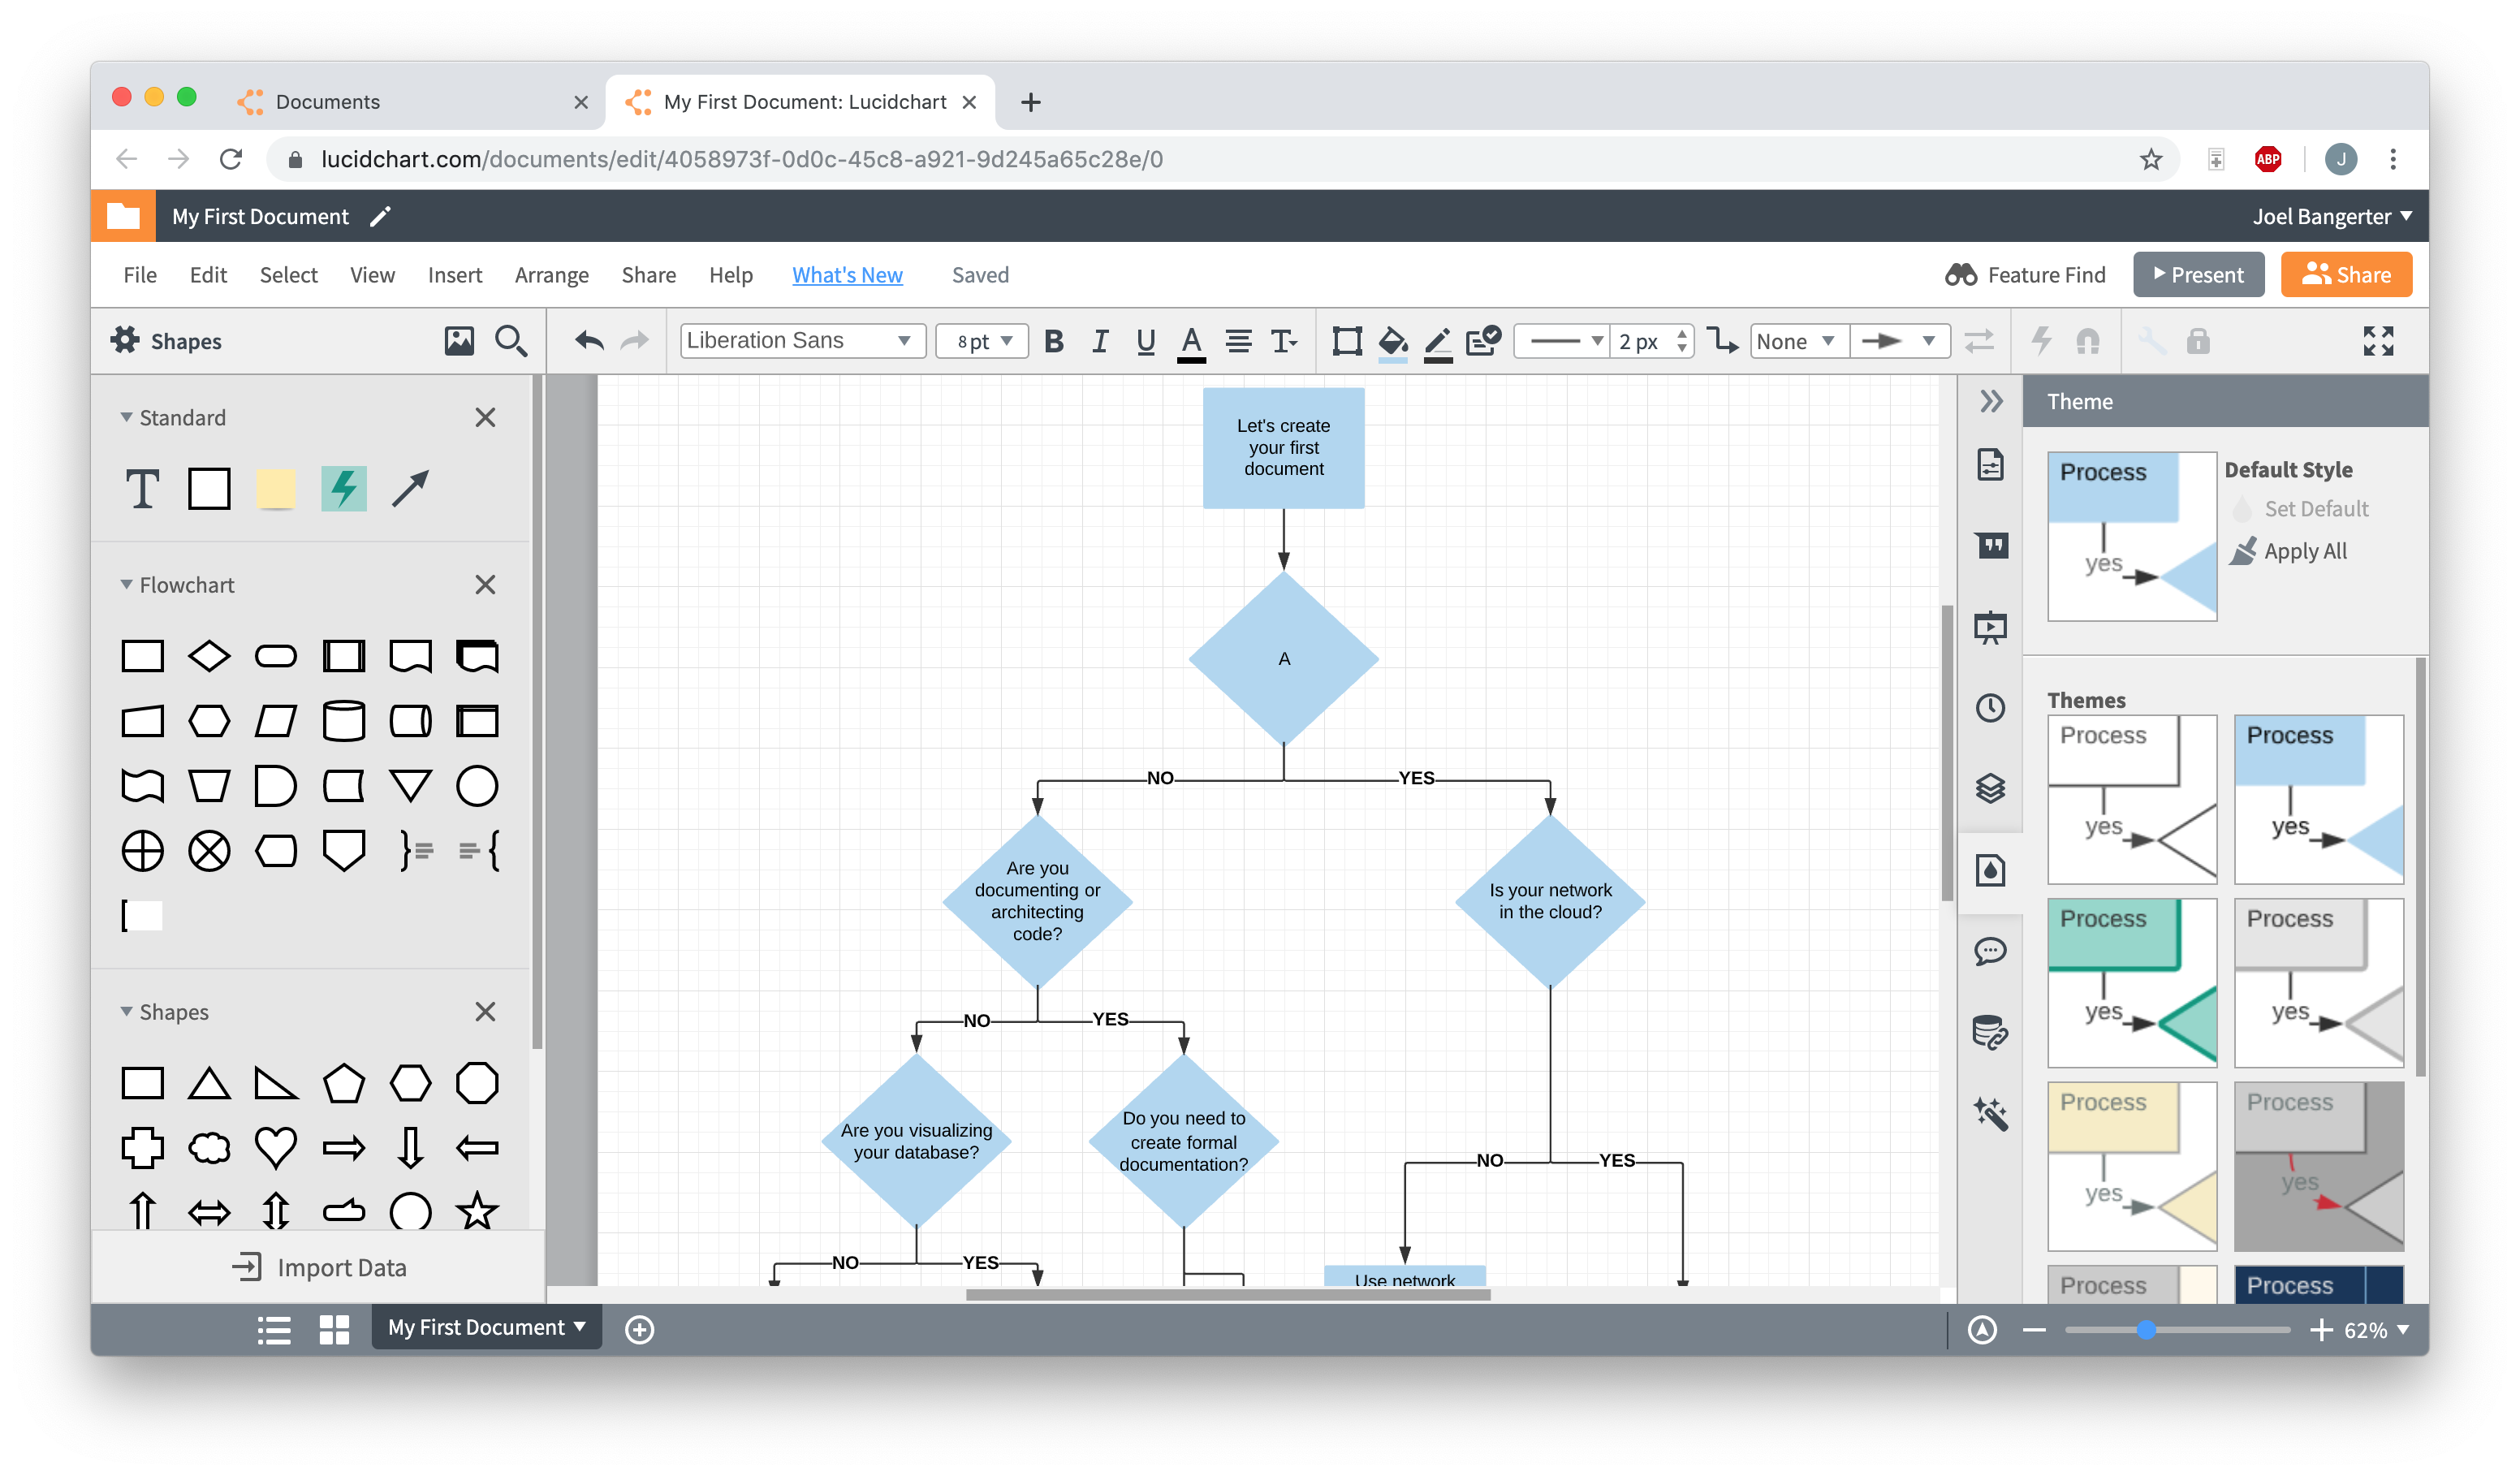
For individual adjustments, use the properties bar at the top of the editor. This central hub allows you to customize every element, from line weight and fill color to gradients and opacity.
Pro tip: To edit multiple objects at once, hold the Shift key while selecting shapes. You can then apply formatting—like a uniform font or color—to the entire group simultaneously.
Advanced customization features
Beyond basic styling, Lucidchart offers capabilities designed specifically for intelligent diagramming:
-
Change shapes instantly: Right-click any object to swap it for a different shape while maintaining your text and connections.
-
Link to other sources: Use data linking to link to other pages or external resources.
-
Add layers: Easily organize complex diagrams by moving objects to the front or back to ensure the most important information stays visible.
Insert a Lucidchart diagram into PowerPoint
Follow the steps below to add your flowchart to Microsoft PowerPoint with the Lucidchart add-in.
1. Install the Lucidchart add-in
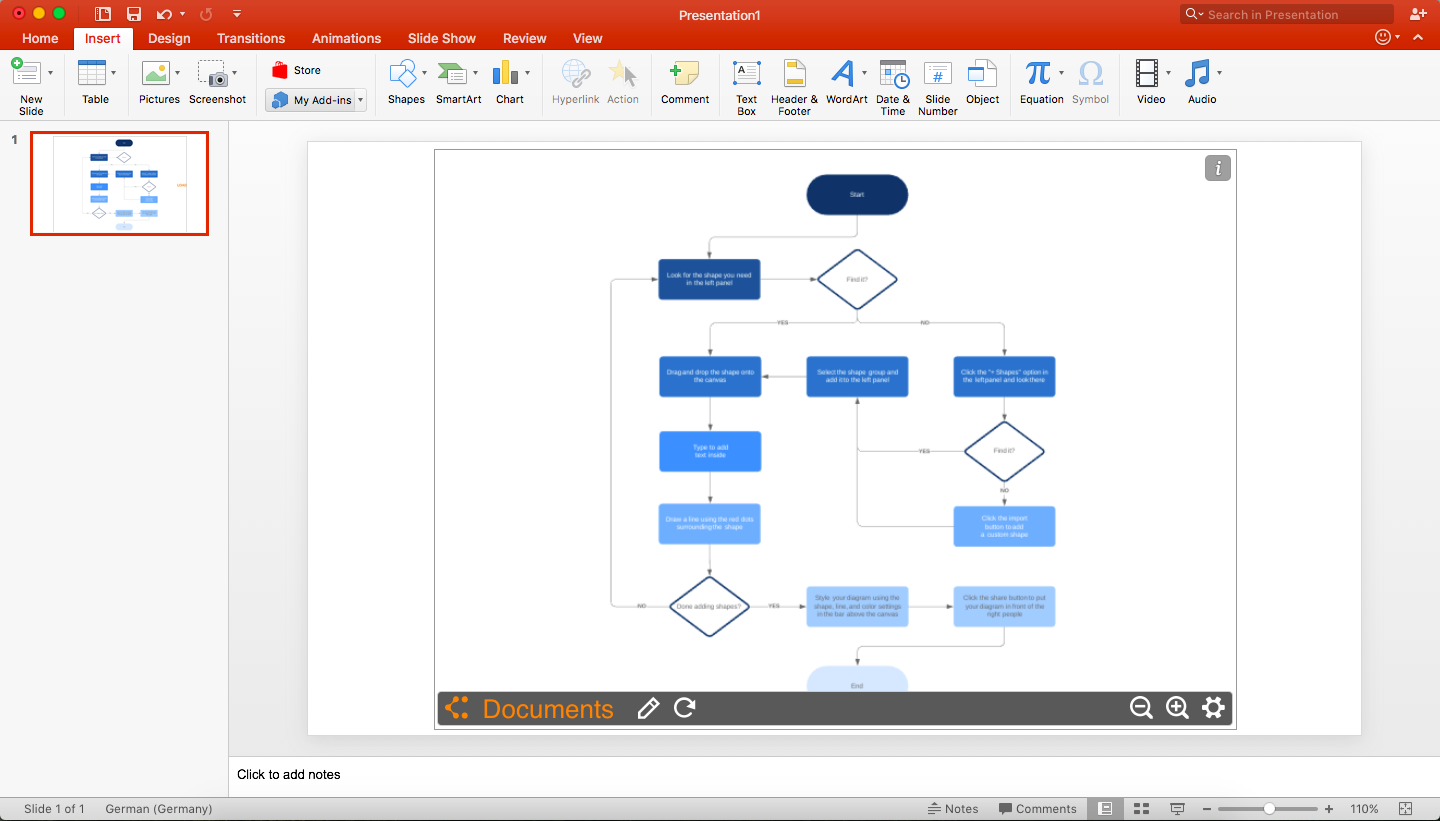
Installing the add-in takes only a few clicks! Open PowerPoint and go to Insert > My Add-ins > Store. Type "Lucidchart" in the search bar and click Add.
If the Lucidchart add-in doesn't open when you download it, don't worry. Simply go to Insert > My Add-ins > Lucidchart. You may be prompted to enter your Lucidchart login info—once logged in, you can view all of your Lucidchart documents.
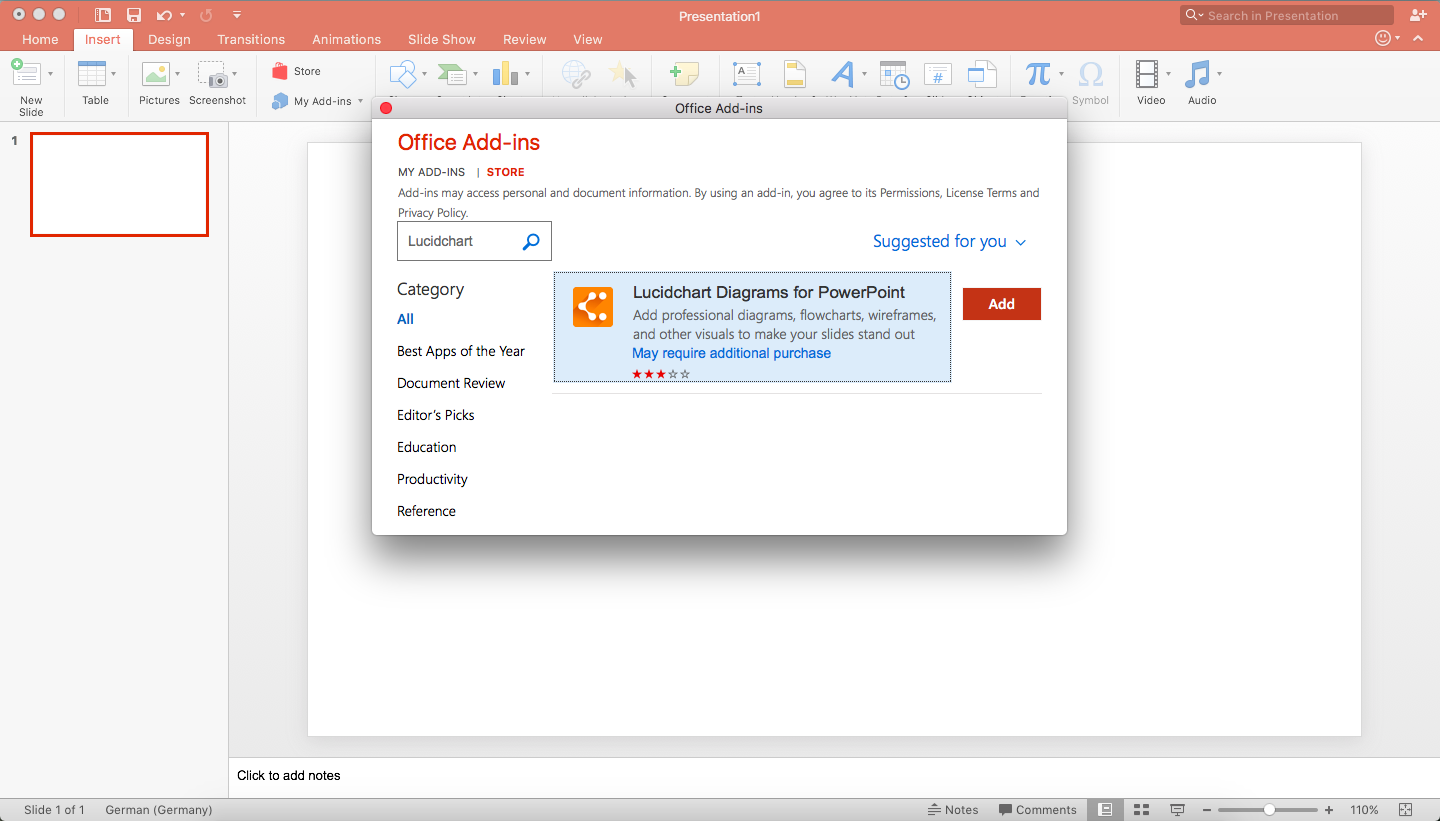
2. Select a diagram to add to your PowerPoint slide
With the Lucidchart add-in open, you can view your entire document library directly within PowerPoint. To insert a diagram, hover over the diagram you wish to add and click Select. The diagram will appear on your current slide.
If you edit the diagram in Lucidchart after inserting it, simply click the Refresh icon on the toolbar below the image to apply changes instantly.
For more dynamic presentations, use the add-in to insert interactive diagrams that you can scroll through and explore during your presentation.
Alternative: Export as an image
If you do not require a live embed, you can export your diagram as a static image.
-
In Lucidchart, select File > Export.
-
Choose your preferred file type (such as a PNG or JPEG) and click Download.
-
Insert the file into PowerPoint as you would any other image.
If you're struggling to make a flowchart in any Microsoft Office programs, Lucidchart can help. Just like with PowerPoint, you can import diagrams into Microsoft Word and Excel with the Lucidchart add-in—it's quick, easy, and free!
Lucidchart is also part of a broader visual collaboration platform used by many teams for diagramming beyond flowcharts. Lucidchart, a cloud-based intelligent diagramming application, is a core component of Lucid Software's Visual Collaboration Suite. This intuitive, cloud-based solution empowers teams to collaborate in real-time to build flowcharts, mockups, UML diagrams, customer journey maps, and more. Try it out today.

Everything you need to make a diagram
Make a polished, professional diagram for free with Lucidchart. No matter what you have in mind, we have the tools you need to build it. Make an account and start diagramming today.
Sign up free