Contents
State machine tutorial
8 min
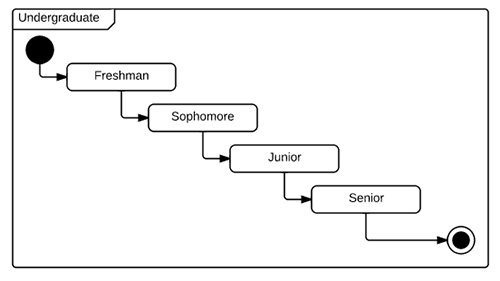
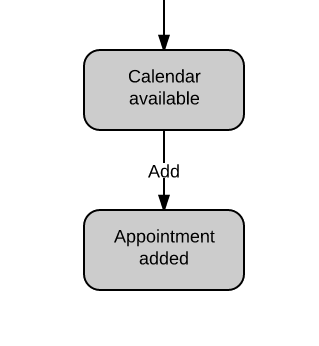
A state diagram, sometimes known as a state machine diagram, is a type of behavioral diagram in the Unified Modeling Language (UML) that shows transitions between various objects. Using our collaborative UML diagram software, build your own state machine diagram with a free Lucidchart account today!
State machine templates and examples
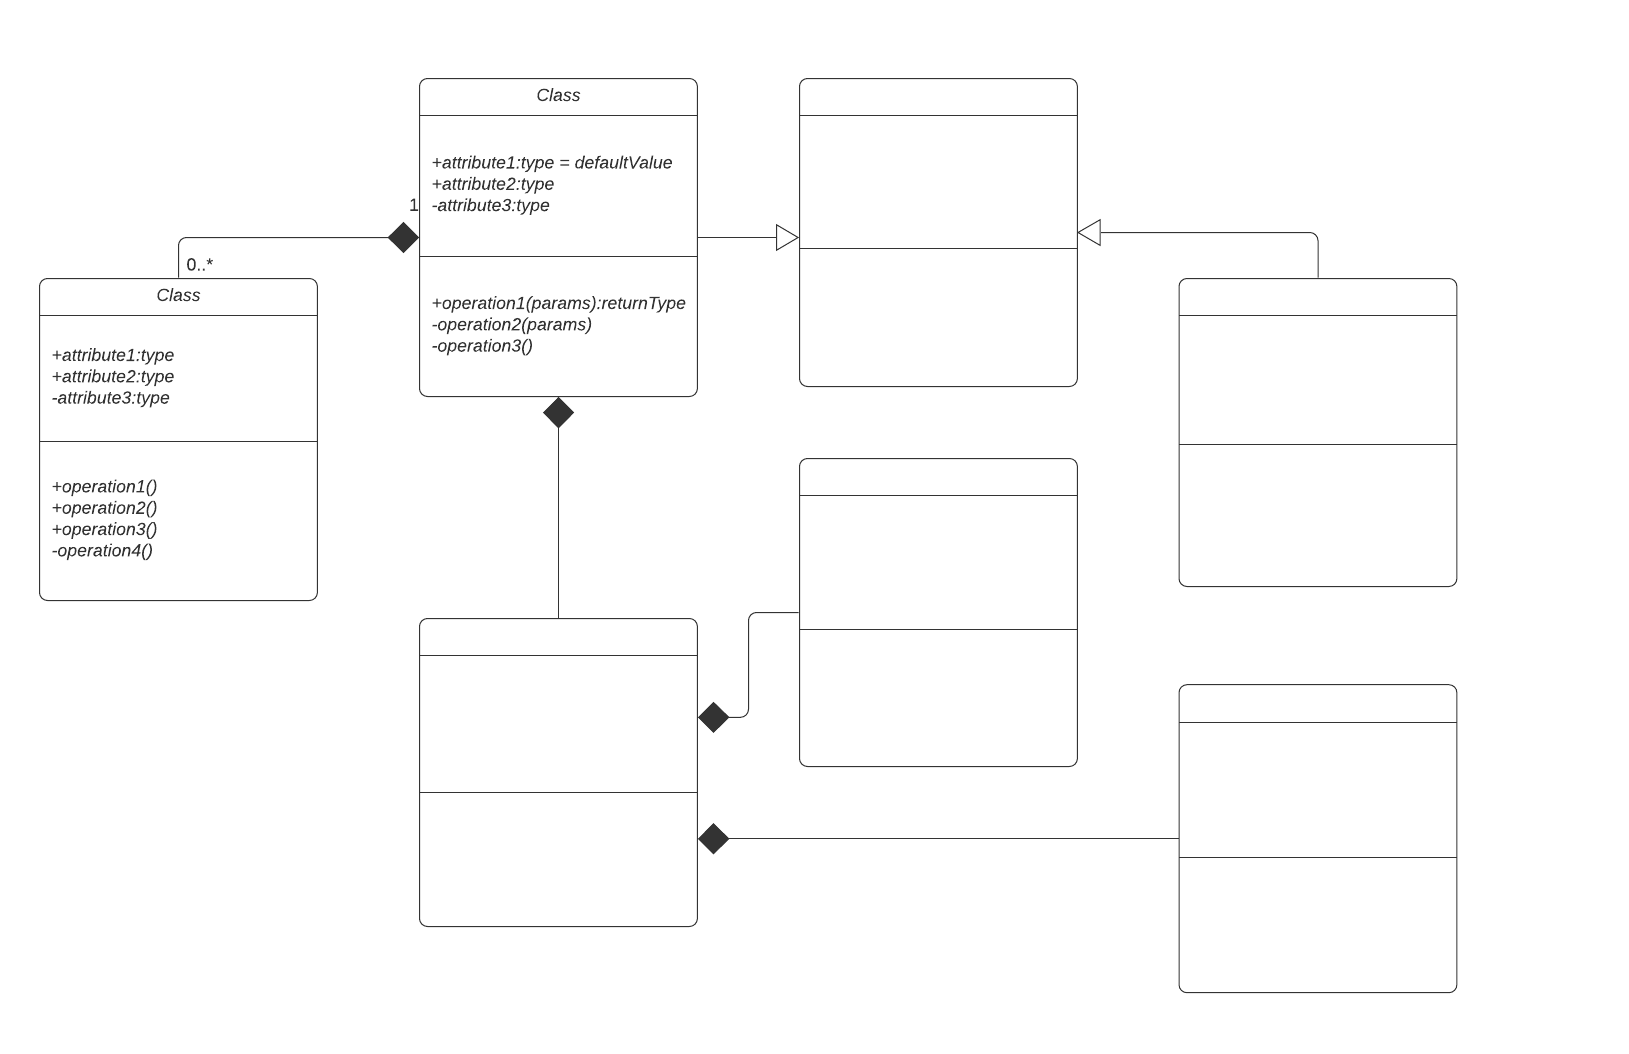
Class diagram with UML notation
Pricing:
Paid Account
Class diagram with UML notation, Pricing: Paid Account
Additional UML resources
UML diagram maker
No matter the type of UML diagram you need to create, Lucidchart can help you get to work on it right away, with detailed shape libraries, hundreds of templates, AI diagram generation, and more.
UML diagram tutorial
Read our comprehensive guide to learn the definition of UML, the 14 types of UML diagrams, and the steps for creating a UML diagram.
Class diagram tutorial
Class diagrams are one of the most useful types of UML diagrams as they clearly map out the structure of a particular system by modeling its classes, attributes, operations, and relationships between objects.
Frequently asked questions
What is a UML state machine diagram?
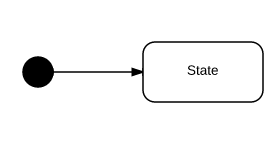
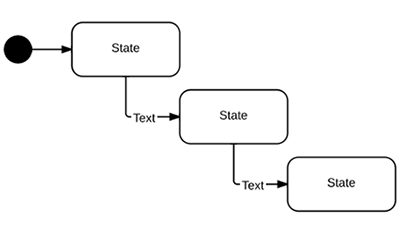
What are the main symbols used in state machine diagrams?
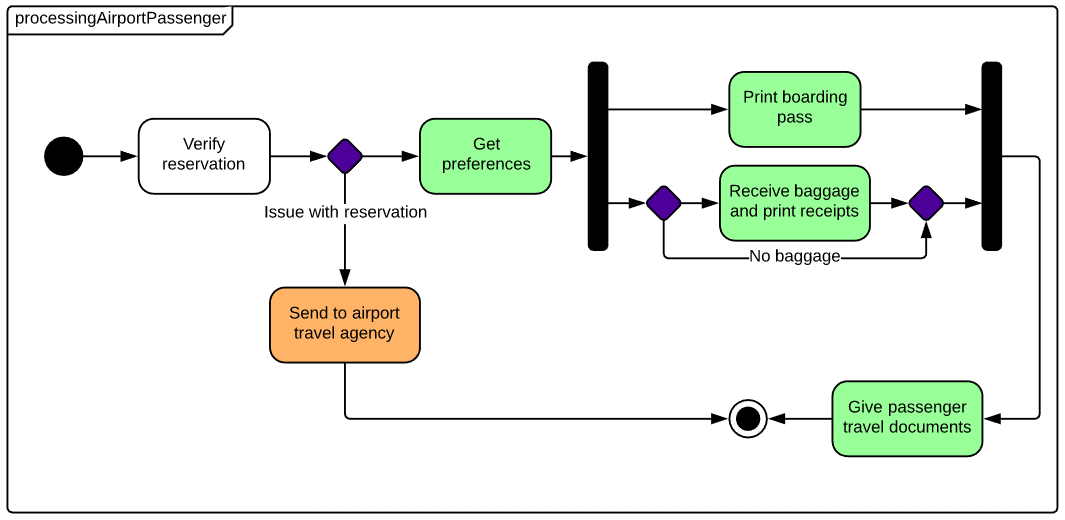
How do I create a state machine diagram in Lucidchart?
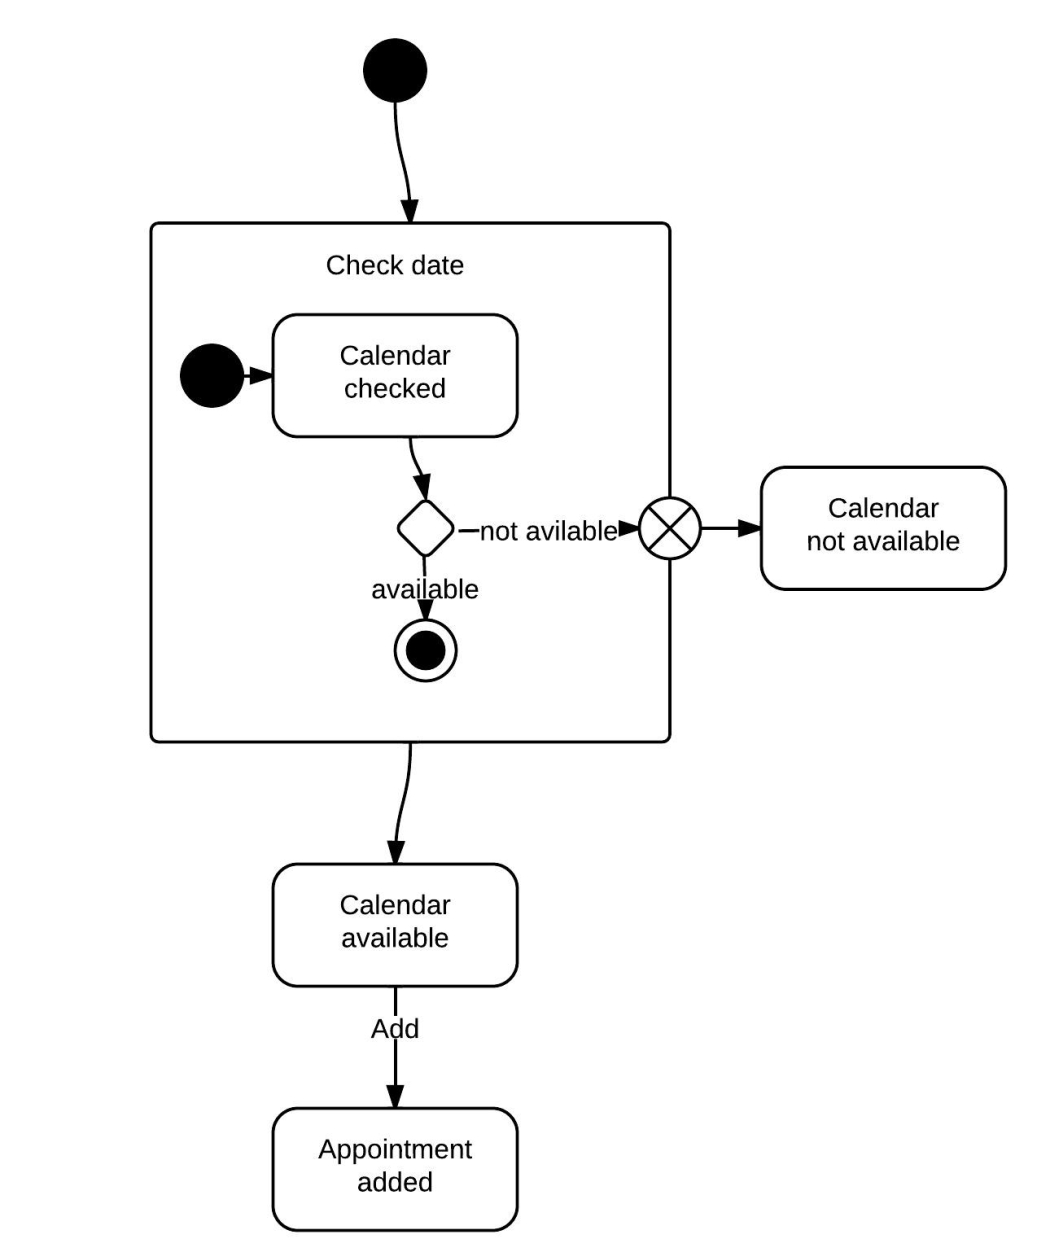
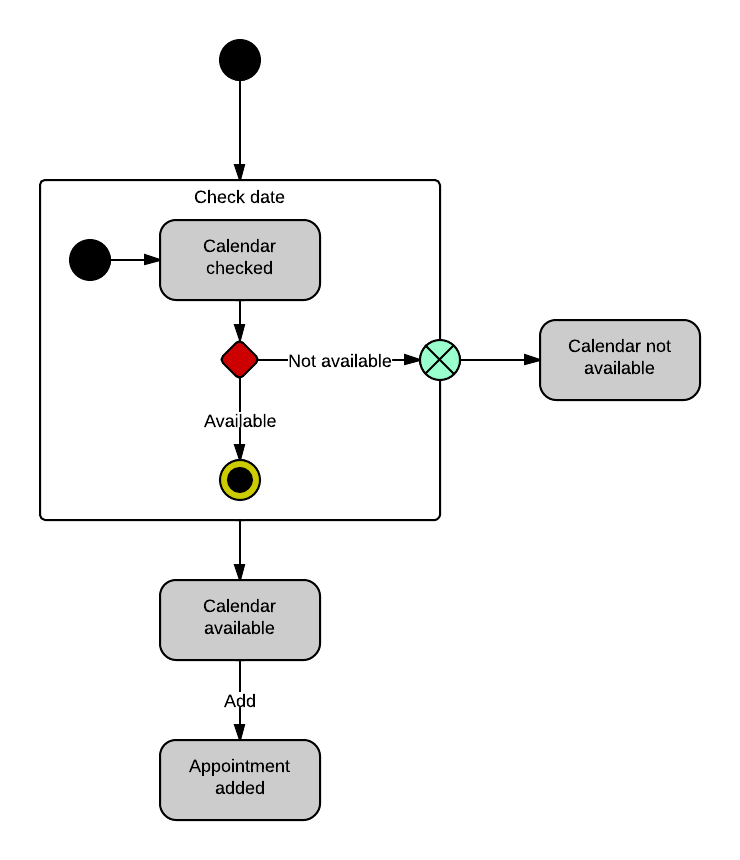
What is a composite state in a state diagram?
What is the difference between an event and a trigger in state diagrams?
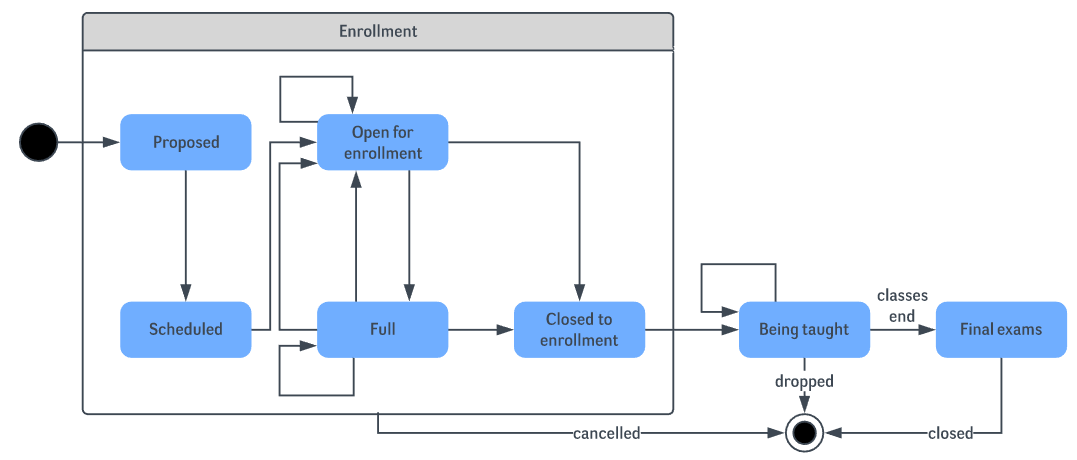
When should I use a state machine diagram?
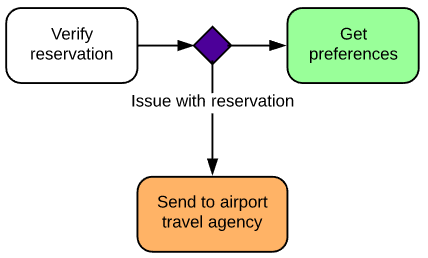
What is a choice pseudostate?
Can I collaborate with others on my state machine diagram in Lucidchart?
Everything you need to make a UML diagram
In addition to our online UML diagram tool, Lucidchart offers support and training resources to help you branch out to any type of diagram.
Make a diagram