Key takeaways
Class diagrams belong to the structural (static) family of UML. They describe how a system is organized rather than how it behaves over time.
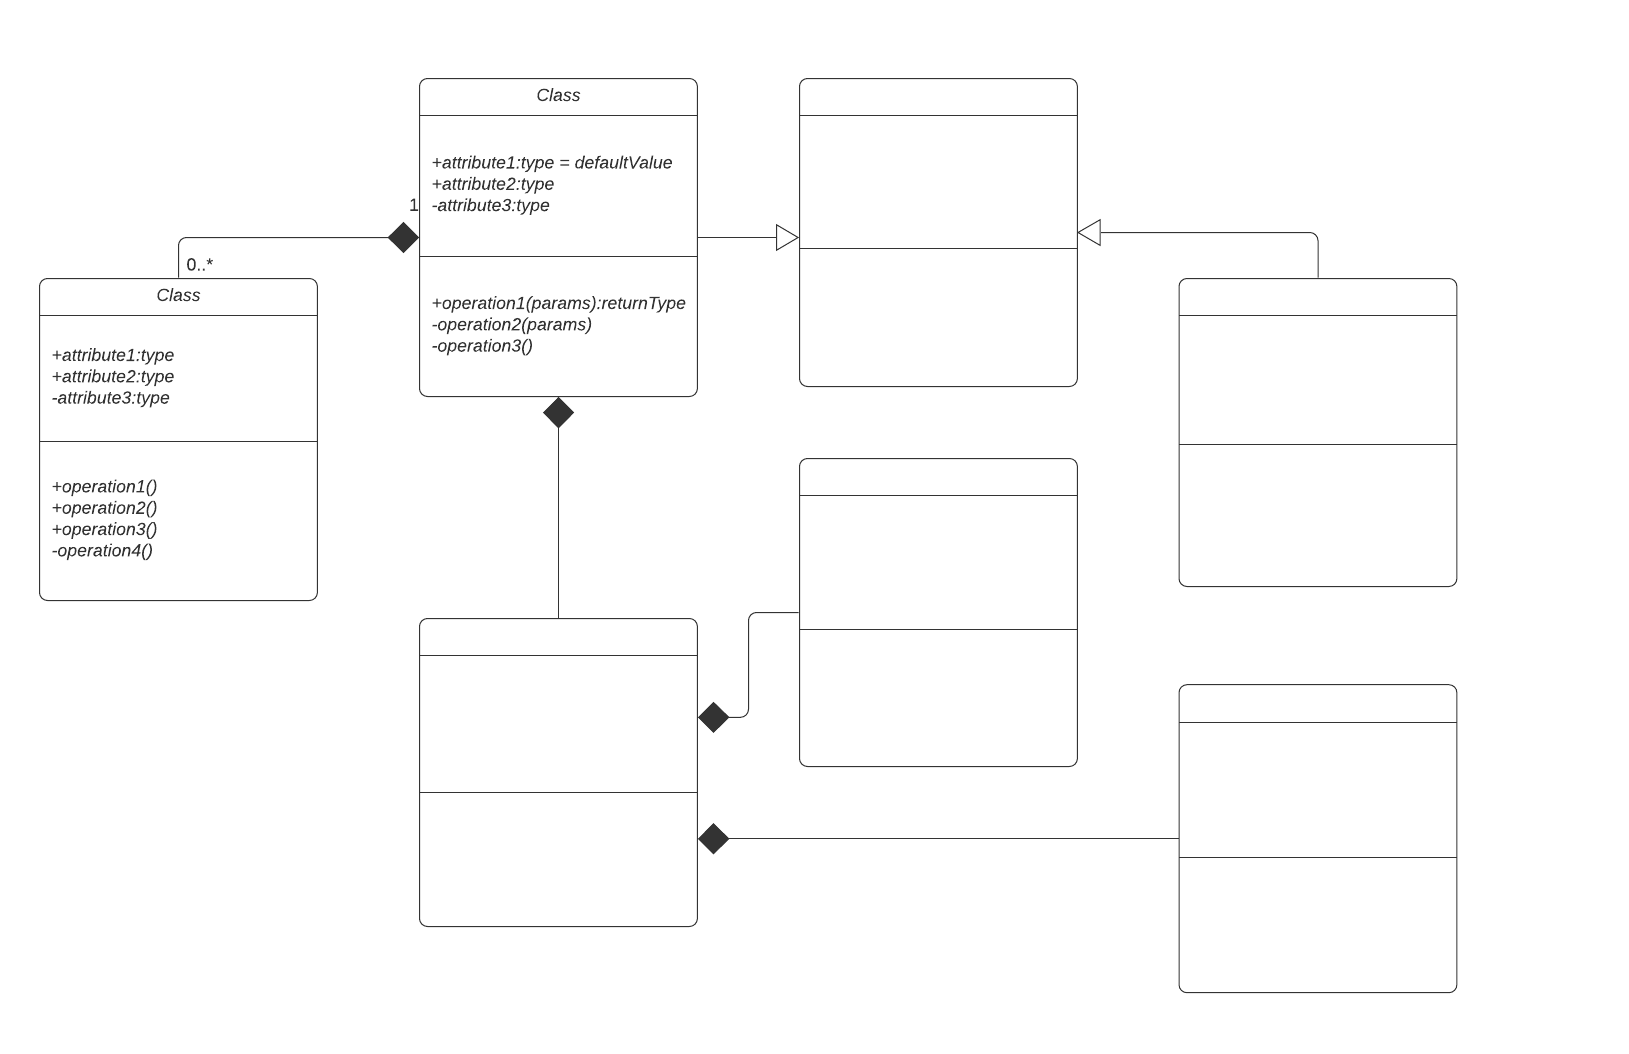
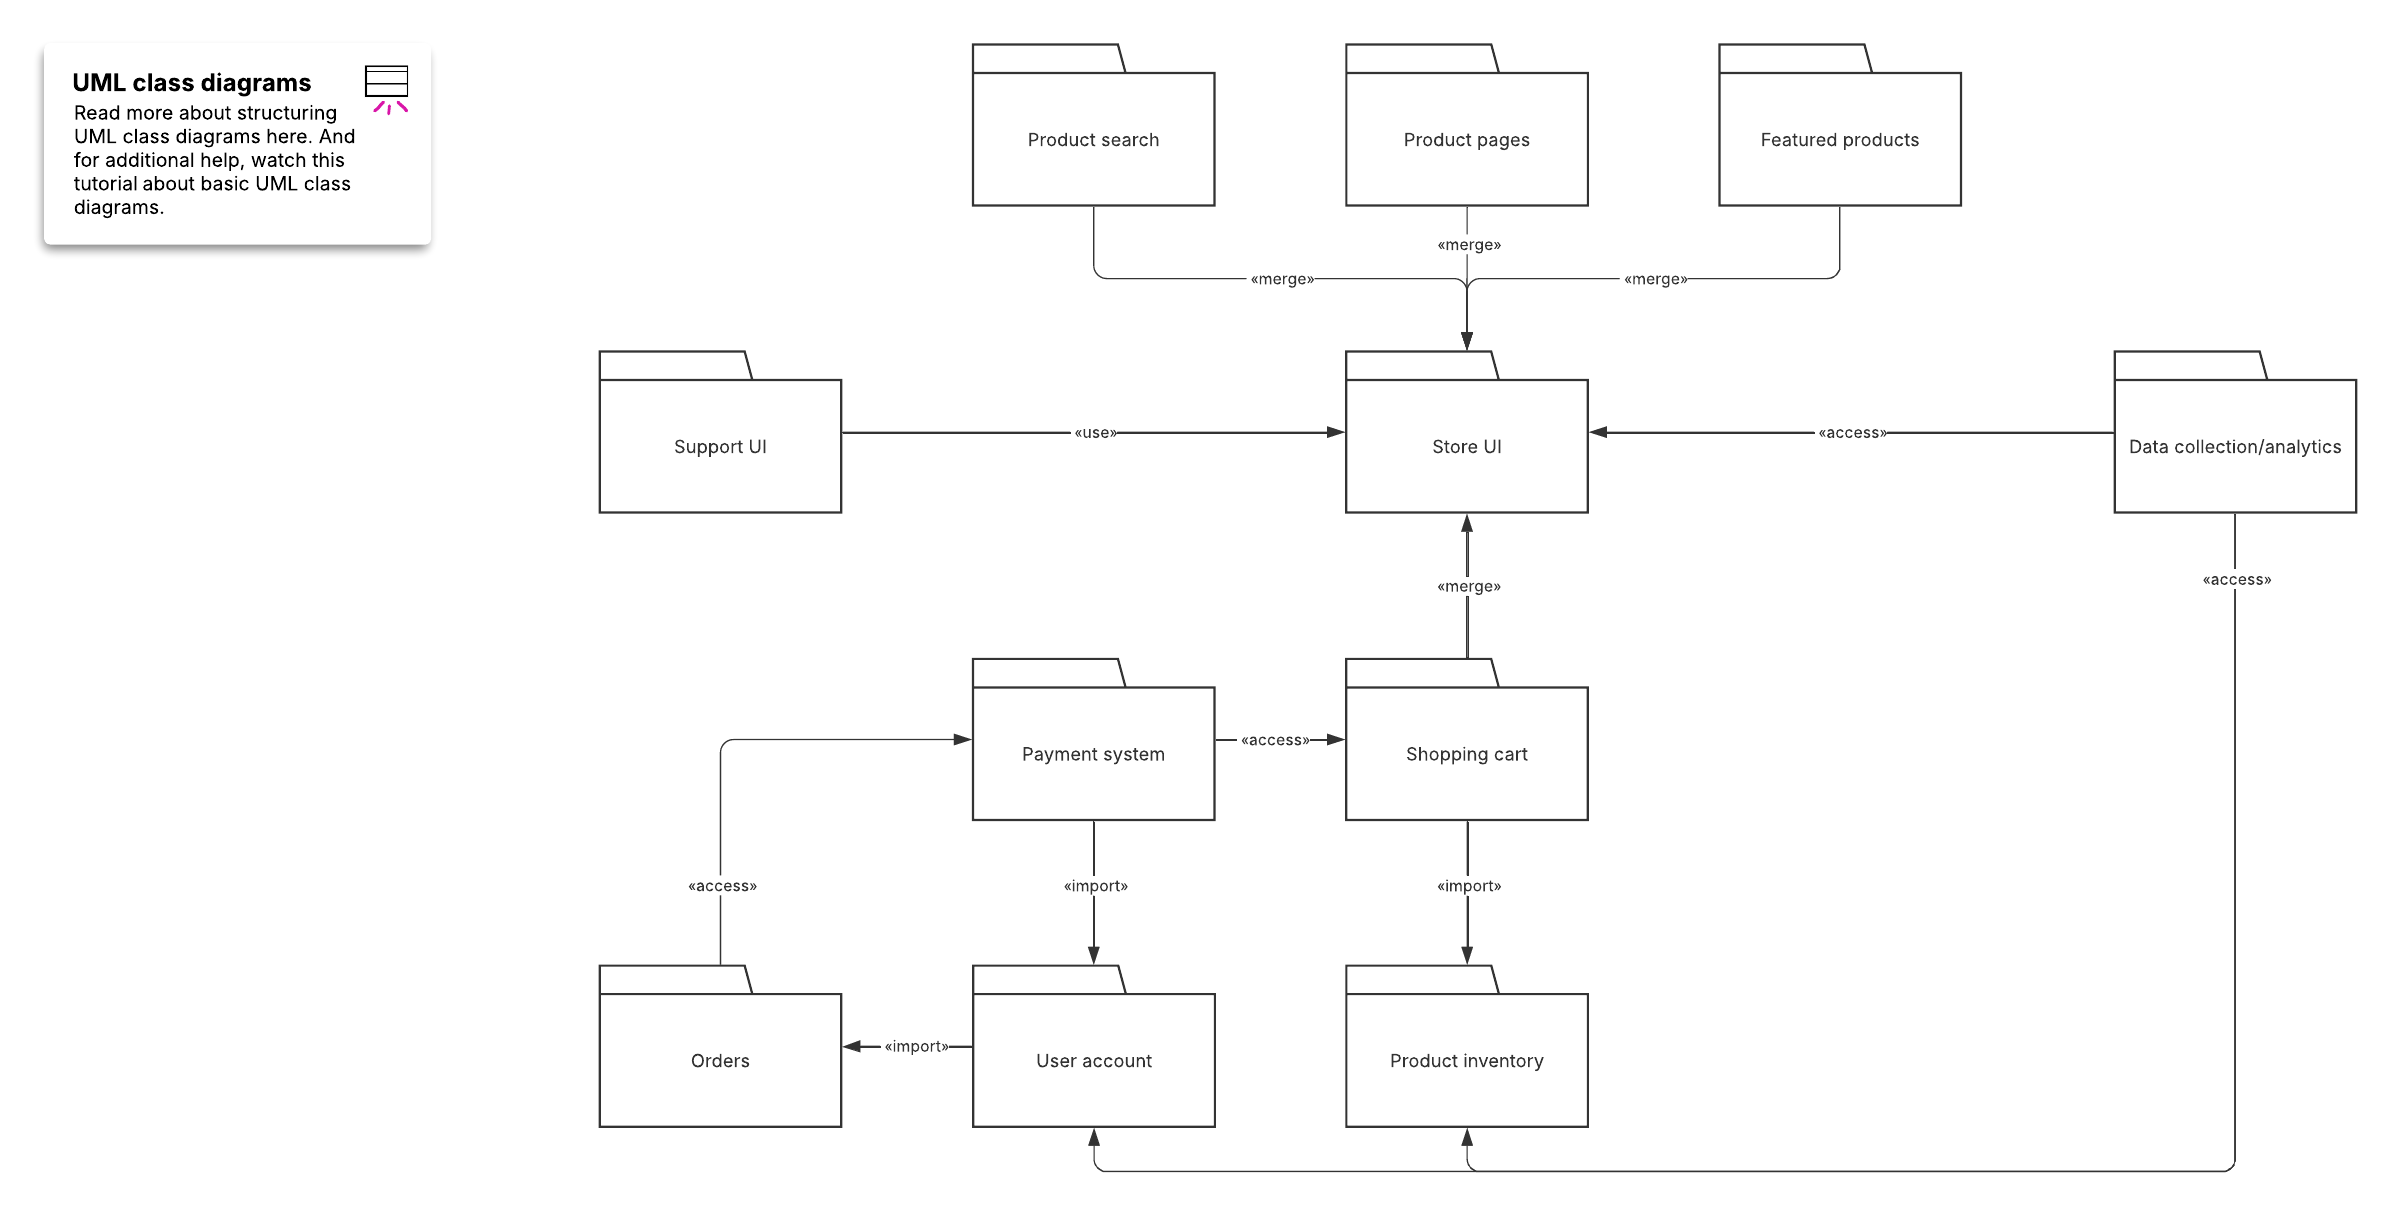
The class shape is a rectangle split into three rows: the class name, its attributes, and its operations. The building blocks also extend to signals, data types, packages, interfaces, enumerations, objects, and artifacts.
Class diagrams map directly to object-oriented code, so a well-planned diagram translates cleanly into Python, Java, or C++.
Access modifiers use compact symbols to set member visibility: public (+), private (-), protected (#), package (~), derived (/), and static (underlined).
Multiplicity annotations such as 0..1 and 1 specify how many instances participate in one of six relationship types: inheritance, association, dependency, aggregation, composition, and realization.
You can build a free class diagram in Lucidchart in a few simple steps, then publish and share it with team members.
A UML class diagram maps the structure of an object-oriented system: its classes, their attributes and operations, and the relationships that connect them. This tutorial explains what a UML class diagram is and which components and relationships it includes, gives real-world examples, and details how to build one in Lucidchart.
What is a UML class diagram?
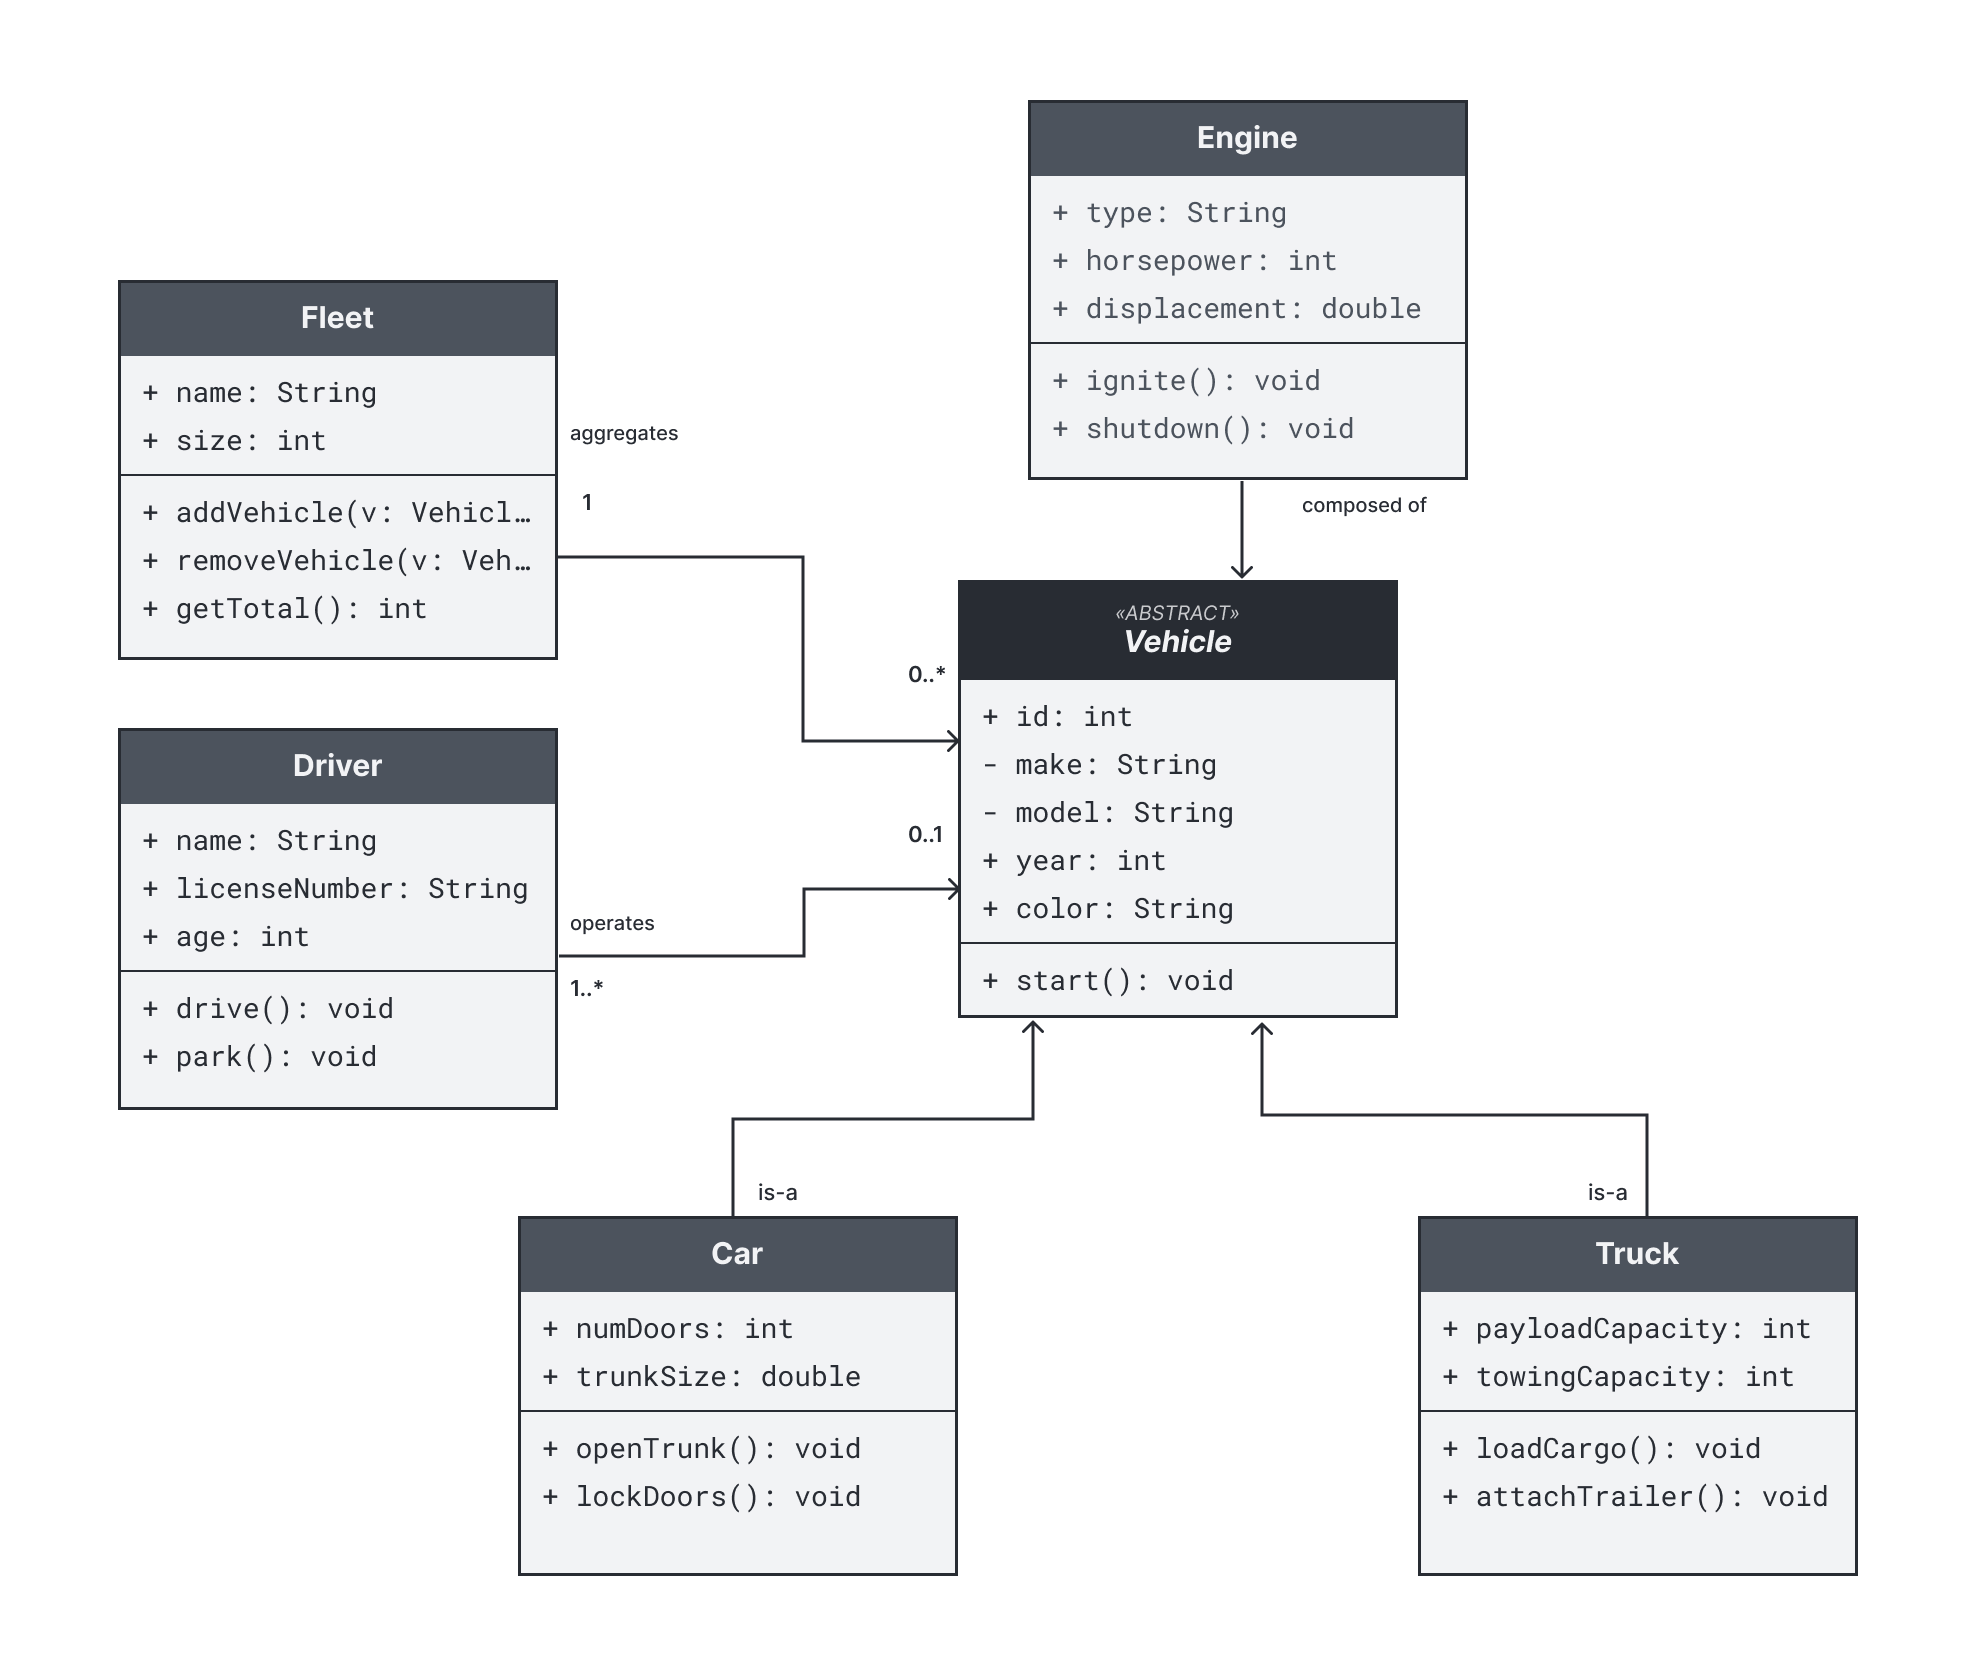
A UML class diagram is a static, structural model and a core building block of object-oriented design that maps directly to code in languages like Python, Java, or C++. Defined by the Unified Modeling Language, it illustrates a system’s classes, attributes, operations, and their relationships. Visually, each class is drawn as a rectangle divided into three rows, each containing its name, attributes, and operations.
For a broader look at how class diagrams fit alongside other UML diagram types, see our UML diagram tutorial, opens in a new tab.
What are the benefits of class diagrams?
Class diagrams give teams a shared, precise view of a system before and after code is written. They help you plan structure, communicate design, and keep documentation aligned with the codebase. Class diagrams also benefit teams as they:
Illustrate data models for information systems, however simple or complex.
Provide an overview of how an application is structured before you write code.
Reduce maintenance time by making a system's structure easy to understand at a glance.
Serve as a reference for both technical and non-technical stakeholders.
What are the components of a class diagram?
A class diagram is assembled from a standard set of UML elements. Each component represents a distinct part of the system you are modeling.
Classes: Describe a set of objects that share attributes and operations
Signals: Represent asynchronous communication passed between objects
Data types: Define a set of values, such as primitives or enumerated types
Packages: Group related elements to organize a large model
Interfaces: Specify a contract of operations that a class can implement
Enumerations: List a fixed set of named values
Objects: Represent specific instances of a class
Artifacts: Model physical files such as source code, scripts, or executables
Sections within a class
Each class rectangle is divided into three stacked sections that read from top to bottom:
The upper section, which is always required, as it contains the class name
The middle section, which conveys the attributes, or the data the class holds
The bottom section, which houses the operations, or the methods the class can perform
Member access modifiers
Visibility symbols sit in front of each attribute or operation to show which parts of the system can access it. Here are the symbols to know and their meanings:
Public (+): Visible to all other classes
Private (-): Visible only within the class
Protected (#): Visible to the class and its subclasses
Package (~): Visible to classes in the same package
Derived (/): A value computed from other attributes
Static (underlined): Belongs to the class itself rather than an instance
Member scopes
Members are scoped either to the classifier or to instances of the class. Underline a member name to mark it as a classifier-scoped member. Instance-scoped members appear without an underline.
What relationships appear in a class diagram?
Relationships show how classes depend on, connect to, and are built from one another. Each relationship uses a distinct line and arrowhead so the diagram communicates intent at a glance.
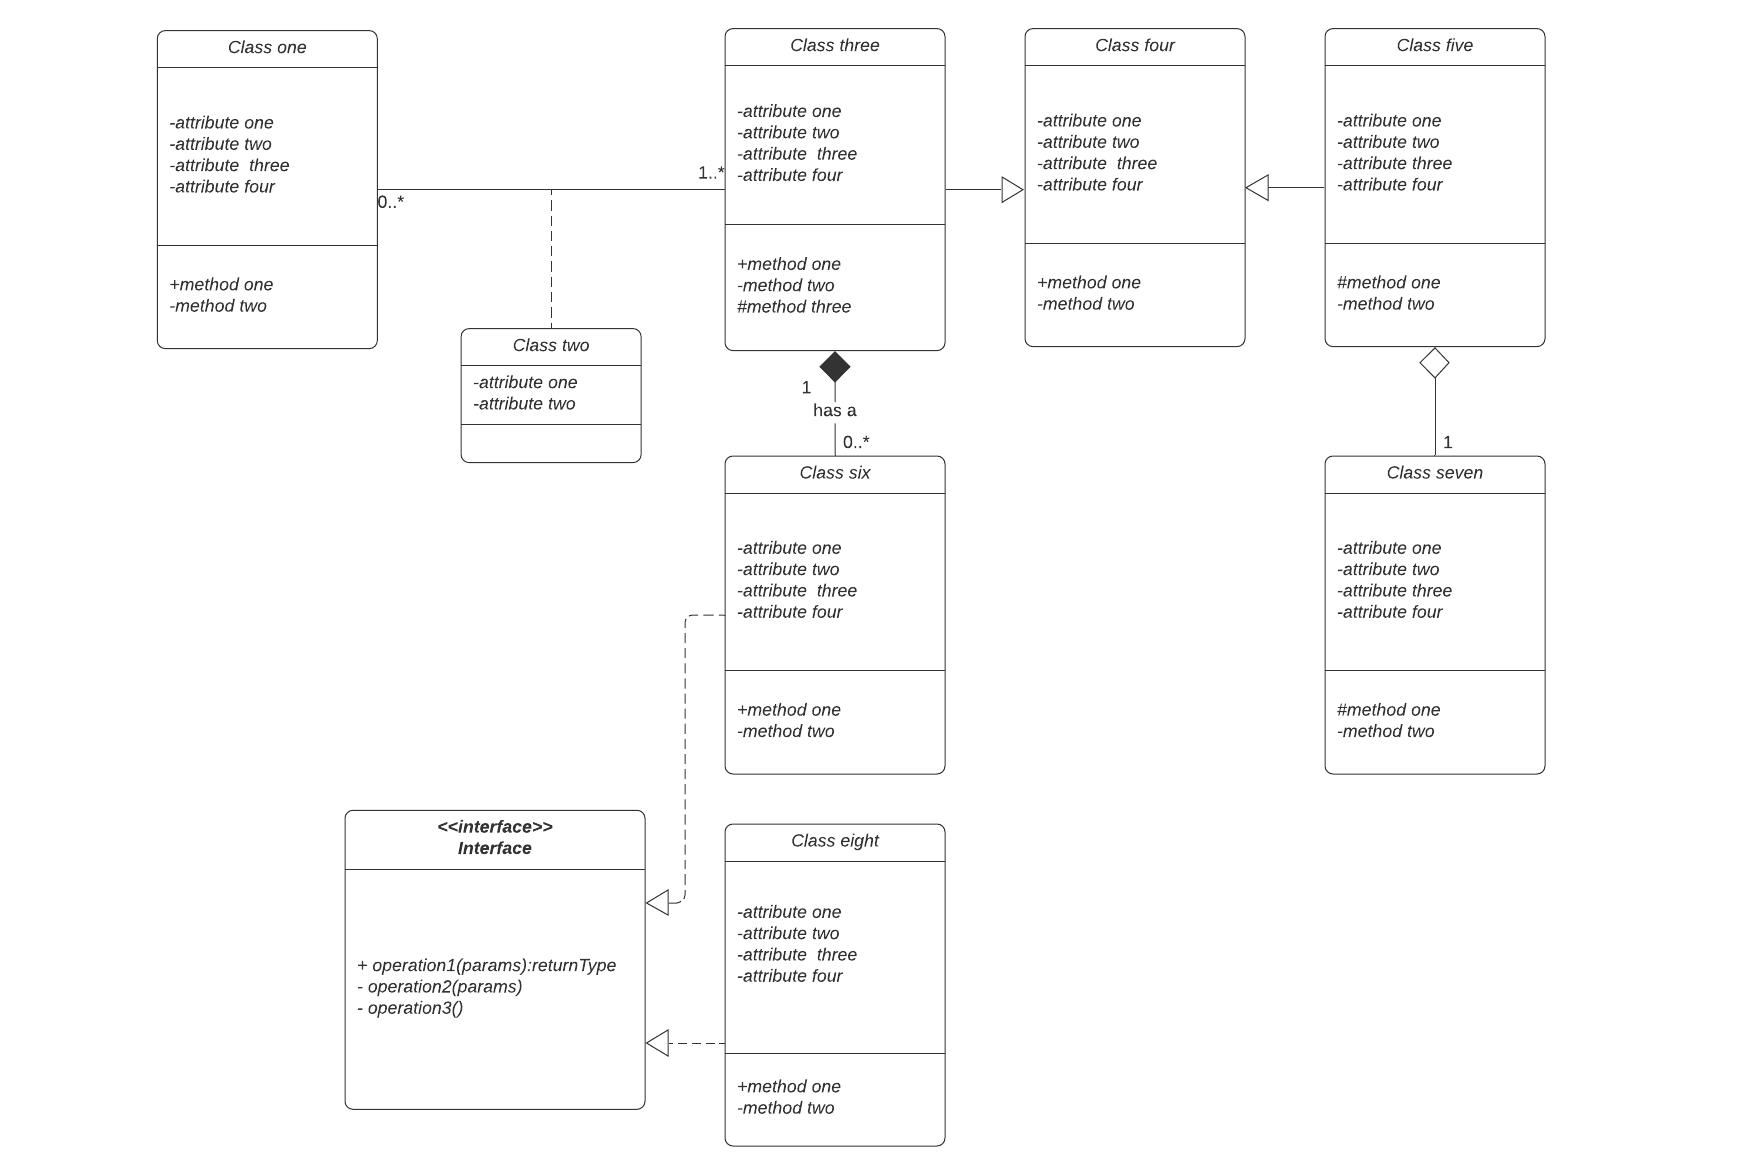
Inheritance (generalization): A solid line with a hollow triangle pointing to the parent class, showing that a child class extends to a more general one
Bidirectional association: A solid line showing that two classes are aware of and connected to each other
Unidirectional association: A solid line with an open arrow, showing that one class knows about the other but not the reverse
Dependency: A dashed line with an open arrow, showing that one class uses another, and a change in one may affect the other
Aggregation: A solid line with a hollow diamond, showing a "has-a" relationship where the parts can exist independently of the whole
Composition: A solid line with a filled diamond, showing strong ownership where the parts are destroyed when the whole is destroyed
Realization (implementation): A dashed line with a hollow triangle pointing to an interface, showing that a class implements that interface
If you want to model specific instances of these classes at a single moment, pair your class diagram with an object diagram. To model how parts collaborate internally, use a composite structure diagram.
Multiplicity
Multiplicity specifies how many instances of one class can be linked to an instance of another. You place the value at each end of an association line.
0: Zero
0..1: Zero or one
1: One
0..*: Zero or many
1..*: One or many
Class diagram examples
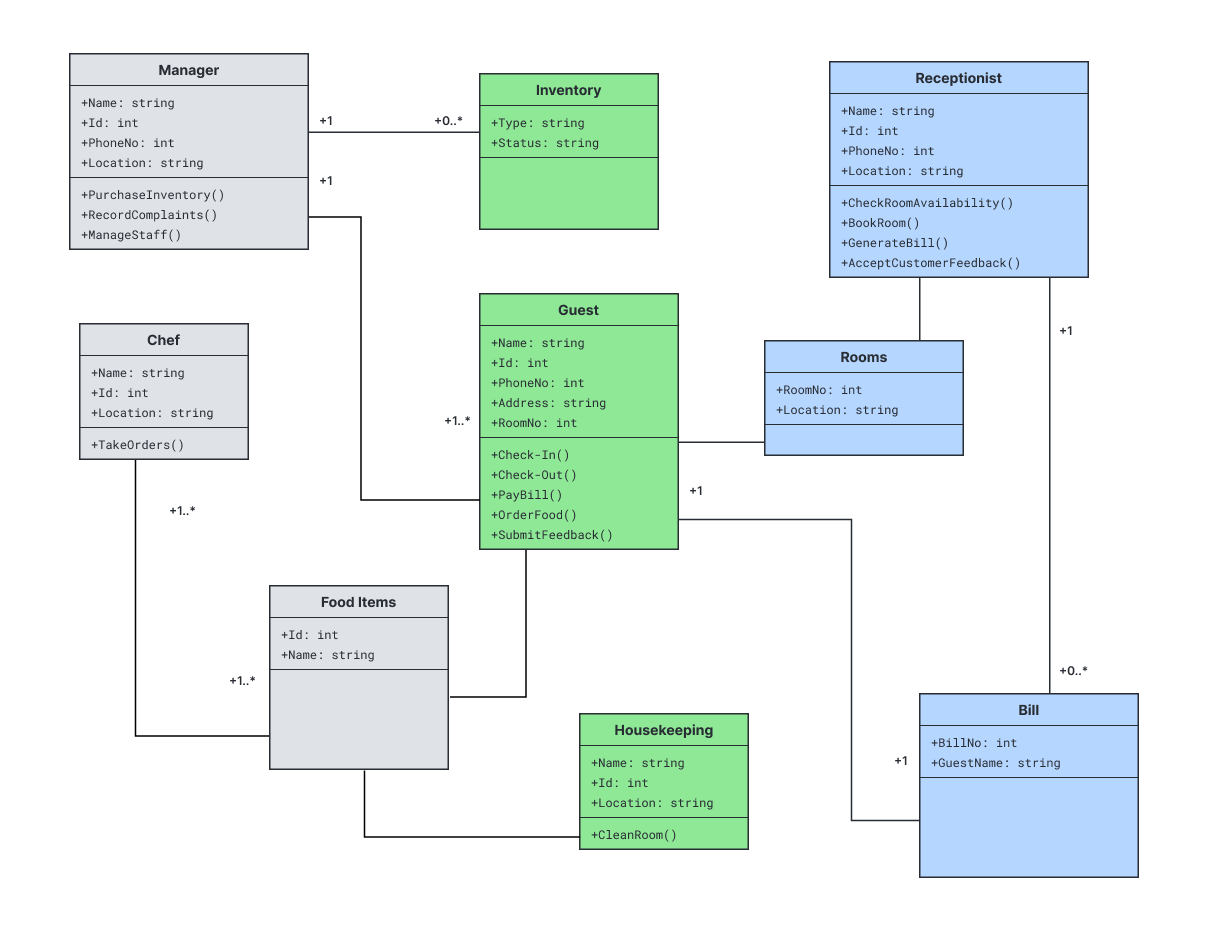
For concrete examples, these two scenarios show how classes and relationships could model real systems.
Hotel management system: A Hotel class aggregates Room classes, while a Reservation class associates Guests with Rooms and dates. Composition ties Rooms to the hotel that owns them.
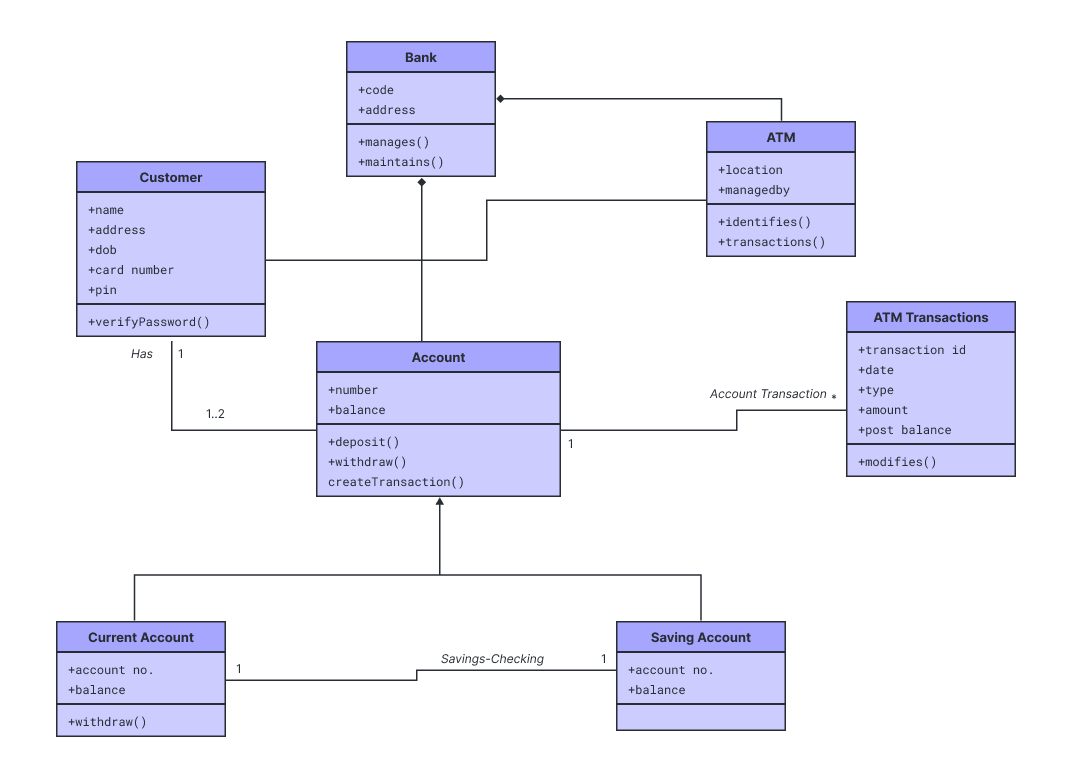
ATM system: An ATM class connects to a Bank class, which manages Account classes. Transaction classes inherit from a shared Base class, and interfaces define how the machine communicates with the bank.
Tips for clear class diagrams
A readable class diagram starts with deliberate planning. Follow these practices to keep diagrams accurate and easy to maintain.
Name classes with clear nouns and use consistent capitalization across the diagram.
Include only the attributes and operations that matter for the purpose of the diagram.
Group related classes with packages to reduce visual clutter.
Choose the correct relationship type so the diagram reflects real ownership and dependencies.
Add a multiplicity to clarify how many instances participate.
How to make a UML class diagram in Lucidchart
Lucidchart’s UML diagram maker includes dedicated shape libraries to help you visualize, map, and structure software systems. Follow these detailed steps to build a clear, standardized UML class diagram manually, from a template, with Lucid AI, or by importing existing architecture files.
1. Get started with Lucidchart
If you’re not already using Lucidchart, sign up for a free account to access the editor. Open a blank document or start from a pre-built UML class diagram template to kick-start your work. You can also import existing files from Visio, draw.io, and more to keep building on existing architecture.
2. Enable the UML shape library
In the left-hand toolbar in the Lucidchart editor, click Search shapes and tools > Shapes and then check the UML shape library. This will give you immediate access to standard shapes as you manually build your diagram.
3. Add shapes and map object relationships
Consider what entities need to be represented in your system architecture. Identify the primary classes, interfaces, abstract classes, and packages, then map out how they interact. Once your component list is clear, you can drag shapes onto your canvas. Arrange them logically, placing core base classes or parent entities near the top or center to make relationships easier to follow.
4. Format and refine the diagram
Review your overall layout to ensure the architecture is clean and easy to read. Rearrange class nodes as needed to reduce line crossings. Alignment guides can help you keep items evenly spaced. Adjust fonts, colors, and line styles so relationships and class boundaries are easy to read.
5. Publish, implement, and share
Once your class diagram reflects your desired structure, you can share it with stakeholders. You can download the document in multiple formats, such as PDF, PNG, or SVG, or embed it directly into your team’s wiki. You can also publish it directly to Google Workspace or insert your diagram into Microsoft Word, Excel, and PowerPoint using Lucid integrations.
Diagram with Lucid AI
As an alternative to manual creation, try generating a class diagram using Lucid AI in just a few simple steps:
Click on the Lucid AI icon on the left toolbar.
Enter a prompt describing the system or model you want to represent. For example, you could type, “Create a UML class diagram for an e-commerce platform with Users, Orders, Products, and Payment Gateways.” You can also attach a file to provide more context or use voice-to-text to verbally describe your prompt.
From there, iterate with the AI agent, answering questions to help create the finished visual.
Watch Lucid AI build a customized, fully editable UML class diagram in seconds.
How to make a UML class diagram video
This walkthrough covers the basic characteristics of creating class diagrams using practical examples from a simple zoo system to a complex online shopping cart.
Ready to get started? Try out Lucidchart for creating polished UML class diagrams.