Contents
Timing diagram tutorial
5 min
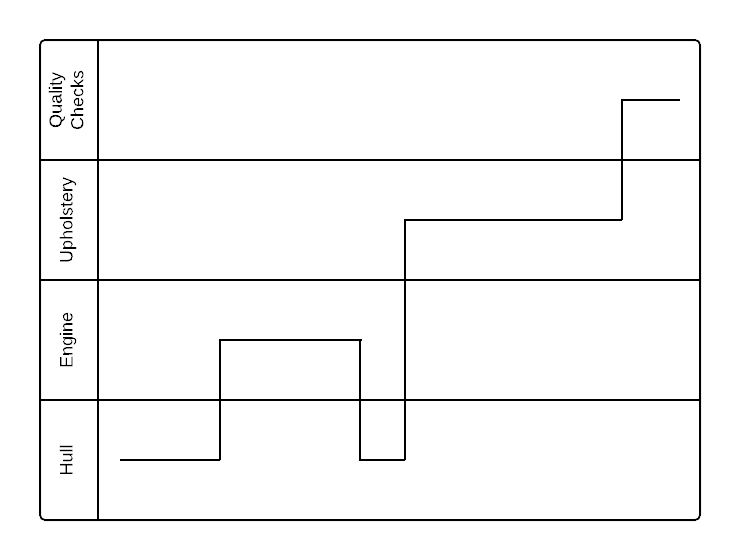
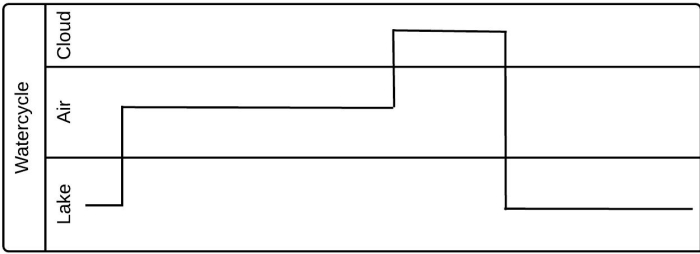
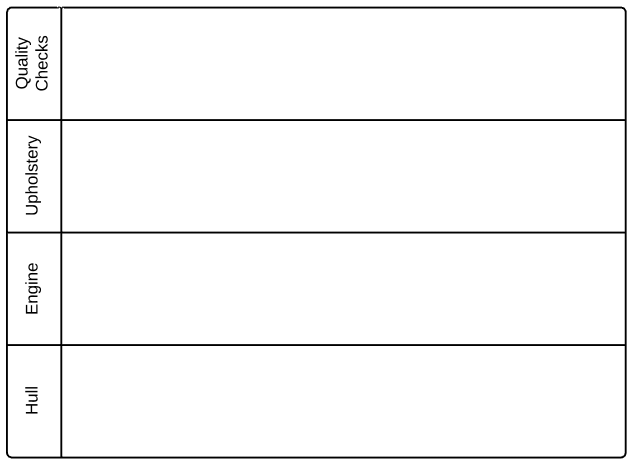
A timing diagram is a specific behavioral modeling diagram that focuses on timing constraints. If you need to know how objects interact with each other during a certain period of time, create a timing diagram with our UML diagramming software and refer to this guide if you need additional insight along the way.
UML diagram templates and examples
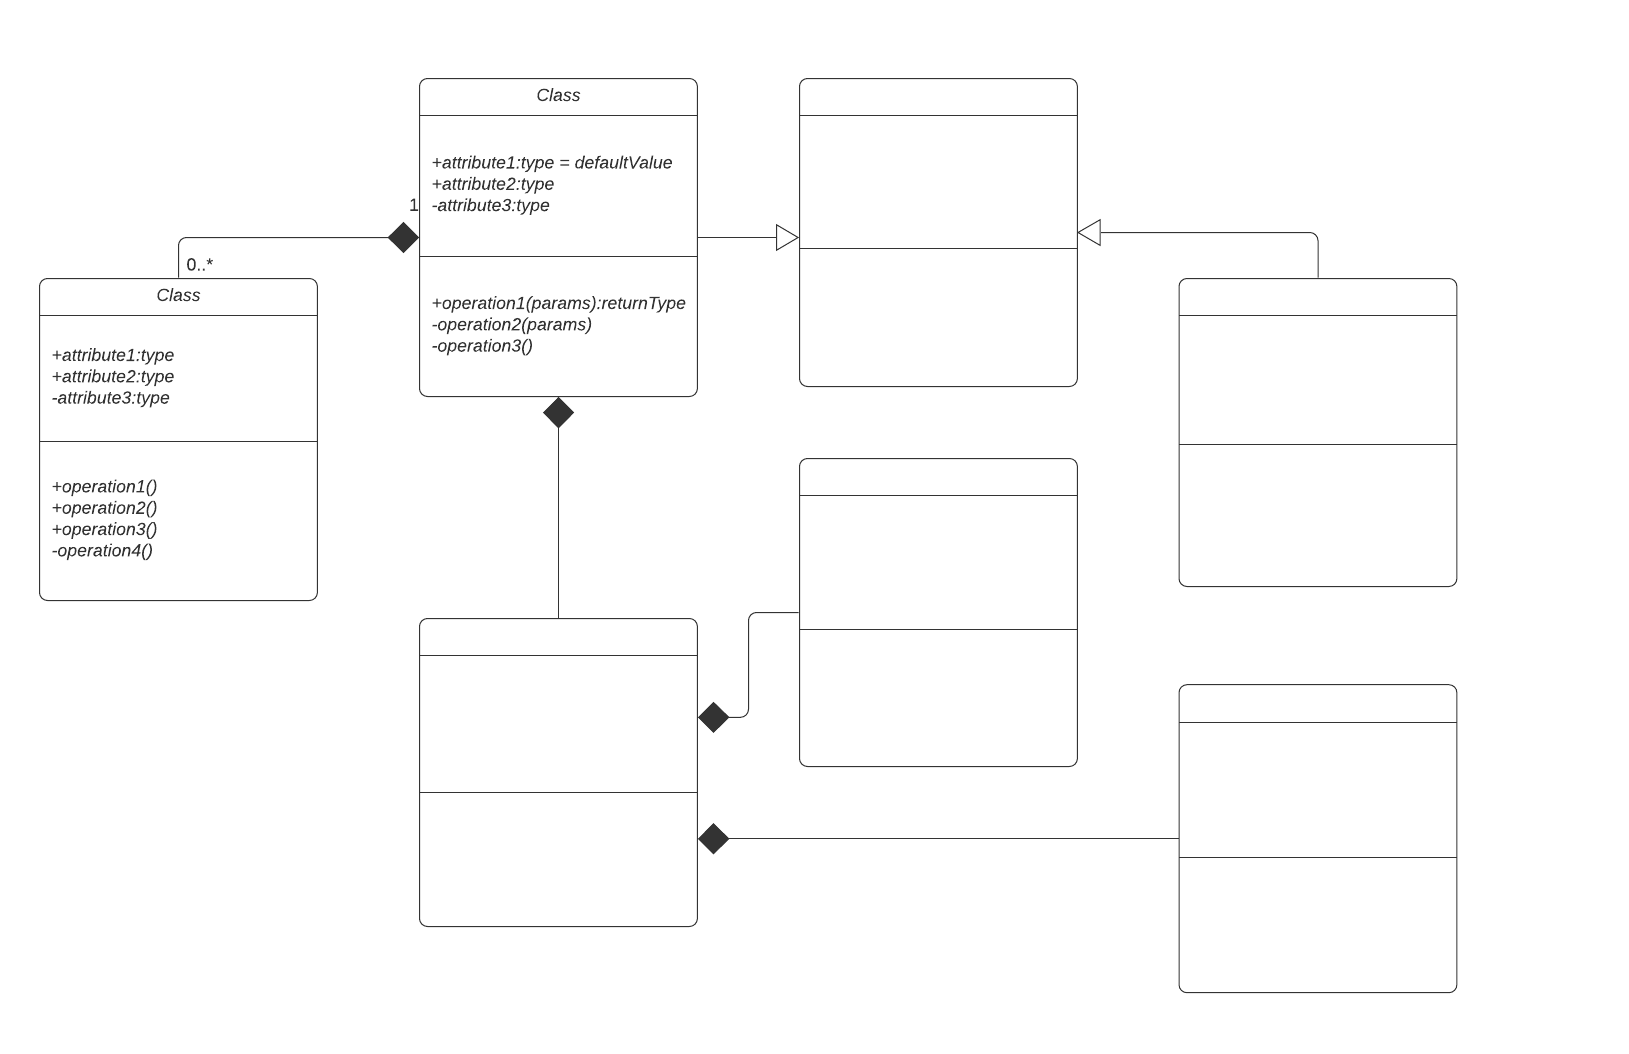
Class diagram with UML notation
Pricing:
Paid Account
Class diagram with UML notation, Pricing: Paid Account
Additional UML resources
UML diagram maker
No matter the type of UML diagram you need to create, Lucidchart can help you get to work on it right away, with detailed shape libraries, hundreds of templates, AI diagram generation, and more.
UML diagram tutorial
Read our comprehensive guide to learn the definition of UML, the 14 types of UML diagrams, and the steps for creating a UML diagram.
Use case diagram tutorial
The purpose of a use case diagram in UML is to demonstrate the different ways that a user might interact with a system. Learn more about this UML diagram type.
Frequently asked questions
What is a timing diagram?
What are the main components of a timing diagram?
How do I create a timing diagram in Lucidchart?
What shapes do I need for a timing diagram in Lucidchart?
How can I share my timing diagram with others?
Can I import existing diagrams into Lucidchart?
How does a timing diagram differ from a sequence diagram?
What can timing diagrams help me identify?
Everything you need to make a UML diagram
In addition to our online UML diagram tool, Lucidchart offers support and training resources to help you branch out to any type of diagram.
Make a diagram