Key takeaways
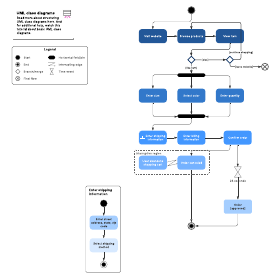
An activity diagram is a UML behavior diagram that shows the activities of a system. Other behavior diagrams include use case and state machine diagrams.
The basic components of an activity diagram include actions, decision nodes, control flows, start and end nodes, and swimlanes that assign work to responsible actors.
Activity diagram symbols cover starting, ending, merging, forking, and signal-handling steps, so you can model complex flows precisely.
Teams use activity diagrams to model algorithm logic, business workflows, use case steps, and software architecture elements, like methods and operations.
Lucidchart provides UML shape libraries, ready-made templates, and AI generation for building an activity diagram quickly.
Unified Modeling Language (UML) is powerful for visualizing and documenting software systems, but the terminology can feel overwhelming at first. An activity diagram is essentially a flowchart that shows the activities a system performs, and this guide will help you build one.
What is an activity diagram?
An activity diagram is a UML behavior diagram that models the flow of activities within a system, much like a flowchart. Along with the use case diagram, opens in a new tab and state machine diagram, it describes what must happen in the system being modeled.
The Unified Modeling Language groups its diagrams into structure, interaction, and behavior diagrams. UML 2.x reformalized activity diagrams with Petri-net-like semantics, giving flows a clearer, more rigorous meaning.
Stakeholders manage many issues at once, so clarity and brevity matter. Activity diagrams help business and development teams understand the same process using a shared set of symbols for starting, ending, merging, and receiving steps.
Benefits of activity diagrams
Consider creating an activity diagram to:
Demonstrate the logic of an algorithm.
Describe the steps performed in a UML use case.
Illustrate a business process or workflow between users and the system.
Simplify and improve any process by clarifying complicated use cases.
Model software architecture elements, such as methods, functions, and operations
Basic components of an activity diagram
There are several basic components you’ll see in an activity diagram:
Action: An action is a step in which users or software perform a task. Actions are represented by rounded rectangles.
Decision node: A decision node is a conditional branch shown as a diamond, with a single input and two or more outputs.
Control flows: Control flows are the connectors that show the flow between steps in the diagram.
Start node: A start node marks the beginning of the activity, shown as a black circle.
End node: An end node marks the final step, shown as an outlined black circle.
Swimlanes: Swimlanes are partitions that group actions by the actor or role responsible for them, clarifying who does what.
With Lucid’s activity diagram maker, you can easily build polished activity diagrams.
Learn moreActivity diagram symbols
Activity diagram symbols follow standardized UML notation, so any reader can interpret the flow. Common symbols include:
Start symbol: Marks where the activity begins

Action symbol: Shows a single action or step in the flow
Activity symbol: Shows multiple actions

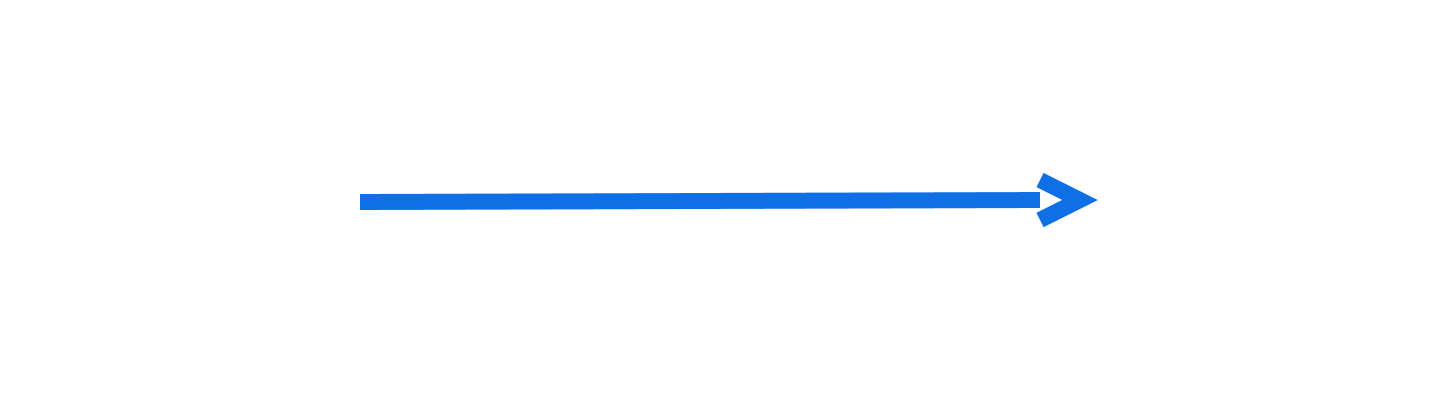
Connector: Links symbols to show the direction of the flow
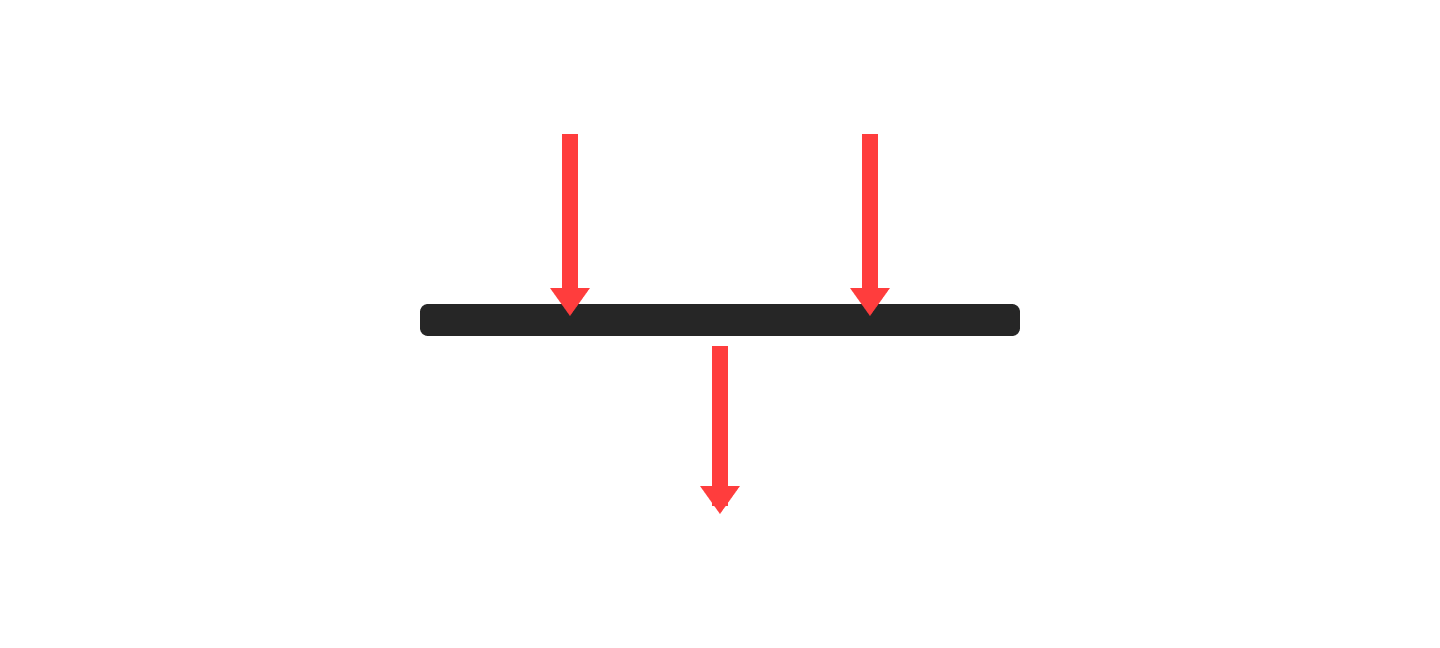
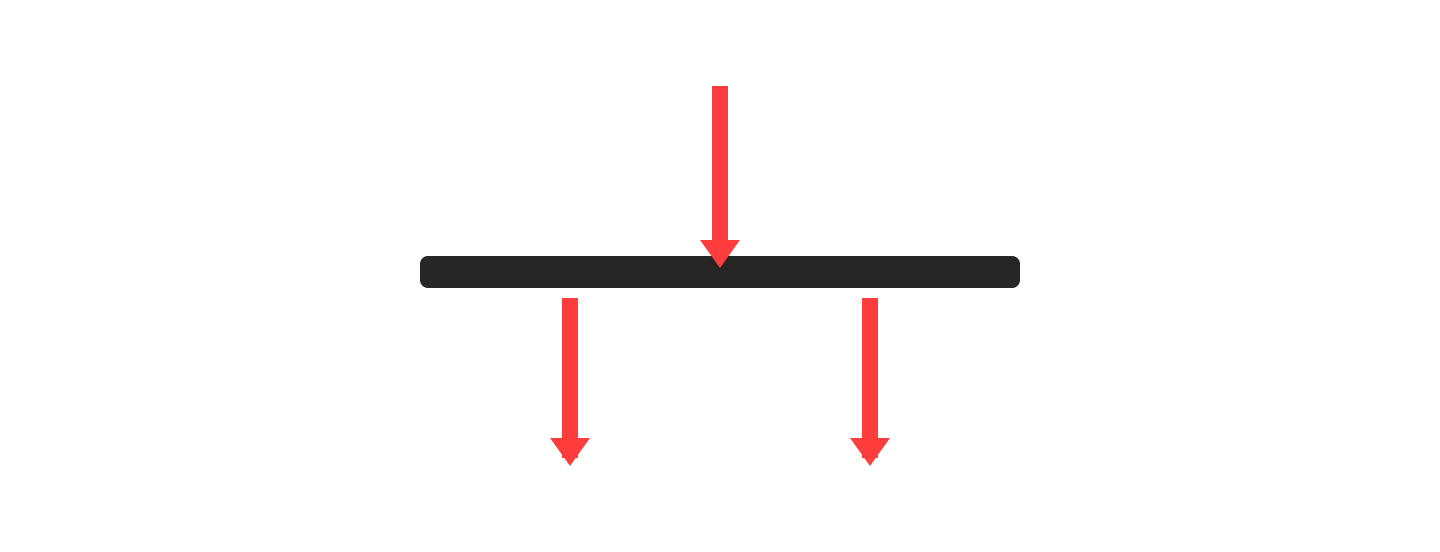
Join symbol (synchronization bar): Combines and synchronizes multiple concurrent flows back into one
Fork symbol: Splits a single flow into multiple concurrent flows
Decision symbol: A branch point that routes the flow based on a condition

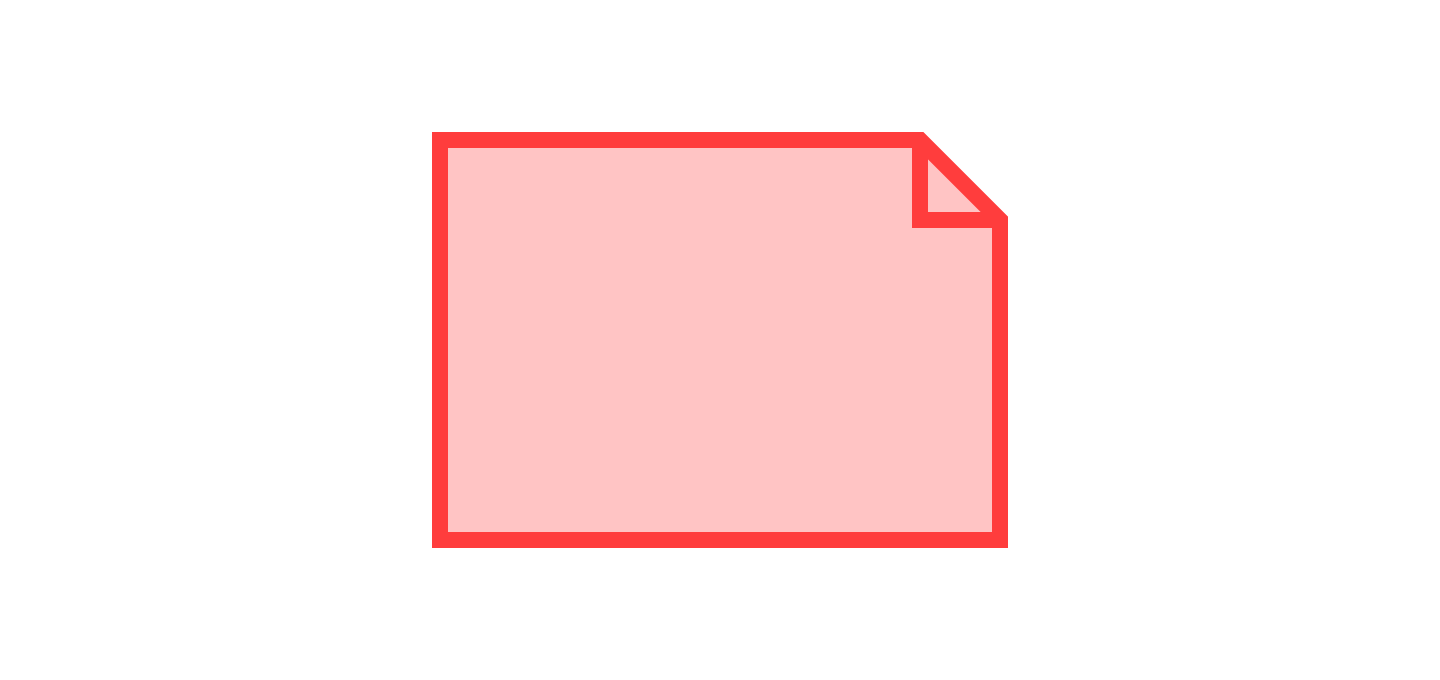
Note symbol: Adds explanatory comments to the diagram
Send signal symbol: Shows the flow sending a signal to another process
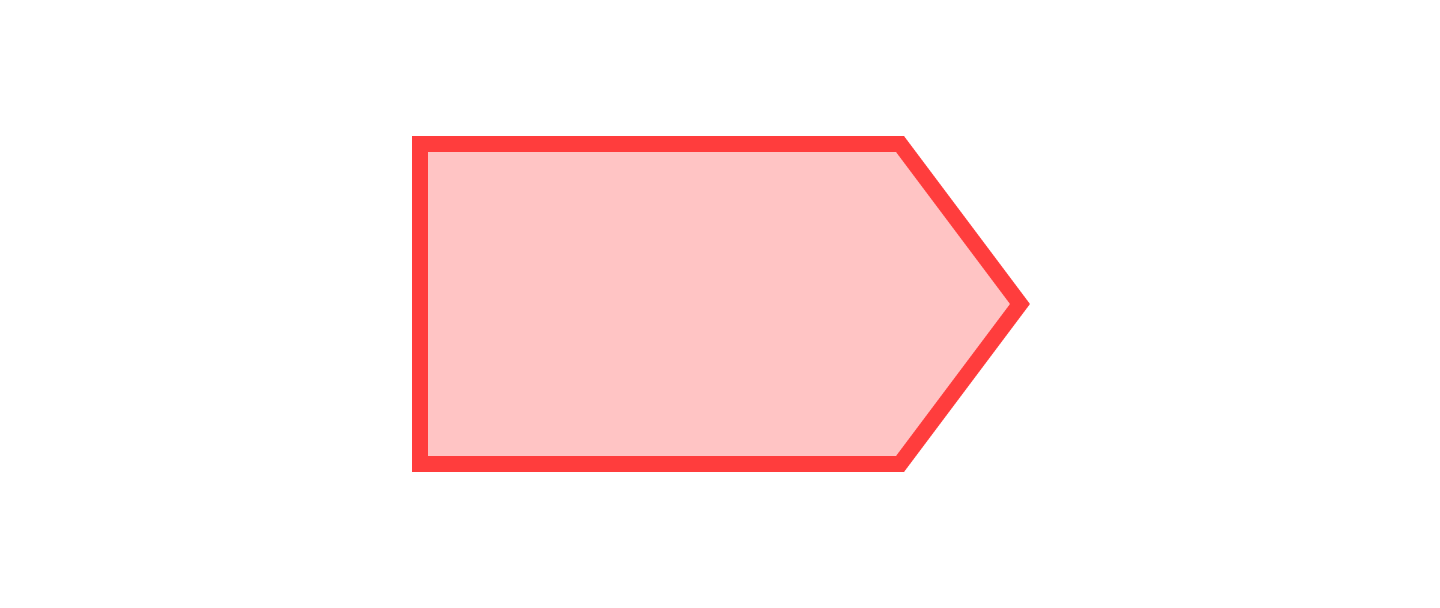
Receive signal symbol: Shows the flow waiting on or receiving a signal

Flow final symbol: Ends a single flow without ending the entire activity

End symbol: Ends all flows and completes the activity

Condition text: Labels a flow with the condition under which it runs

Activity diagram examples
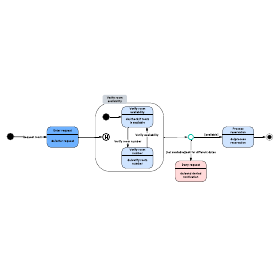
An activity diagram example maps out a process flow in a way that is easy to follow. Here are two common scenarios.
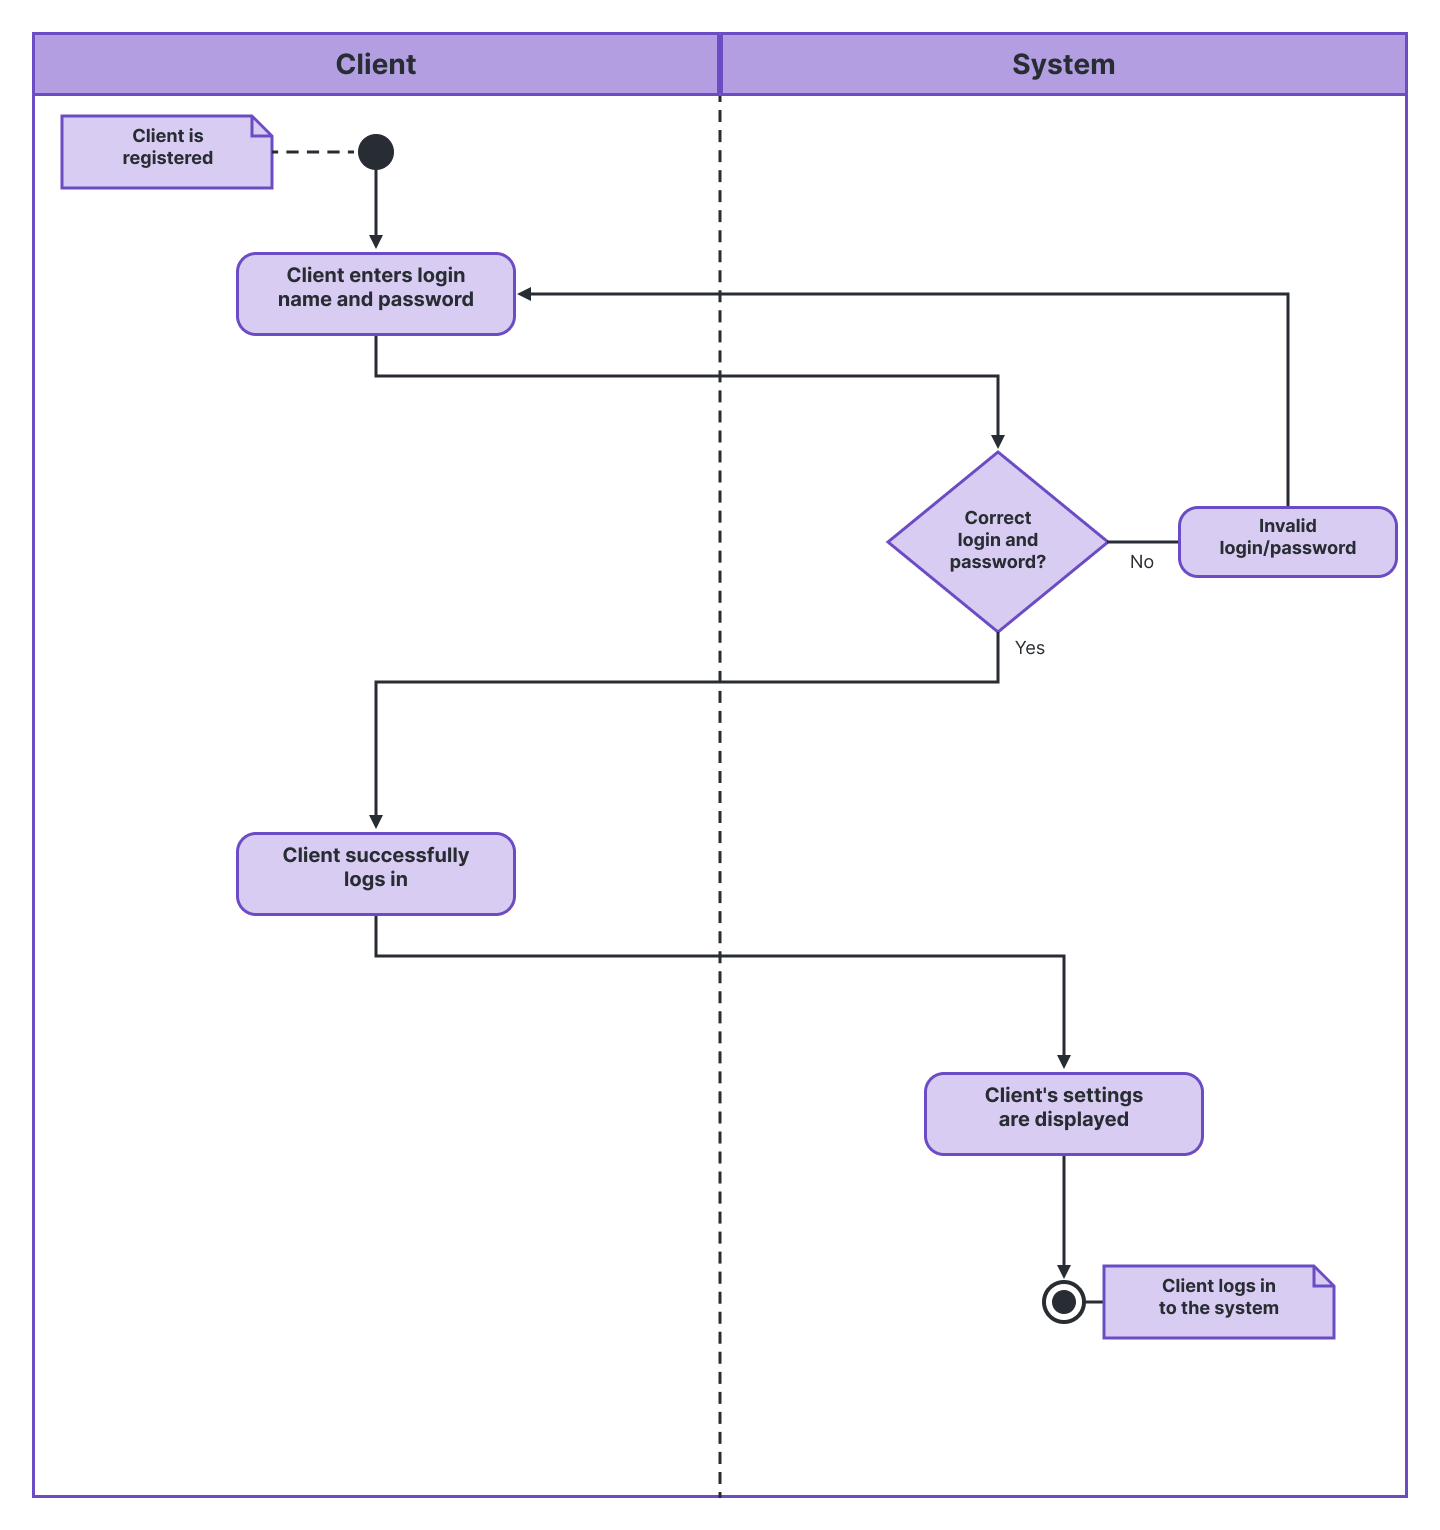
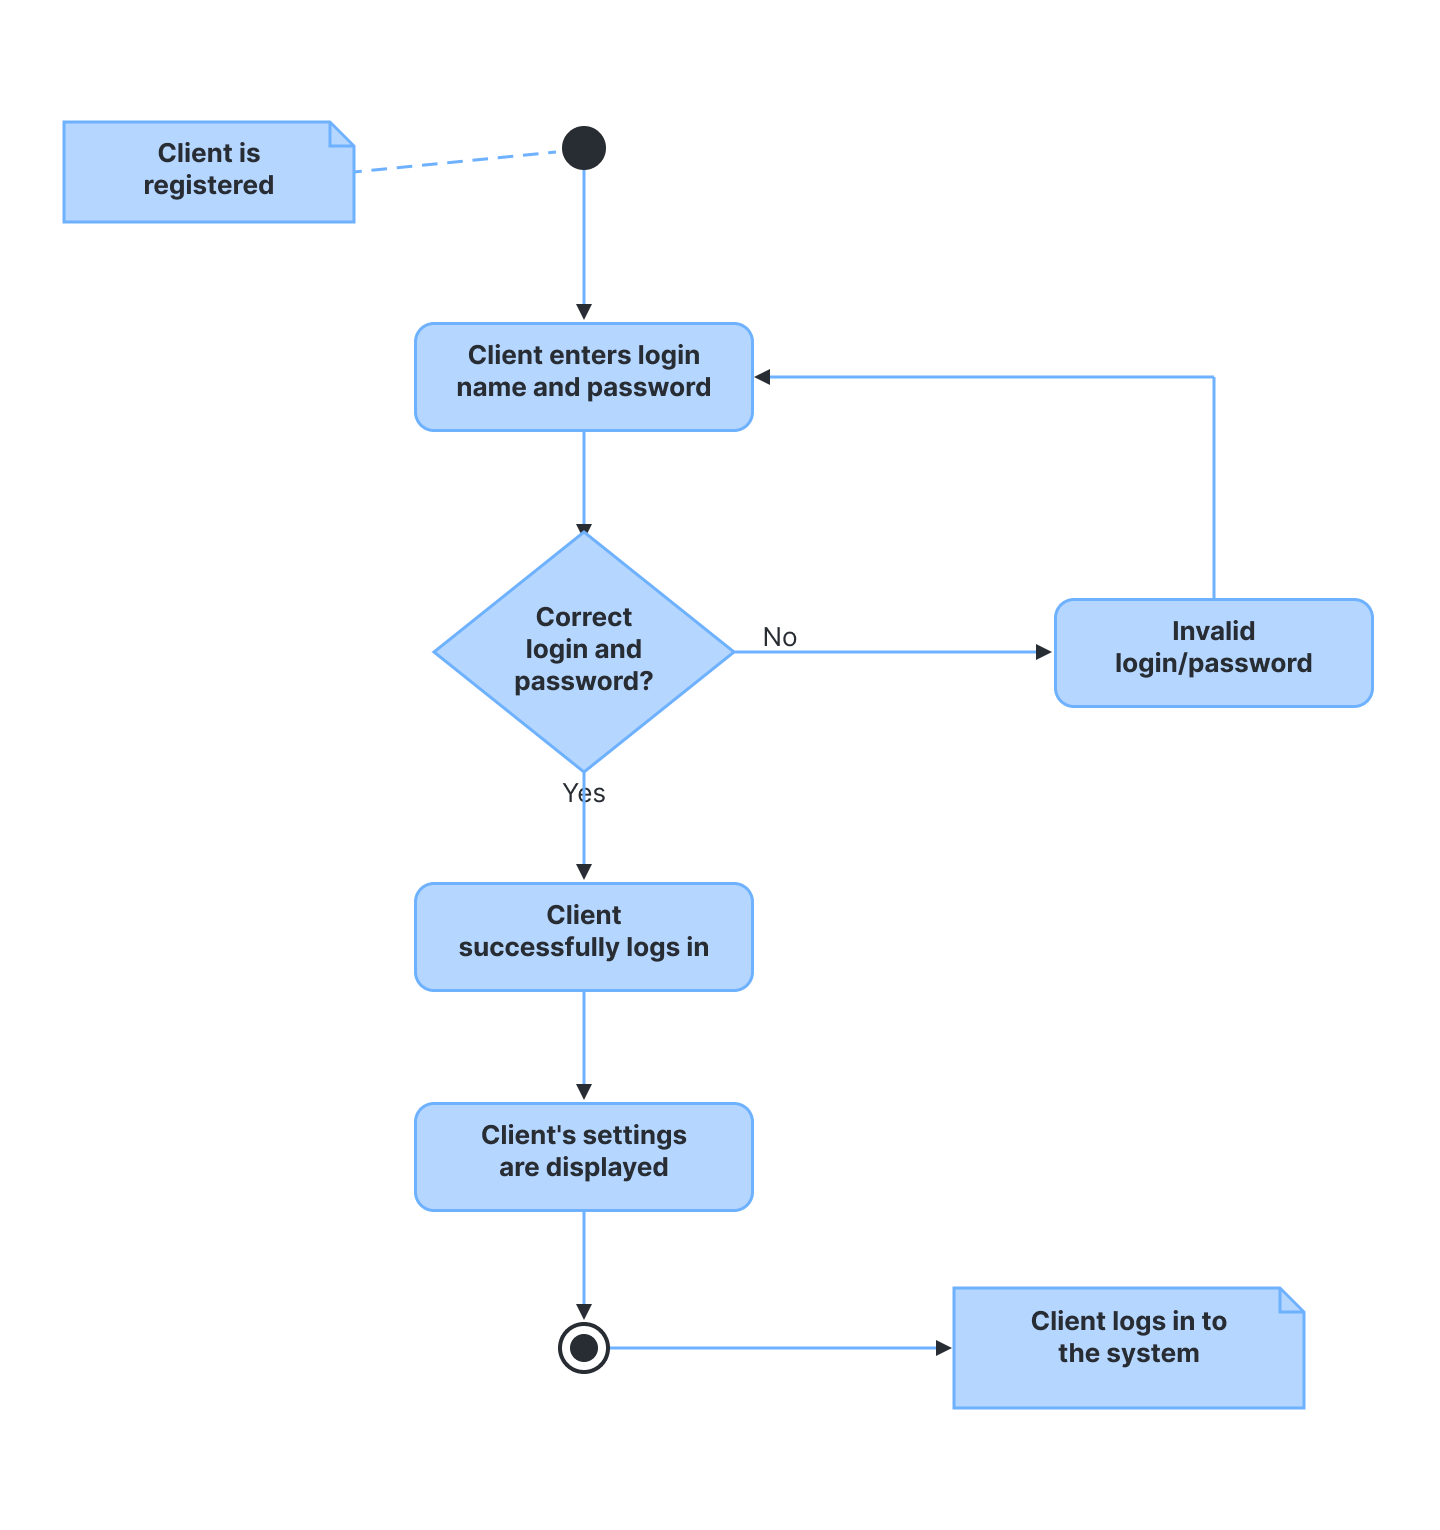
Activity diagram for a login page
This example shows the process of logging into a website, from entering a username and password to successfully logging in. It uses distinct container shapes for activities, decisions, and notes.
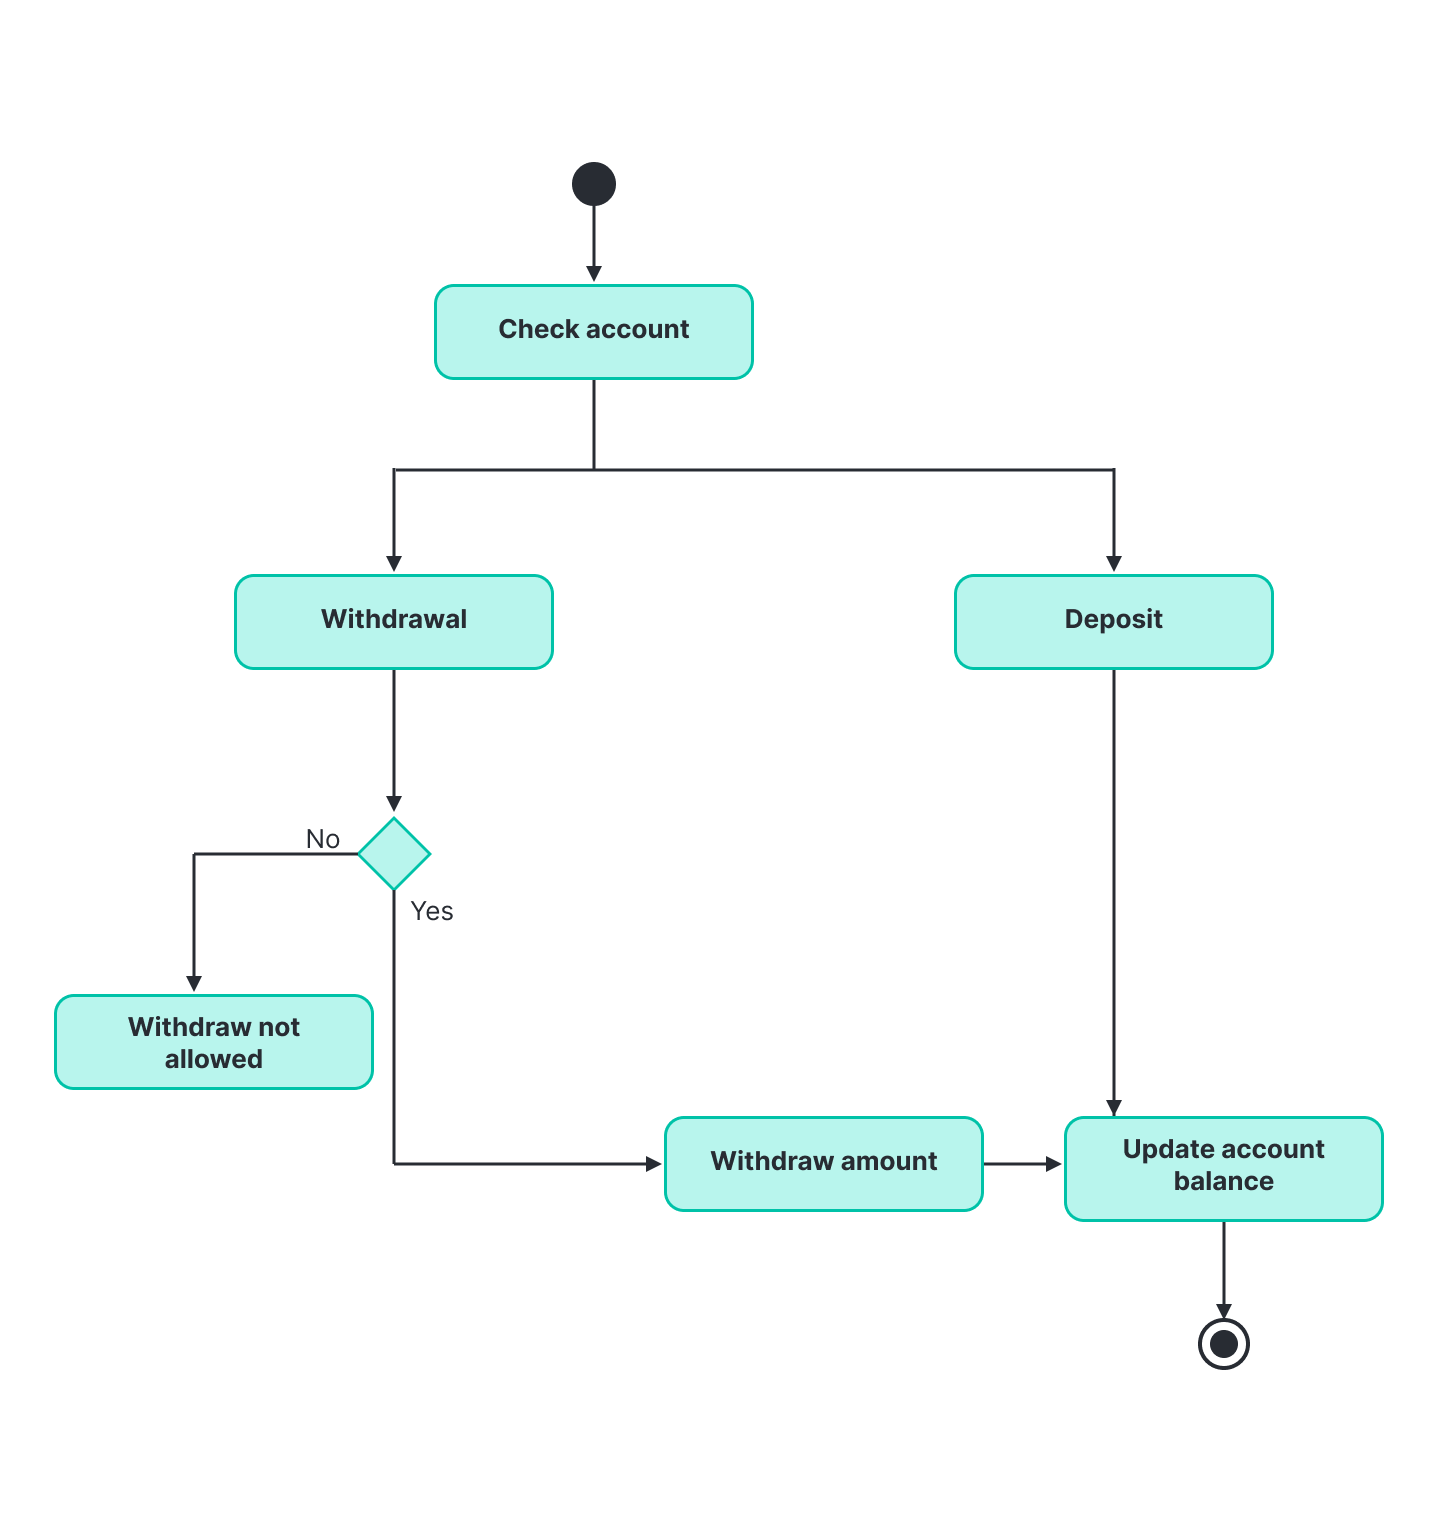
Activity diagram for a banking system
This example shows how a customer withdraws and deposits money into a bank account. Both transaction paths appear on a single chart to compare the flows side by side.
How to make an activity diagram in Lucidchart
You can make an activity diagram in Lucidchart by adding the UML shape libraries, then dragging symbols onto the canvas and connecting them.
Follow these steps:
Open a blank document or start with a template.
Click the Search icon, then select Shapes > Browse all shapes > UML > UML State/Activity > Use selected shapes.
Drag the symbol you want from the toolbox onto the canvas.
Model the process flow by drawing lines between the shapes.
For more details on enabling shapes, see how to add UML shape libraries, opens in a new tab.
If you prefer a faster start, you can generate an activity diagram with Lucid AI, opens in a new tab from a text prompt, then refine it on the canvas.
This video walks through what a UML activity diagram is, how it differs from a flowchart, and when to use one. It covers standardized notation, including action states, forks, and swimlanes, and shows how to build an activity diagram in Lucidchart
Ready to get started building activity diagrams in Lucidchart?
Create a UML activity diagram with a free Lucidchart account.
Sign up now