Contents
Component diagram tutorial
10 min
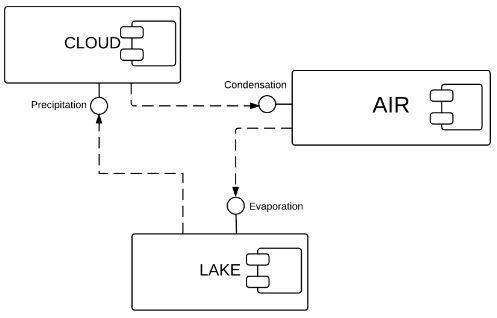
Component diagrams are integral to building your software system. Drawn out with UML diagramming software, they help your team understand the structure of existing systems and then build new ones. Keep reading to learn more about component diagrams.
UML diagram templates and examples
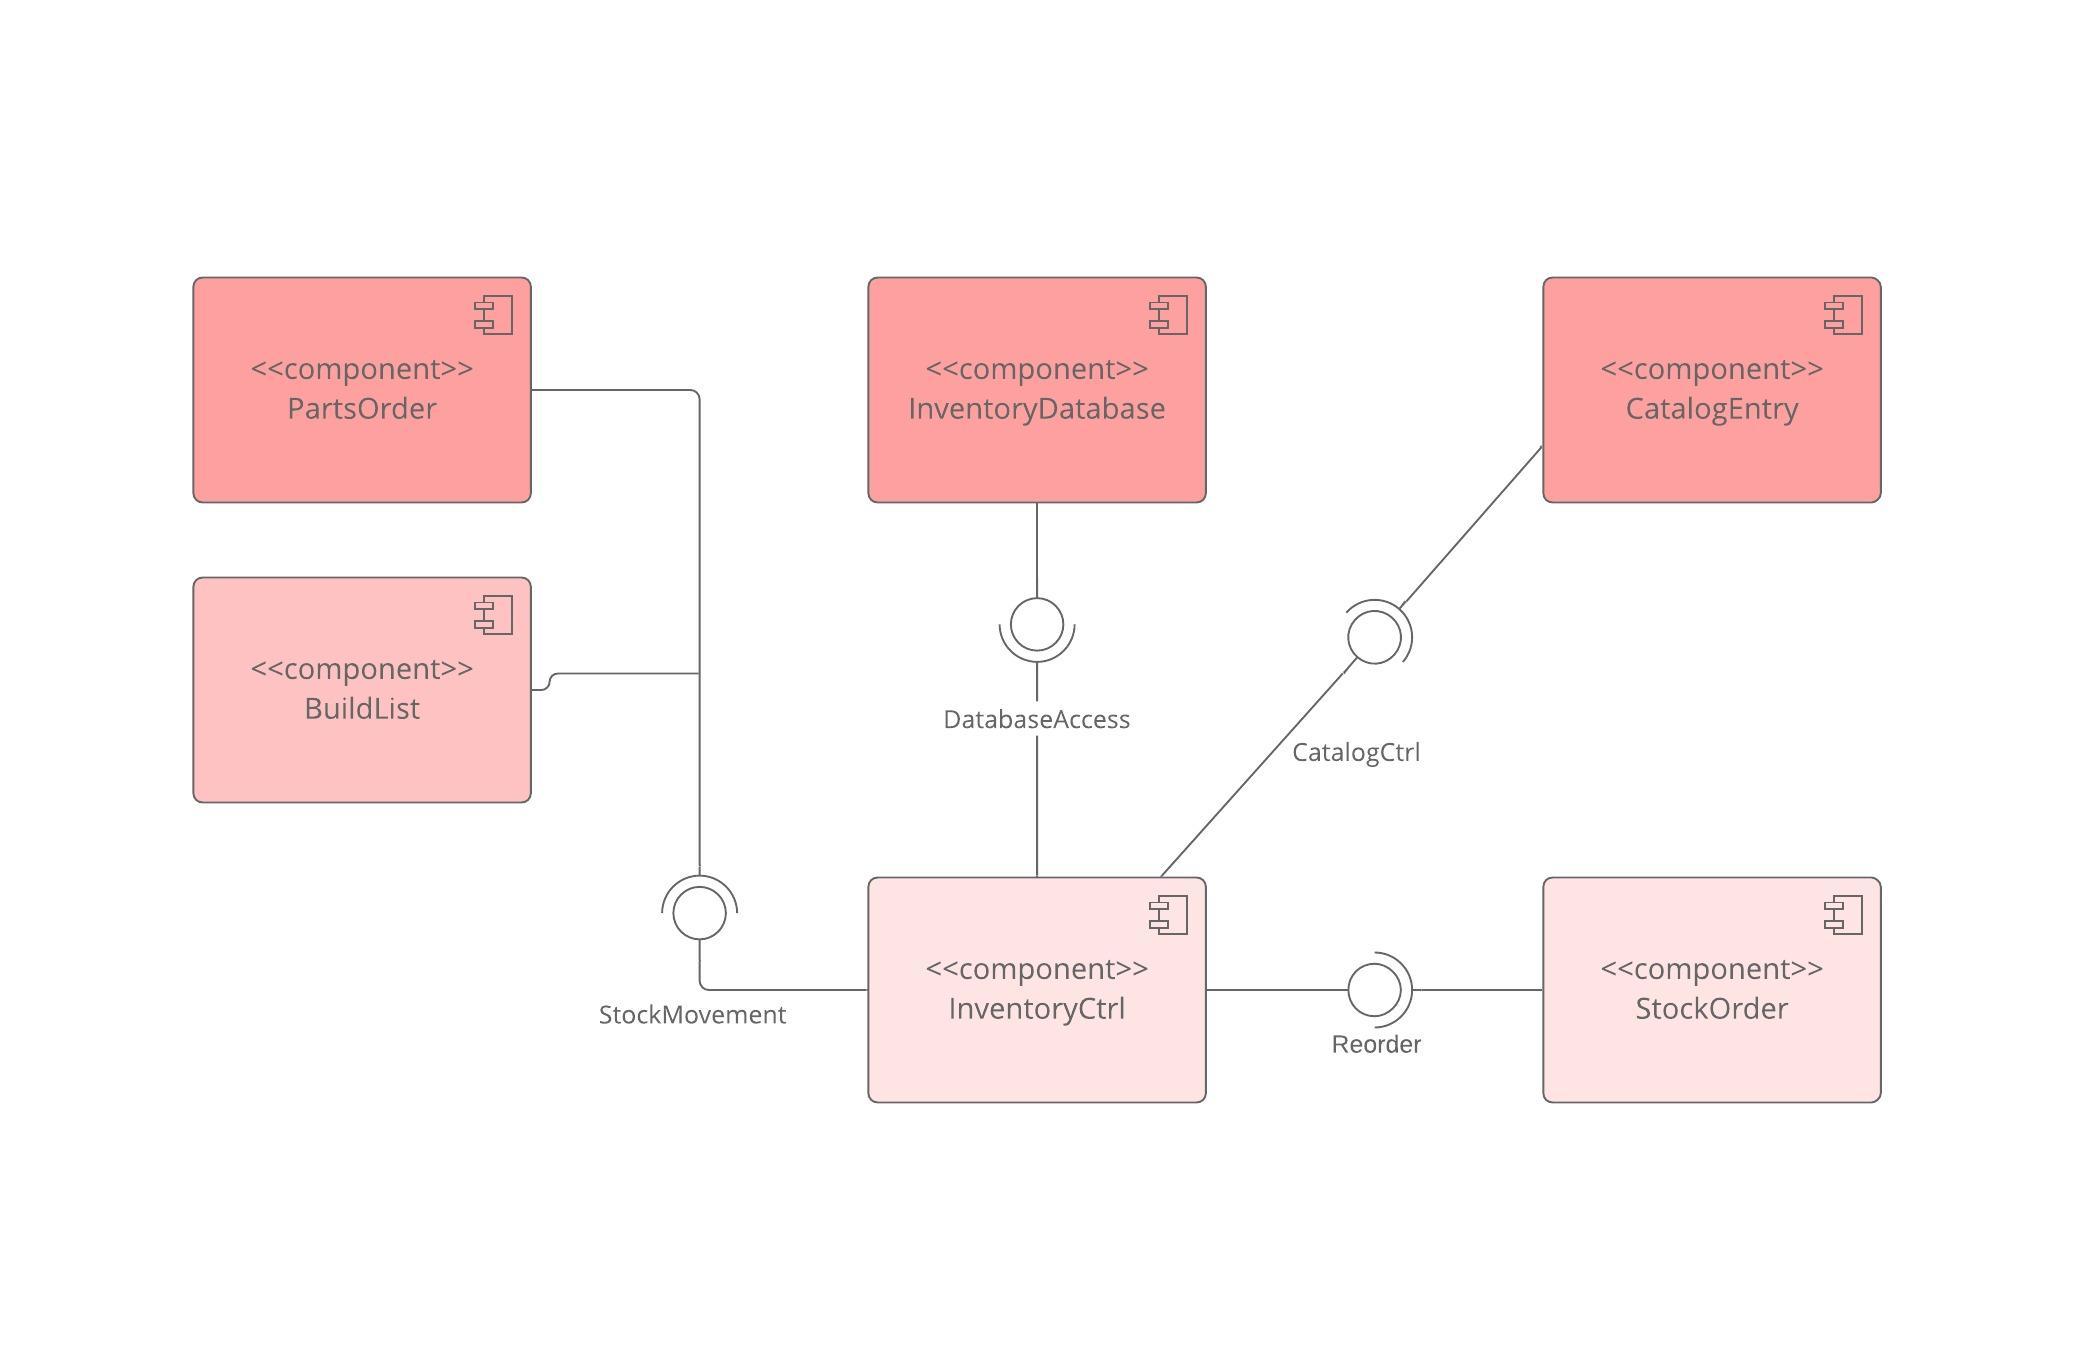
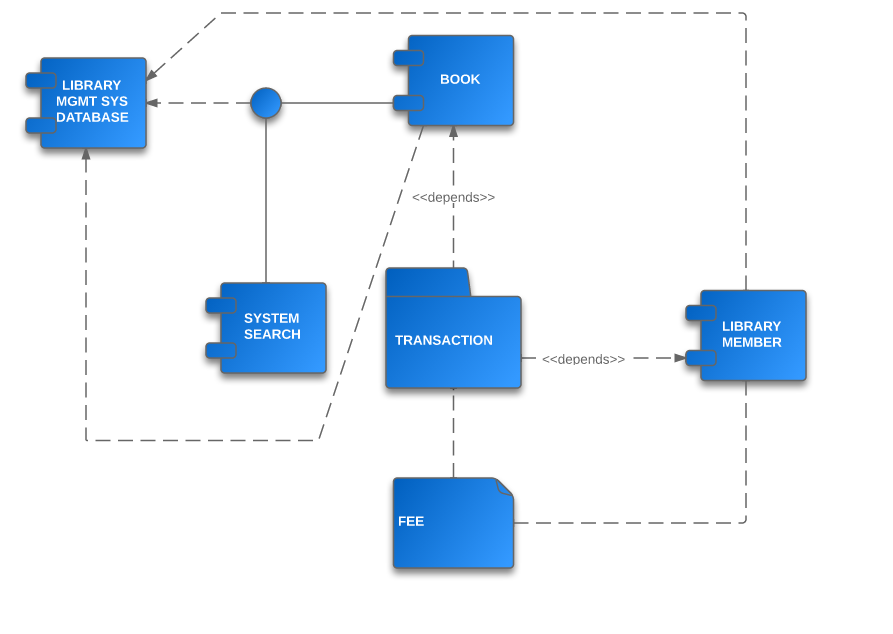
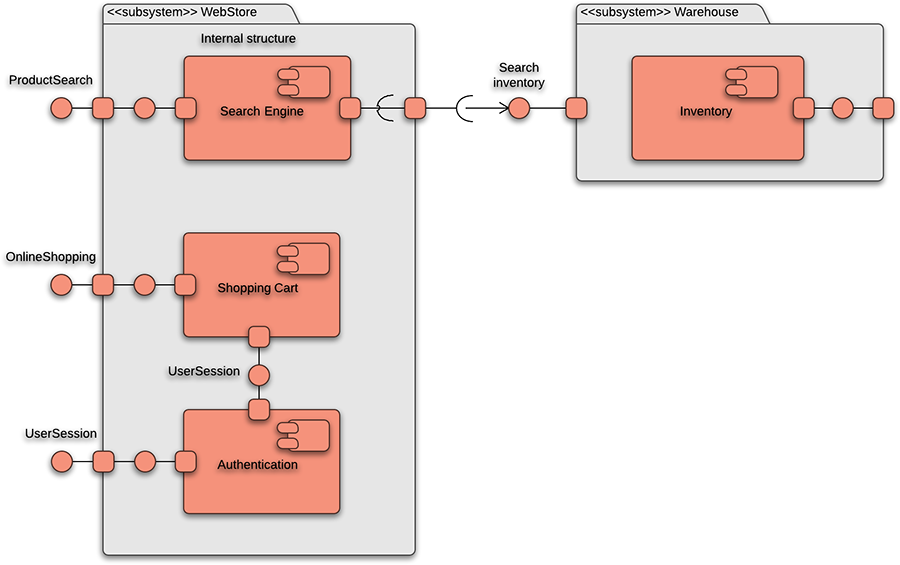
Component diagram template of inventory software
Pricing:
Paid Account
Component diagram template of inventory software, Pricing: Paid Account
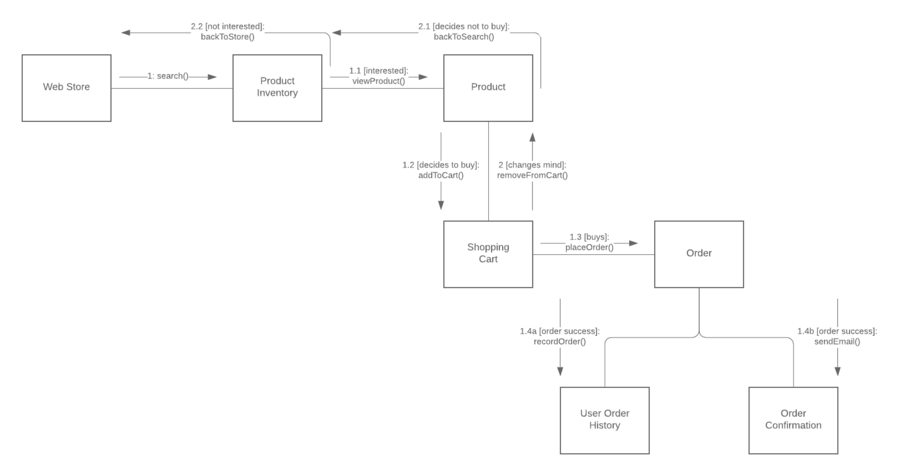
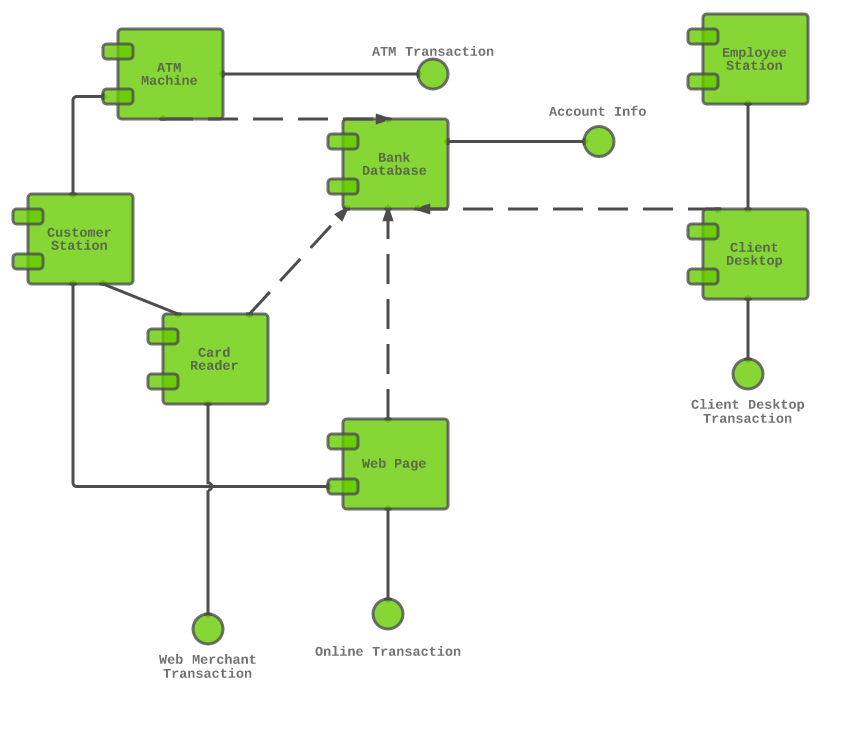
UML interaction overview diagram
Pricing:
Paid Account
UML interaction overview diagram, Pricing: Paid Account
Additional UML resources
UML diagram maker
No matter the type of UML diagram you need to create, Lucidchart can help you get to work on it right away, with detailed shape libraries, hundreds of templates, AI diagram generation, and more.
UML diagram tutorial
Read our comprehensive guide to learn the definition of UML, the 14 types of UML diagrams, and the steps for creating a UML diagram.
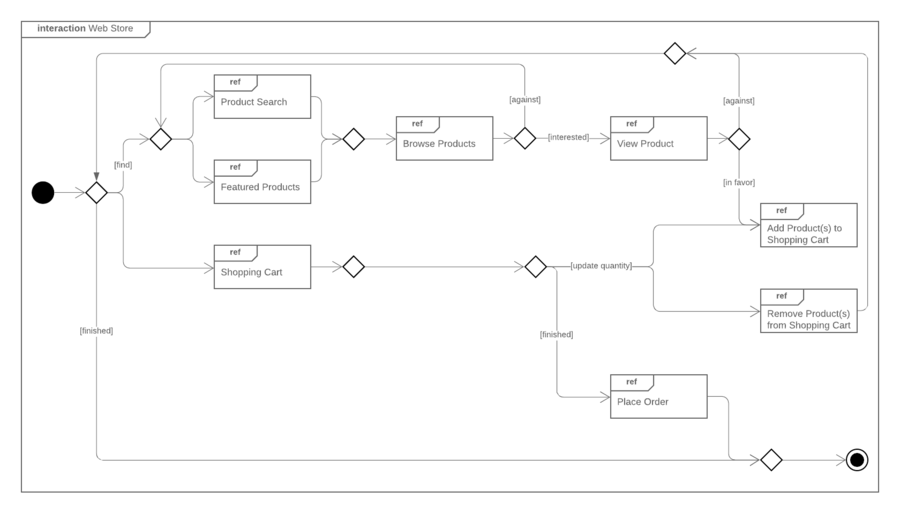
Interaction diagram tutorial
Read to learn the essentials of interaction diagrams, including how they’re used, how they can benefit you, and how to create one.
Frequently asked questions
What is a UML component diagram?
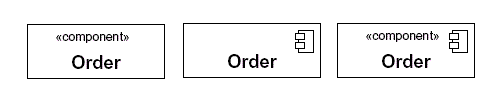
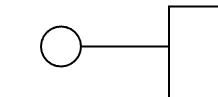
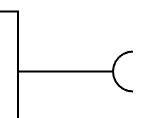
What are the main symbols used in component diagrams?
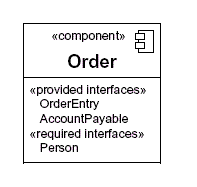
What is the difference between provided and required interfaces?
How do component diagrams help development teams?
Can components be nested inside other components?
What is component-based development (CBD)?
How do I create a component diagram in Lucidchart?
What do ports represent in component diagrams?
Everything you need to make a UML diagram
In addition to our online UML diagram tool, Lucidchart offers support and training resources to help you branch out to any type of diagram.
Make a diagram