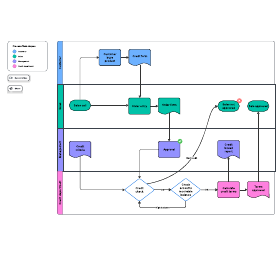
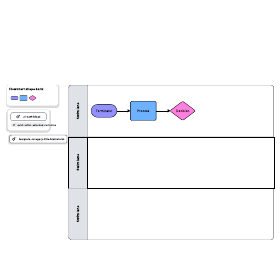
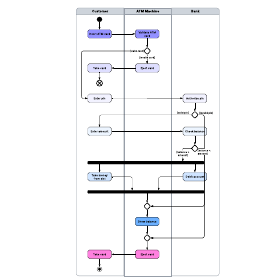
Steps to draw and use a swimlane diagram
- List the participants down the left to create horizontal swimlanes, either drawing by hand or using diagramming software. If you later learn it would be practical to have vertical swimlanes, you can redo them (or rotate them) across the top.
- Use standard symbols to depict the process steps sequentially in their appropriate swimlanes.
- Confirm your diagram with participants in the process and make any necessary adjustments.
- The diagram can now be used to communicate a standardized process for quality and training purposes, to clarify responsibilities and accountabilities, and to reveal inefficiencies and gaps.
- A new diagram can be drawn to model a new process and show new responsibilities, allowing analysts and participants to study the pros and cons and further refine the process.
How to make a swimlane diagram in Lucidchart
Lucidchart lets you create professional-looking Swimlane Diagrams with intuitive, easy-to-use software. To make a swimlane, simply draw a container before you begin drawing your process flow. Label each column in the container with an individual or team that’s involved in the process. Then when you draw the process flow, match each action with the individual or team that performs it. See how easy Lucidchart makes building professional swimlane diagrams by starting a free trial.
Register for a Lucidchart account
First, register for a free Lucidchart account by following this link. Once you have created your account, you will have the option to either start with a blank document or to start with a template. For the sake of this guide we will assume that you are working from a blank document.
Enable containers in the shape library
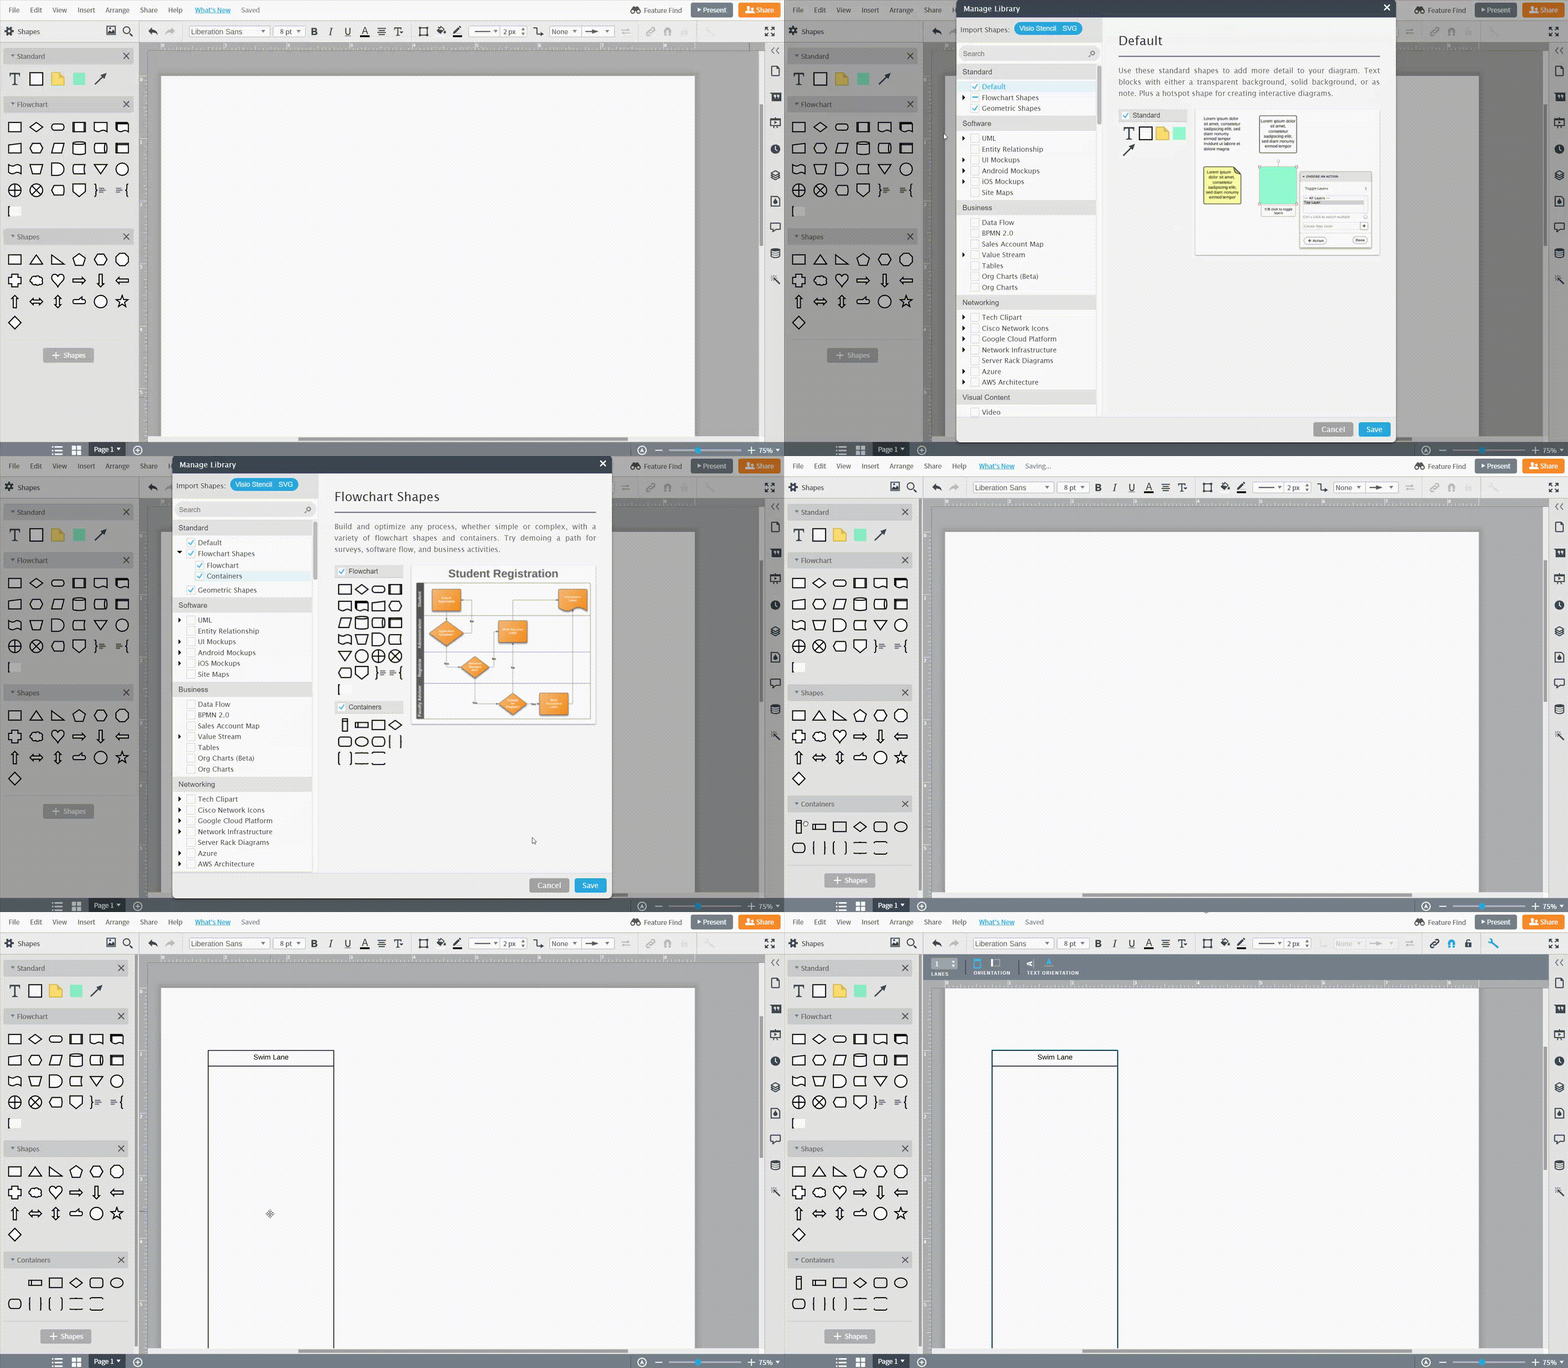
To view all swimlane shapes, click on the “+Shapes” button in a new document, and make sure that both Flowchart Shapes libraries are enabled.
Add and connect shapes
Add a swimlane shape by dragging one onto the canvas, then add more by adjusting the settings that will appear at the top of the canvas while the original swimlane shape is selected. To connect two shapes, hover over a shape and drag out from the red dot that will appear. By connecting the two shapes, you will be able to move the shapes anywhere and they will stay connected.
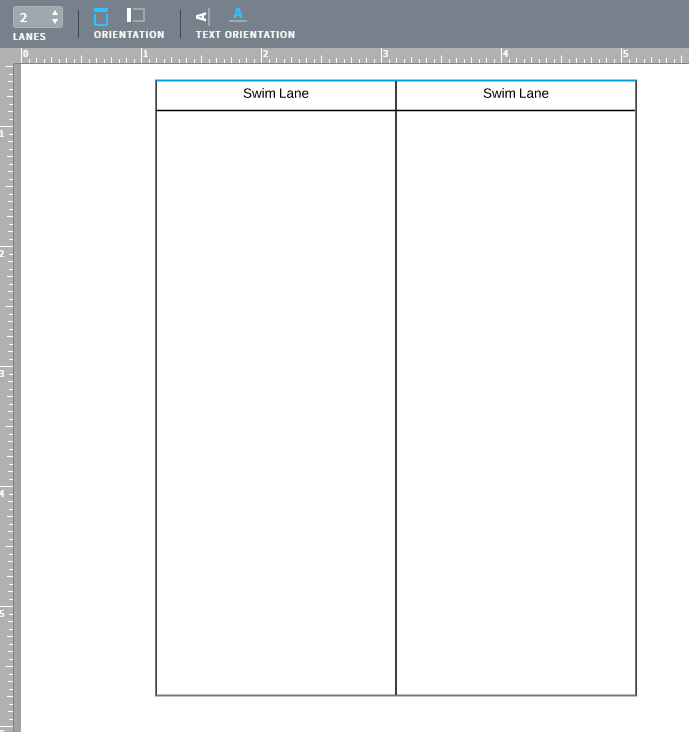
Shapes can easily be added to your document by dragging and dropping them onto the canvas. Edit the text within a shape by double-clicking on it. Go through the same process to change the container titles.

Add colors and styling
Now that you have easily created a swimlane diagram with Lucidchart, we suggest adding color that will help viewers to understand the diagram. Format colors by selecting shapes and changing their color in the top menu.

How to create a swimlane diagram in Word
Follow these simple steps to create a swimlane diagram in Word, and then discover why building a collaborative swimlane diagram in Lucidchart more efficient.
1. Prepare a new document
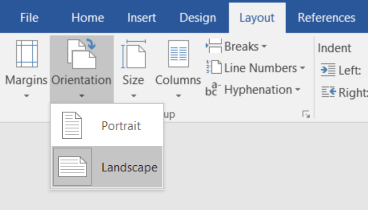
First, open a new Word document. We recommend changing the page orientation to Landscape mode so you have more room to work with.
2. Create swimlanes
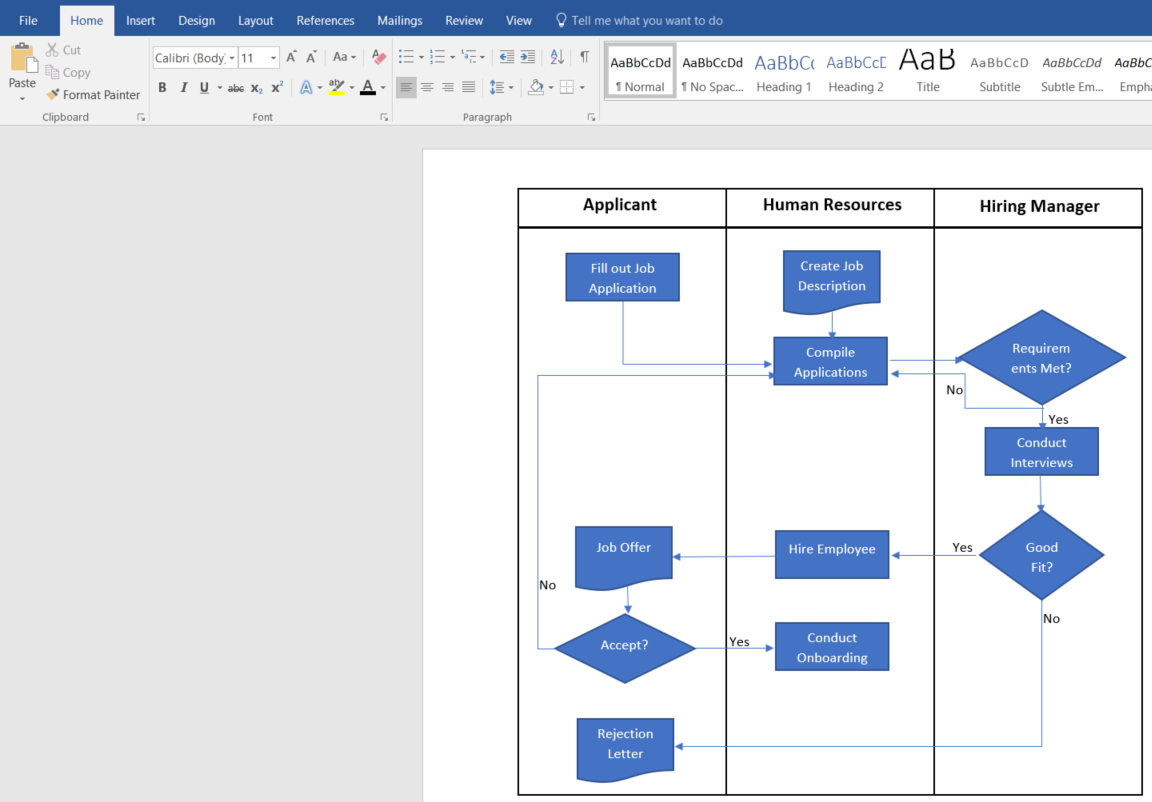
Next, create your swimlanes by going to Insert > Shapes and selecting the Rectangle shape. Place one large rectangle shape on the page that will contain your flowchart, then place another smaller rectangle on top that will be the title of the container.
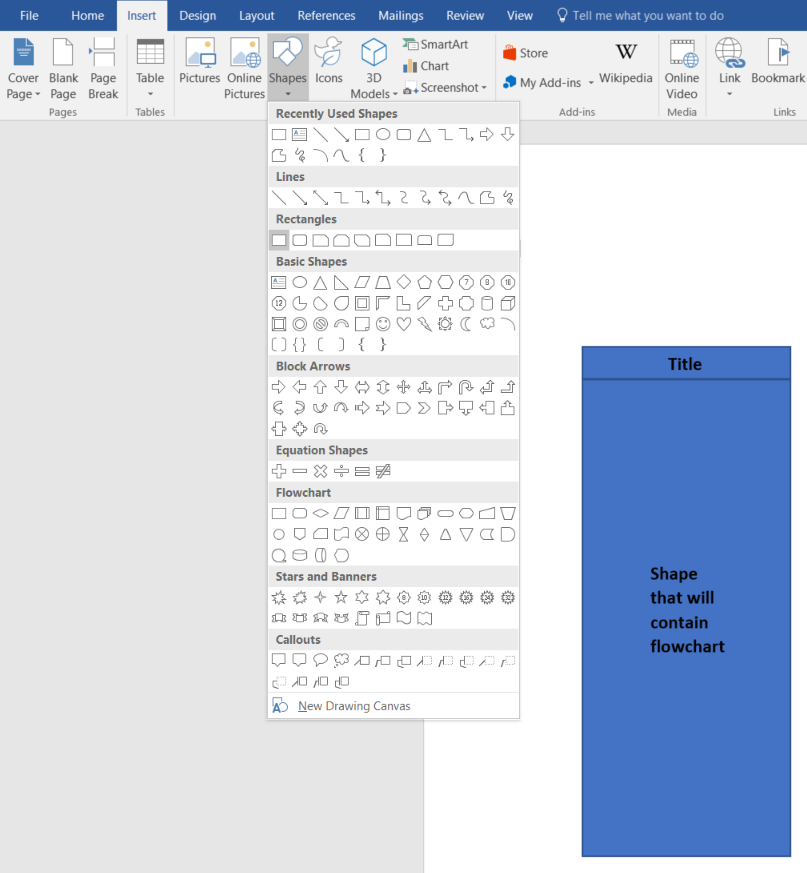
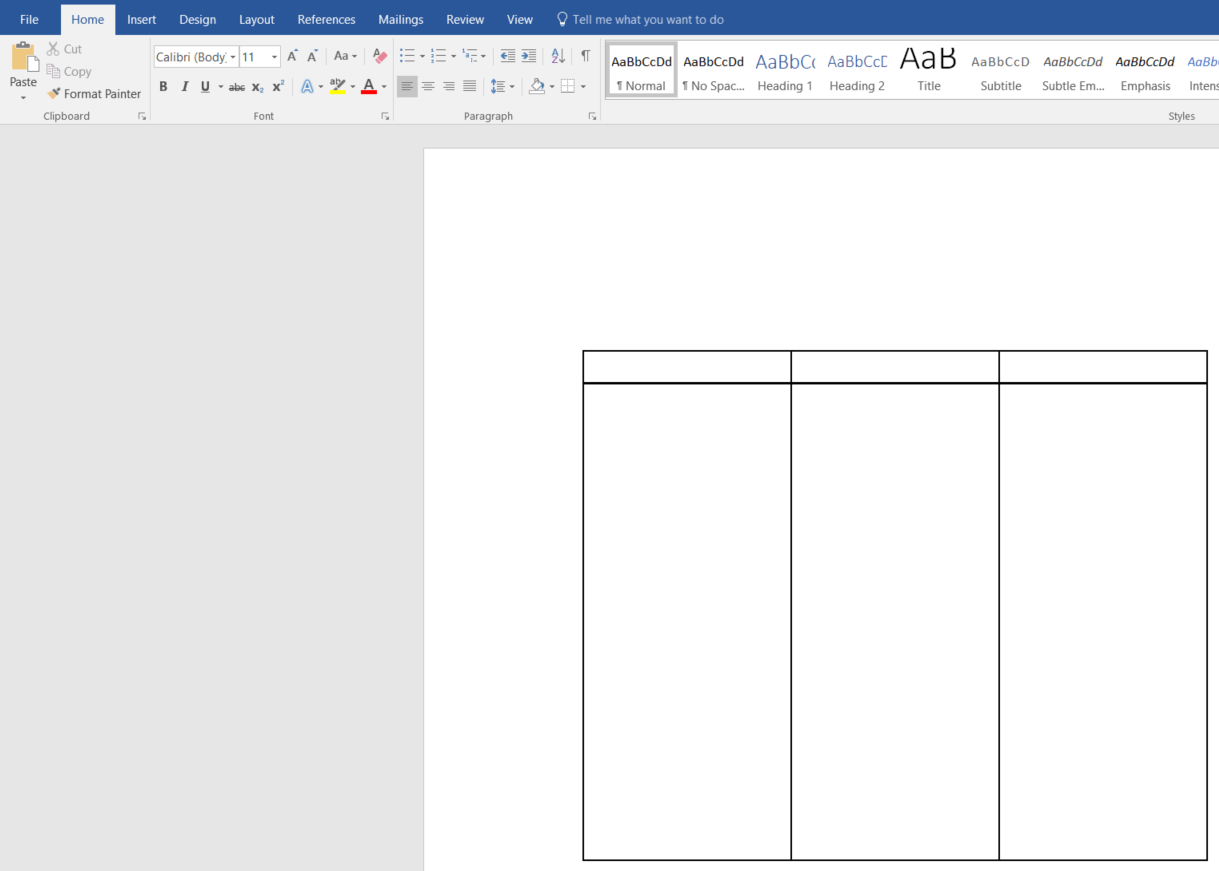
Once you have created your first swimlane, group the two shapes by clicking on both of them, right-clicking, and selecting “Group.” Change the color of the shapes as desired. We went ahead and changed the color of our original swimlane. Now, to add more swimlanes, copy and paste the original shape until you have enough lanes to complete your diagram.
3. Label swimlanes
Label your swimlanes by creating a text box from the Insert tab. Swimlanes typically represent major participants in a process, such as Administration, Human Resources, Sales, or Client. As you start adding text boxes to your document you will begin to see one of the limitations of Word— that it is difficult to organize your shapes to fit the containers perfectly.

4. Build a flowchart
Now that the participants in the process have been determined, you can begin building your flowchart. Add shapes again by going to Insert > Shapes. Use this guide to review how to make a flowchart using the correct shapes. To add text to your flowchart shapes, the easiest way is to right-click on the shape and select “Add Text.”
5. Format shapes
After building your flowchart, make it more visually pleasing by improving the color and style of the shapes. Select each shape and customize the colors, font-styles, and much more.
Insert a Lucidchart diagram into a Word document
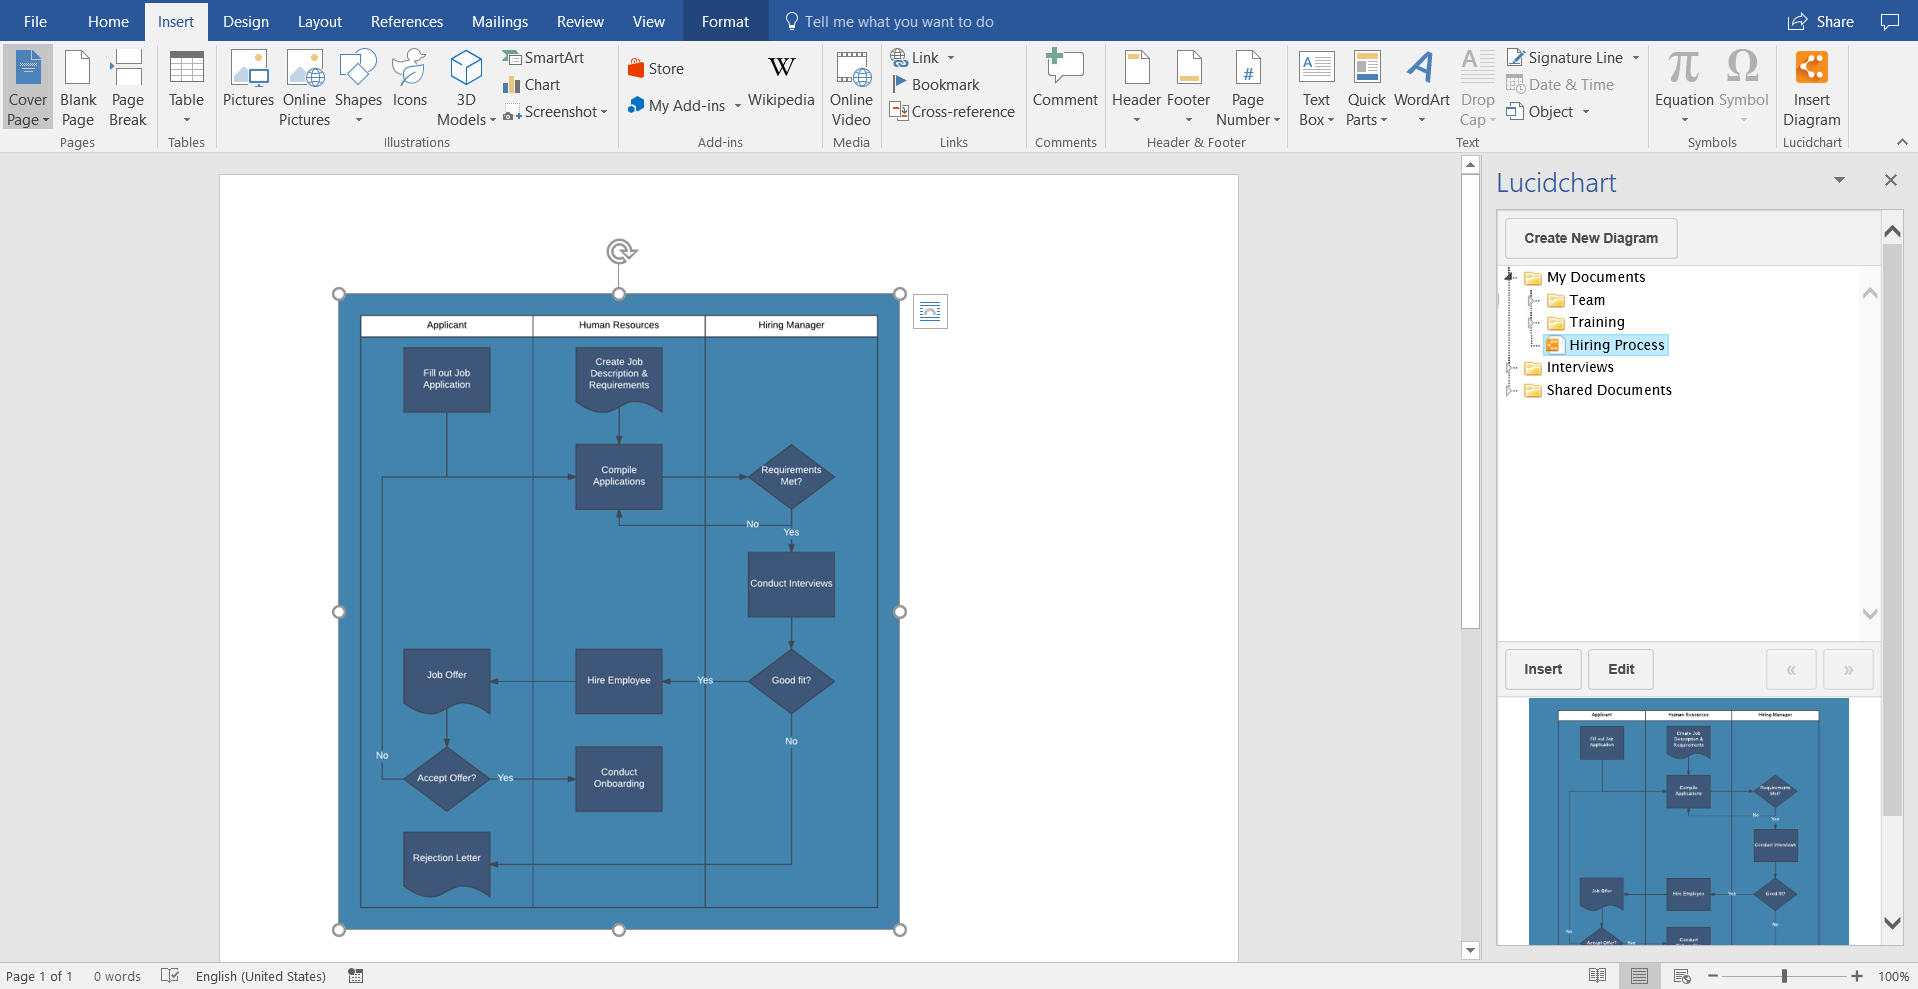
After creating your swimlane diagram in Lucidchart, you can insert your swimlane diagram into any Word document. Inserting your Lucidchart diagram into Word is incredibly easy with our MS Office Word add-in. Here are the steps:
-
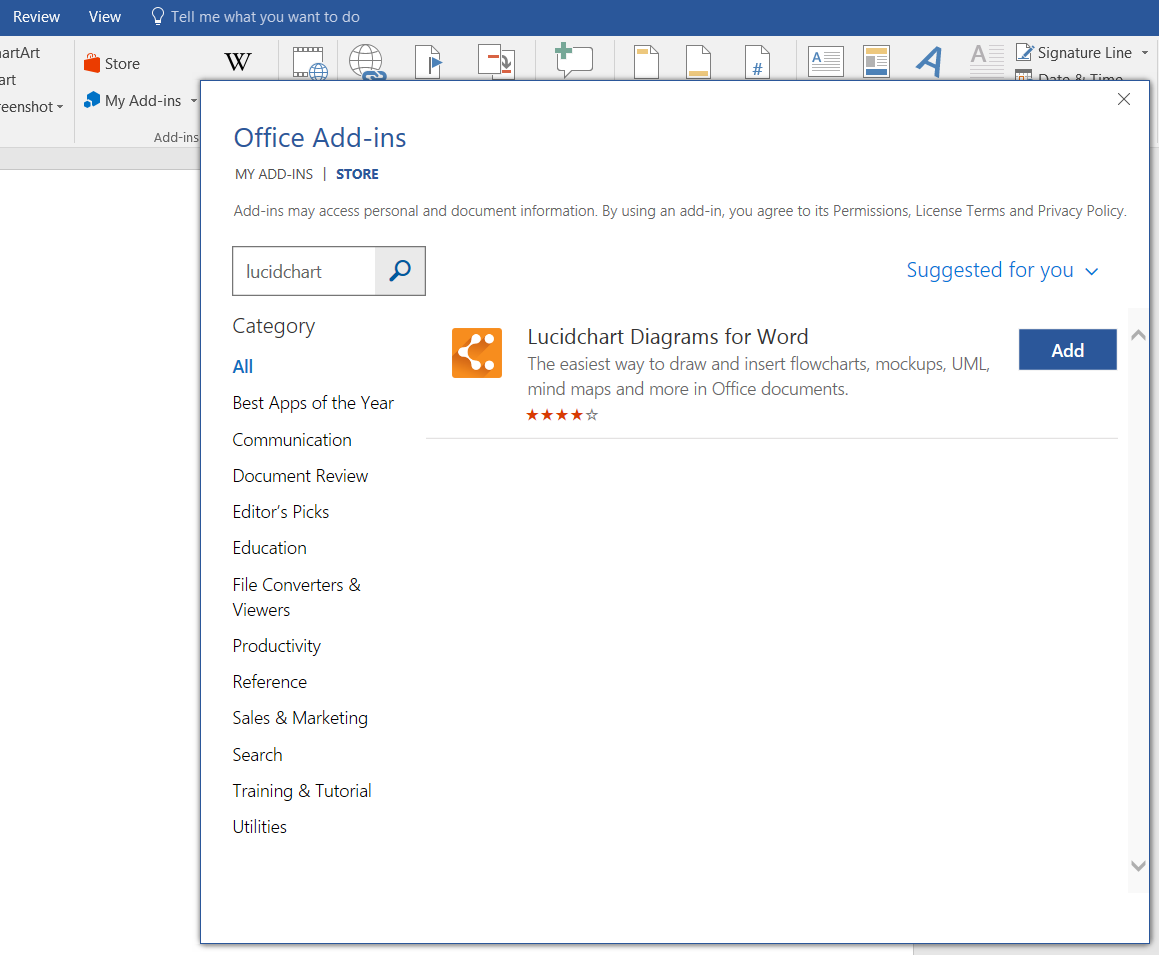
Go to Insert > My Add-ins
-
Search for Lucidchart and install
-
Sign up for a Lucidchart account, if you haven’t already
-
Access Lucidchart within your Add-Ins tab and insert the swimlane diagram that you have already created, or create a new diagram
How to create a swimlane diagram in PowerPoint
Although PowerPoint is a great tool for creating presentations, its diagramming functionality is extremely limited. It is possible to create swimlane diagrams in PowerPoint—as outlined below—but we recommend using Lucidchart. Follow these steps to make a swimlane diagram in PowerPoint, or skip to the next section to learn how to use Lucidchart.
1. Add swimlane containers
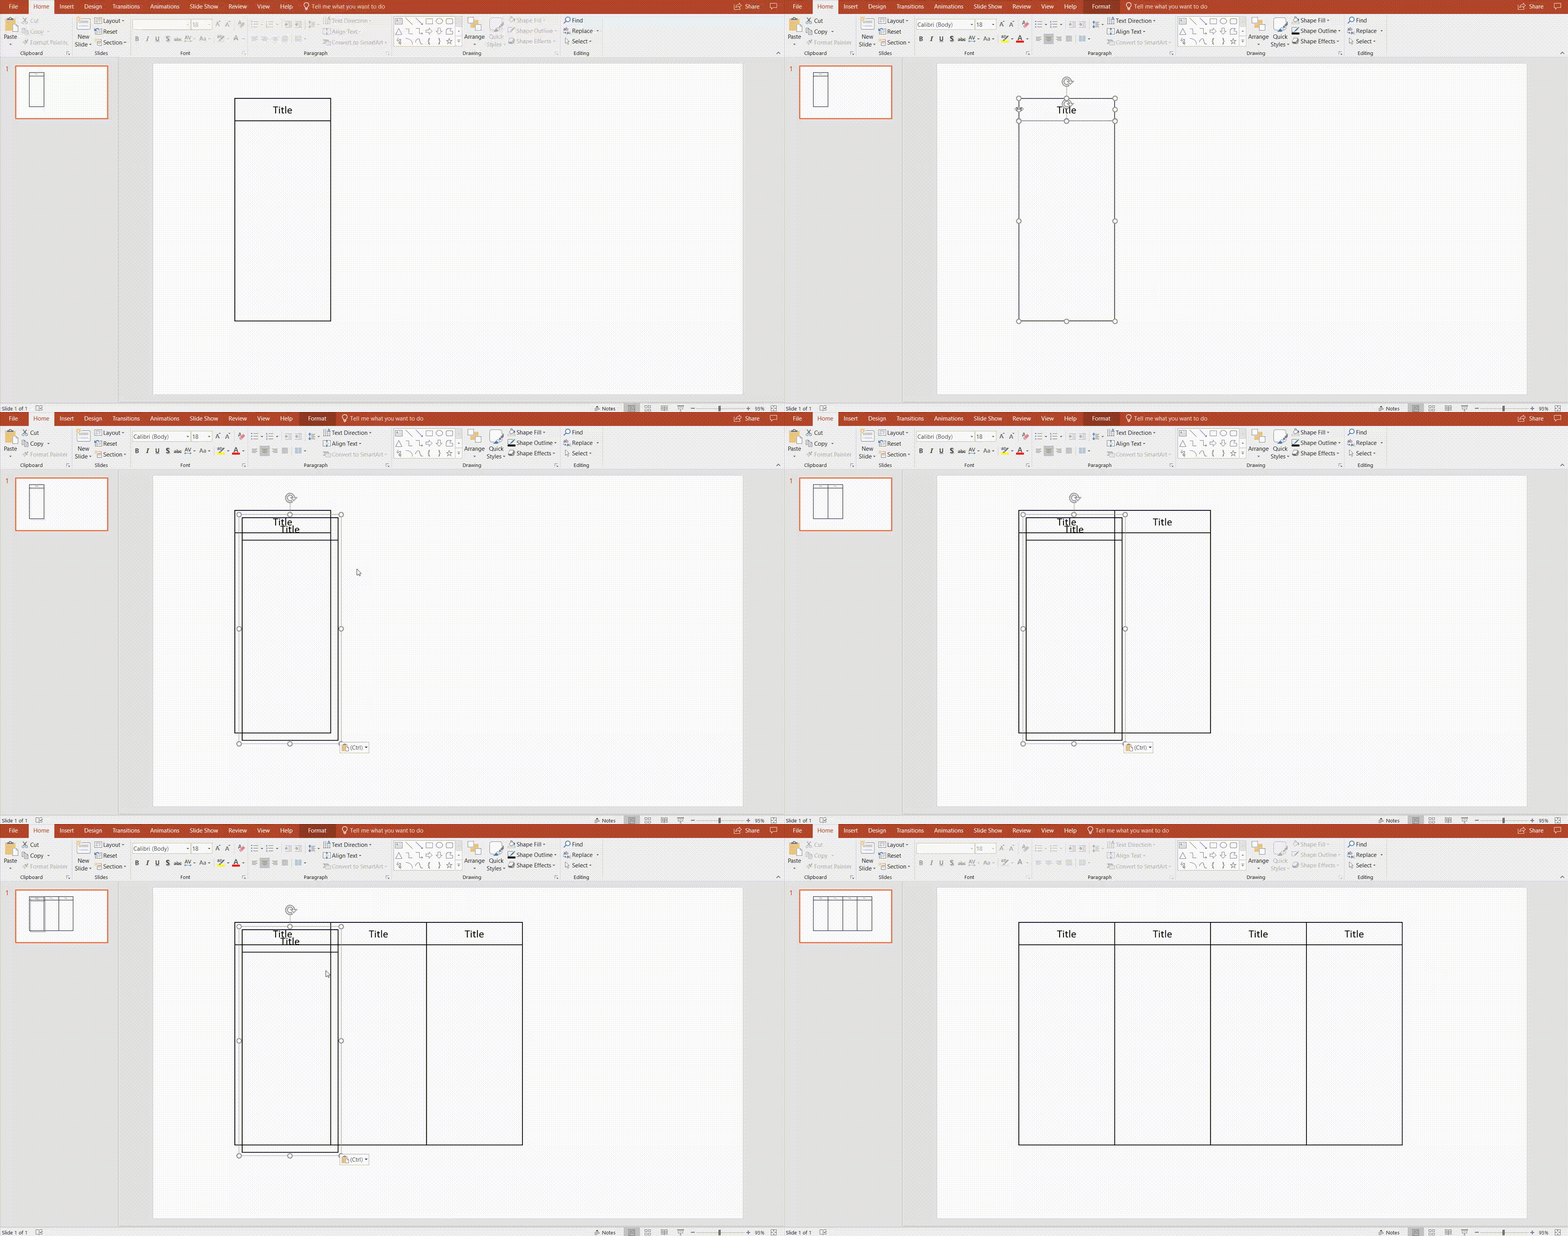
On a blank PowerPoint slide, navigate to the insert tab and click “Shapes.” Add one large rectangle for the body of your swimlane. Then, add another box to the top of the first box to act as the title section of your swimlane.

After building your first swimlane, we recommend grouping the two rectangle shapes (click on both shapes, then right-click and select “Group”). Once they are grouped, you can easily change the colors of the swimlane. We went ahead and made the swimlane background transparent and gave the shapes a black outline. Once they look correct, copy and paste your swimlane as many times as needed.
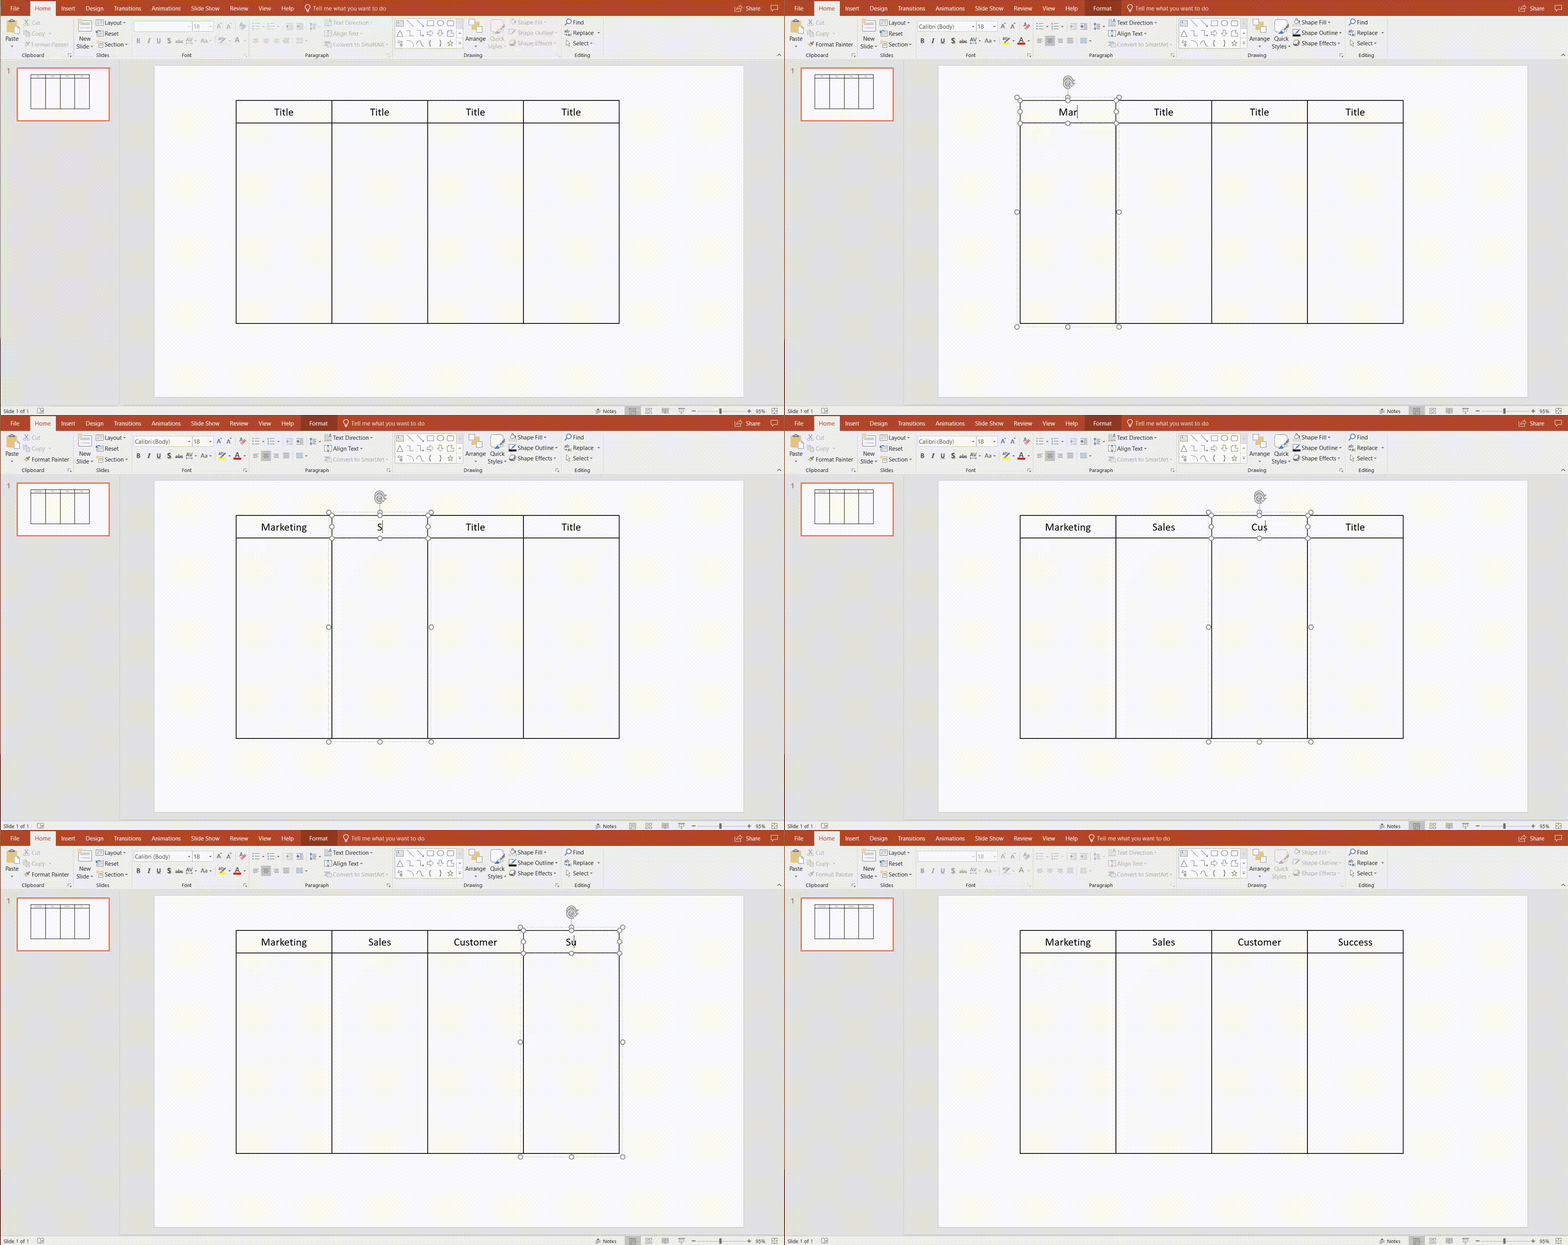
2. Label each swimlane
Swimlanes typically represent distinct departments that contribute to the same process, providing a simple way to delegate tasks. To label your swimlanes, simply add a textbox from the insert tab.
3. Build a flowchart
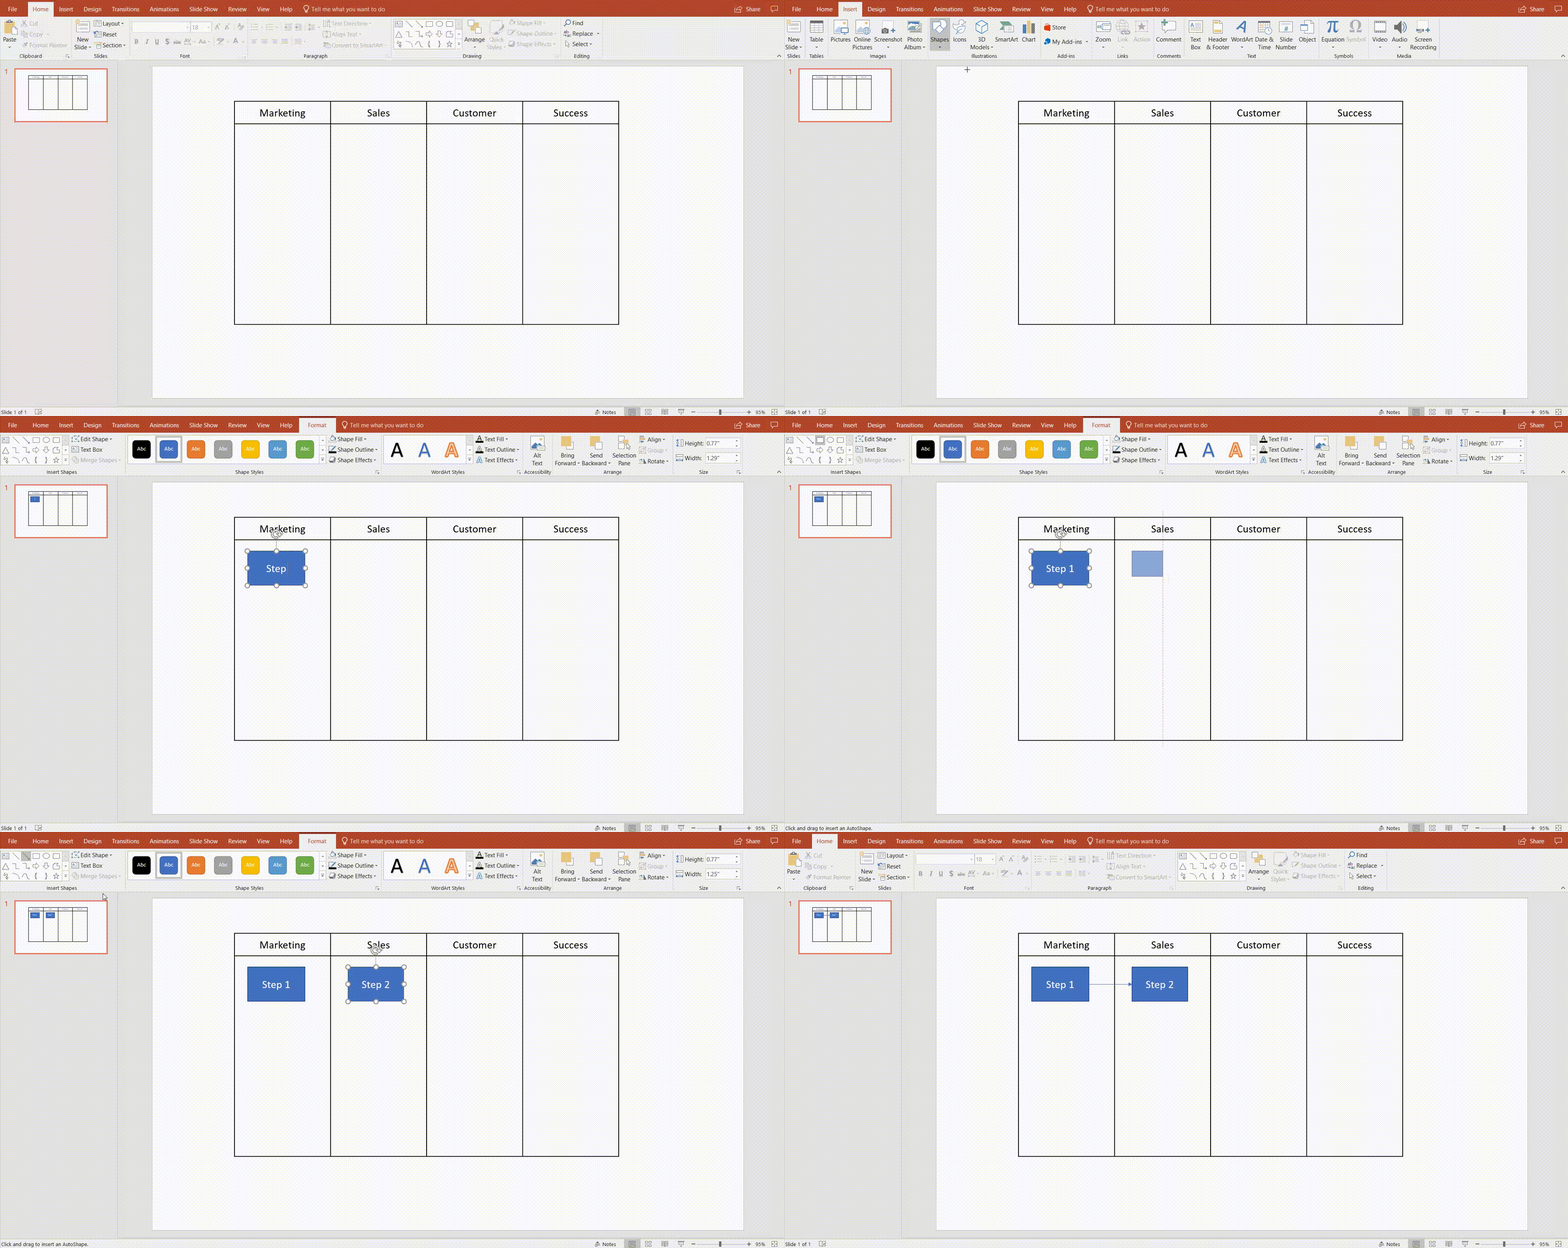
Now that you have created swimlanes, the next step is to add a flowchart. For step-by-step instructions, check out our guide on how to make a flowchart in PowerPoint. All of the shapes and connectors that you’ll need can be found in PowerPoint’s shapes library. Navigate to the insert tab, click “Shapes,” and add shapes as required.
4. Format shapes
To visually organize the content of your swimlane diagrams in PowerPoint, we suggest changing the colors, font, and anything else that will make your diagram more visually appealing. Most stylistic elements can be adjusted using the format shape pane. To access this, simply double-click any shape or line.
As you can see, creating a swimlane diagram in PowerPoint is possible, but not ideal. For a more complete experience, try out Lucidchart—a solution built specifically for diagramming.
Insert a Lucidchart diagram into PowerPoint
After creating your swimlane diagram in Lucidchart, you can insert it directly into your PowerPoint presentation in a matter of minutes! Follow the steps below to learn how.
1. Install the Lucidchart add-in
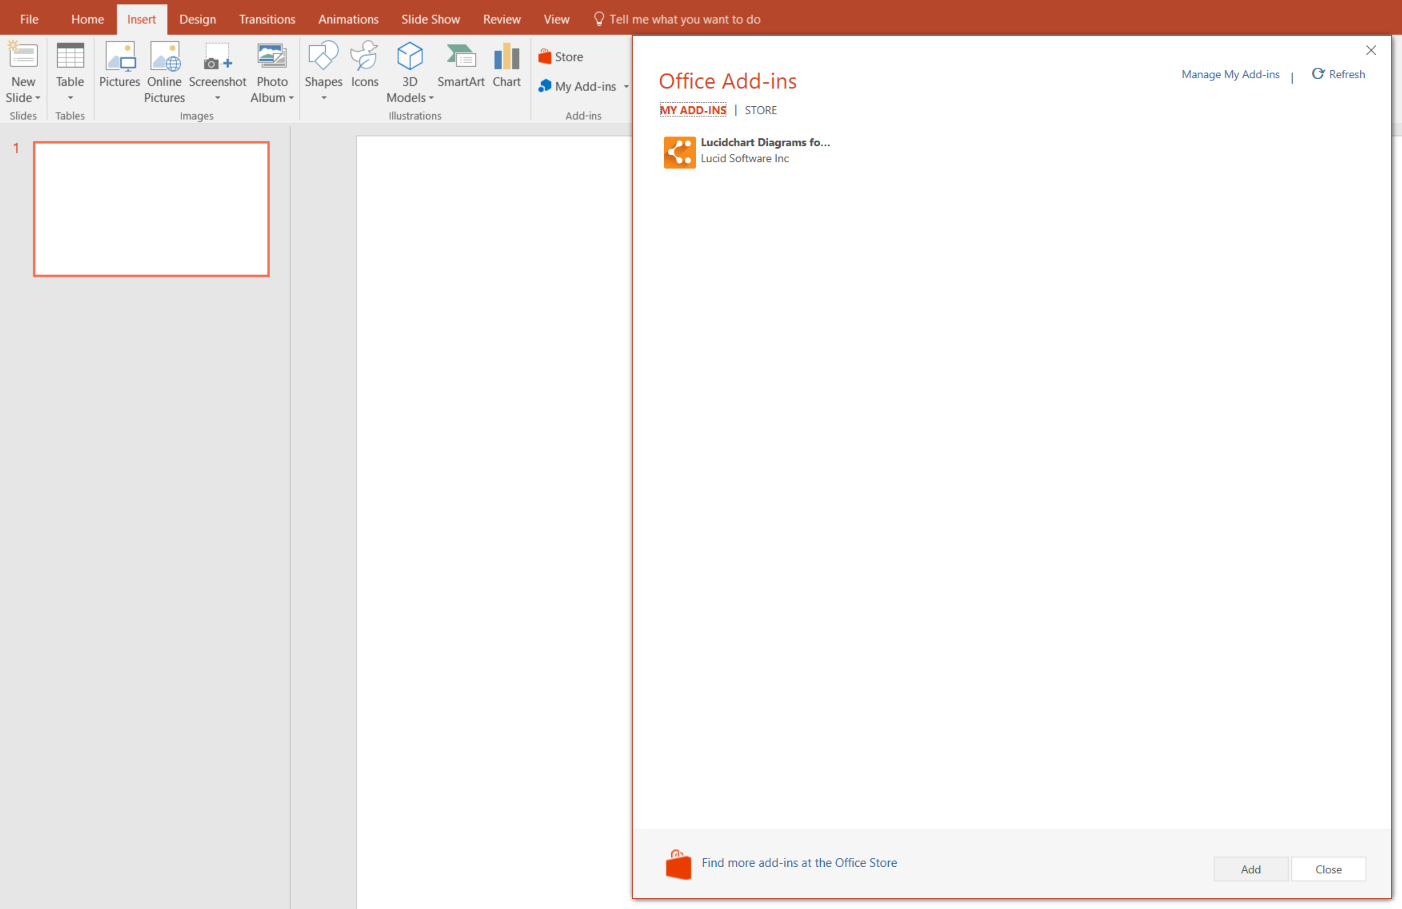
In PowerPoint, navigate to the insert tab and click My Add-ins > Store. Lucidchart should appear as a recommended add-in, but if it doesn’t, you can find it using the search bar. To install it, just click “Add”—it’s completely free.
2. Browse your Lucidchart diagrams
Open the Lucidchart add-in by going to Insert > My Add-ins > Lucidchart. With the Lucidchart add-in open, you can view all of your Lucidchart diagrams. Browse until you find the diagram that you would like to insert.
3. Insert your diagram
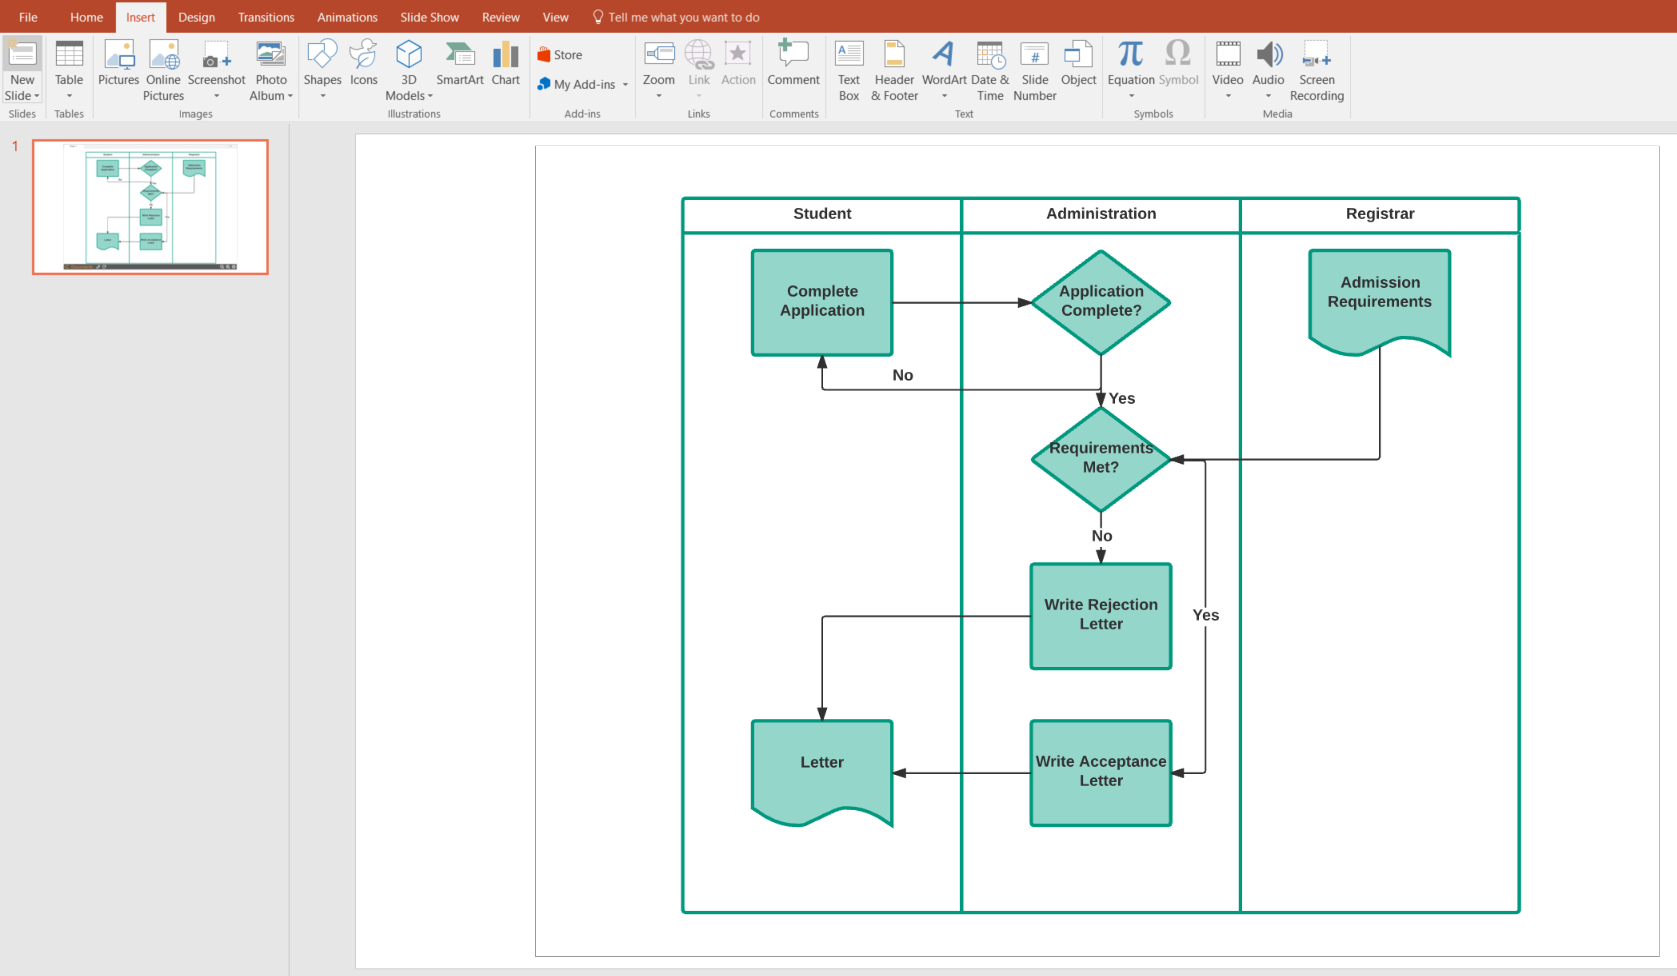
Once you’ve selected a diagram to insert into PowerPoint, simply move your mouse over it and click “Select.” If you edit that diagram in Lucidchart, you can easily apply those changes in PowerPoint—just click the refresh button located below your diagram.
How to make a swimlane diagram in Excel
While it is possible to create a swimlane diagram in Microsoft Excel, it is unintuitive and can cause several problems. To streamline the process, we recommend using Lucidchart, a free and easy diagram maker.
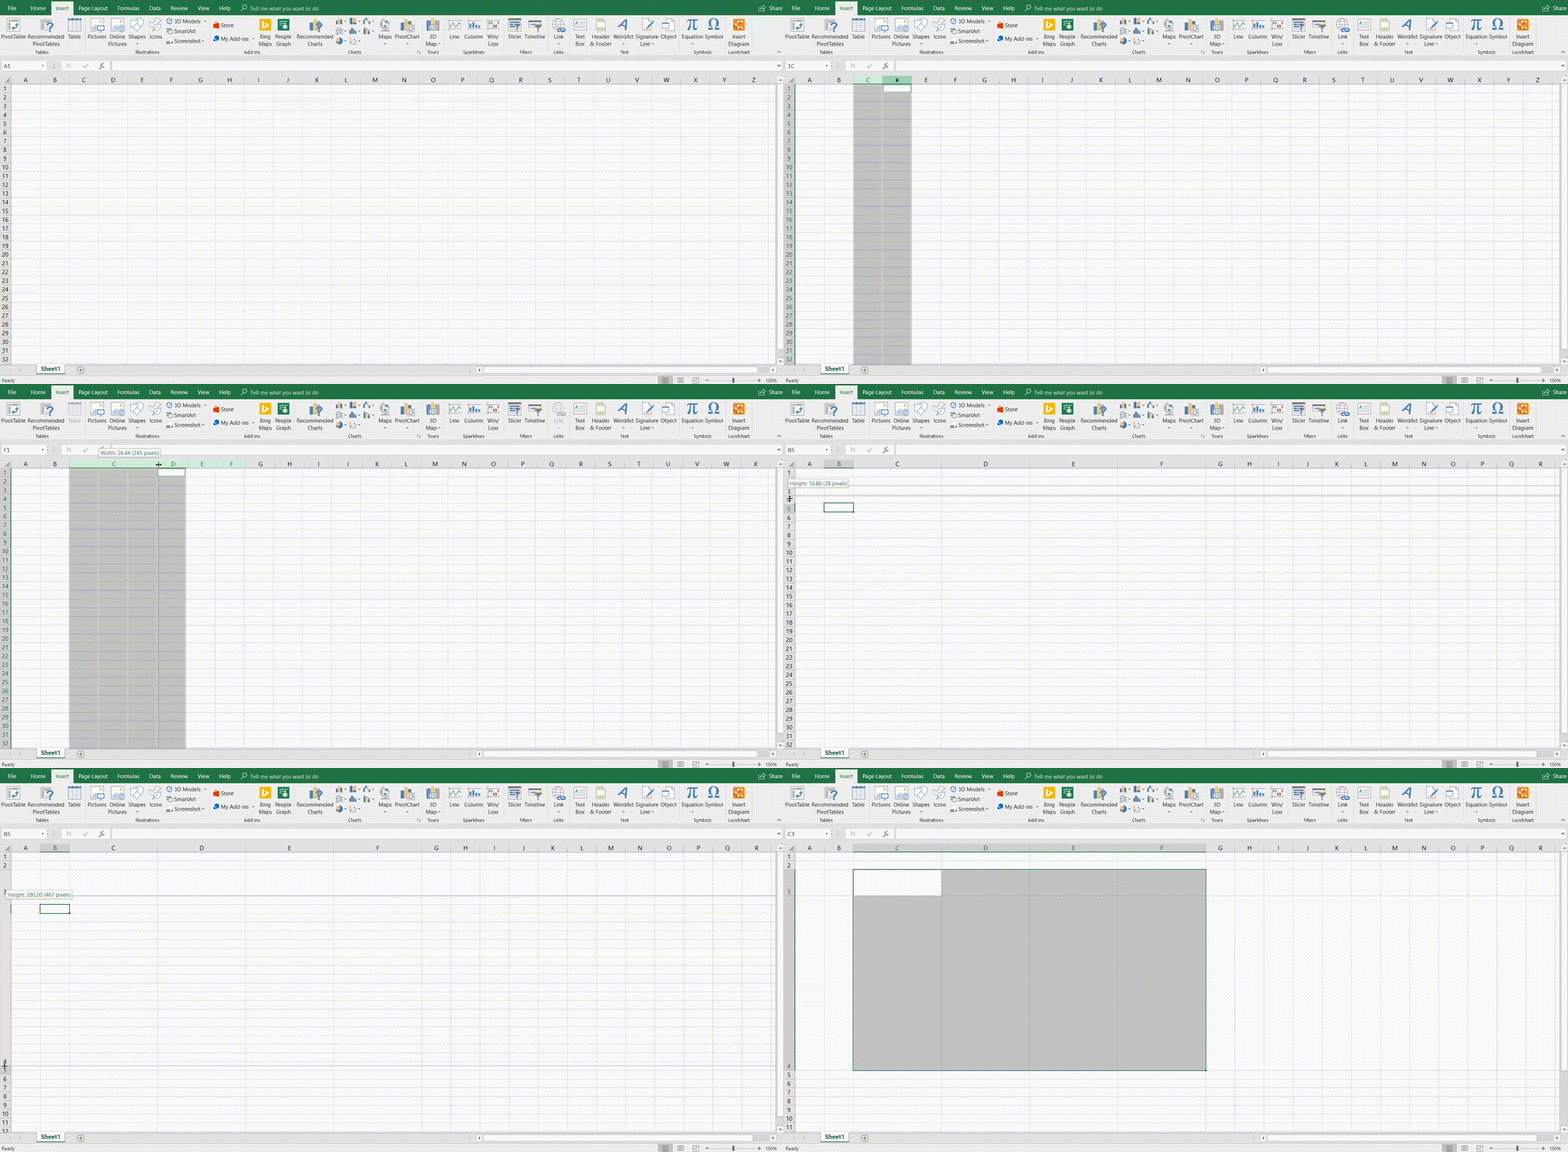
1. Format the height and width of the cells
The first step in creating your swimlane diagram in Excel is to adjust the height and width of the cells in your spreadsheet. For a horizontal swimlane diagram, you can widen your columns by highlighting all of the columns that you will need, and then dragging from the boundary on the right side of the column until the column is at the desired width.
Next, do the same resizing for the rows. If you are making a vertical swimlane diagram (like the diagram shown below), you will use one row for your swimlane title, and one row to contain the rest of your diagram.
2. Label containers
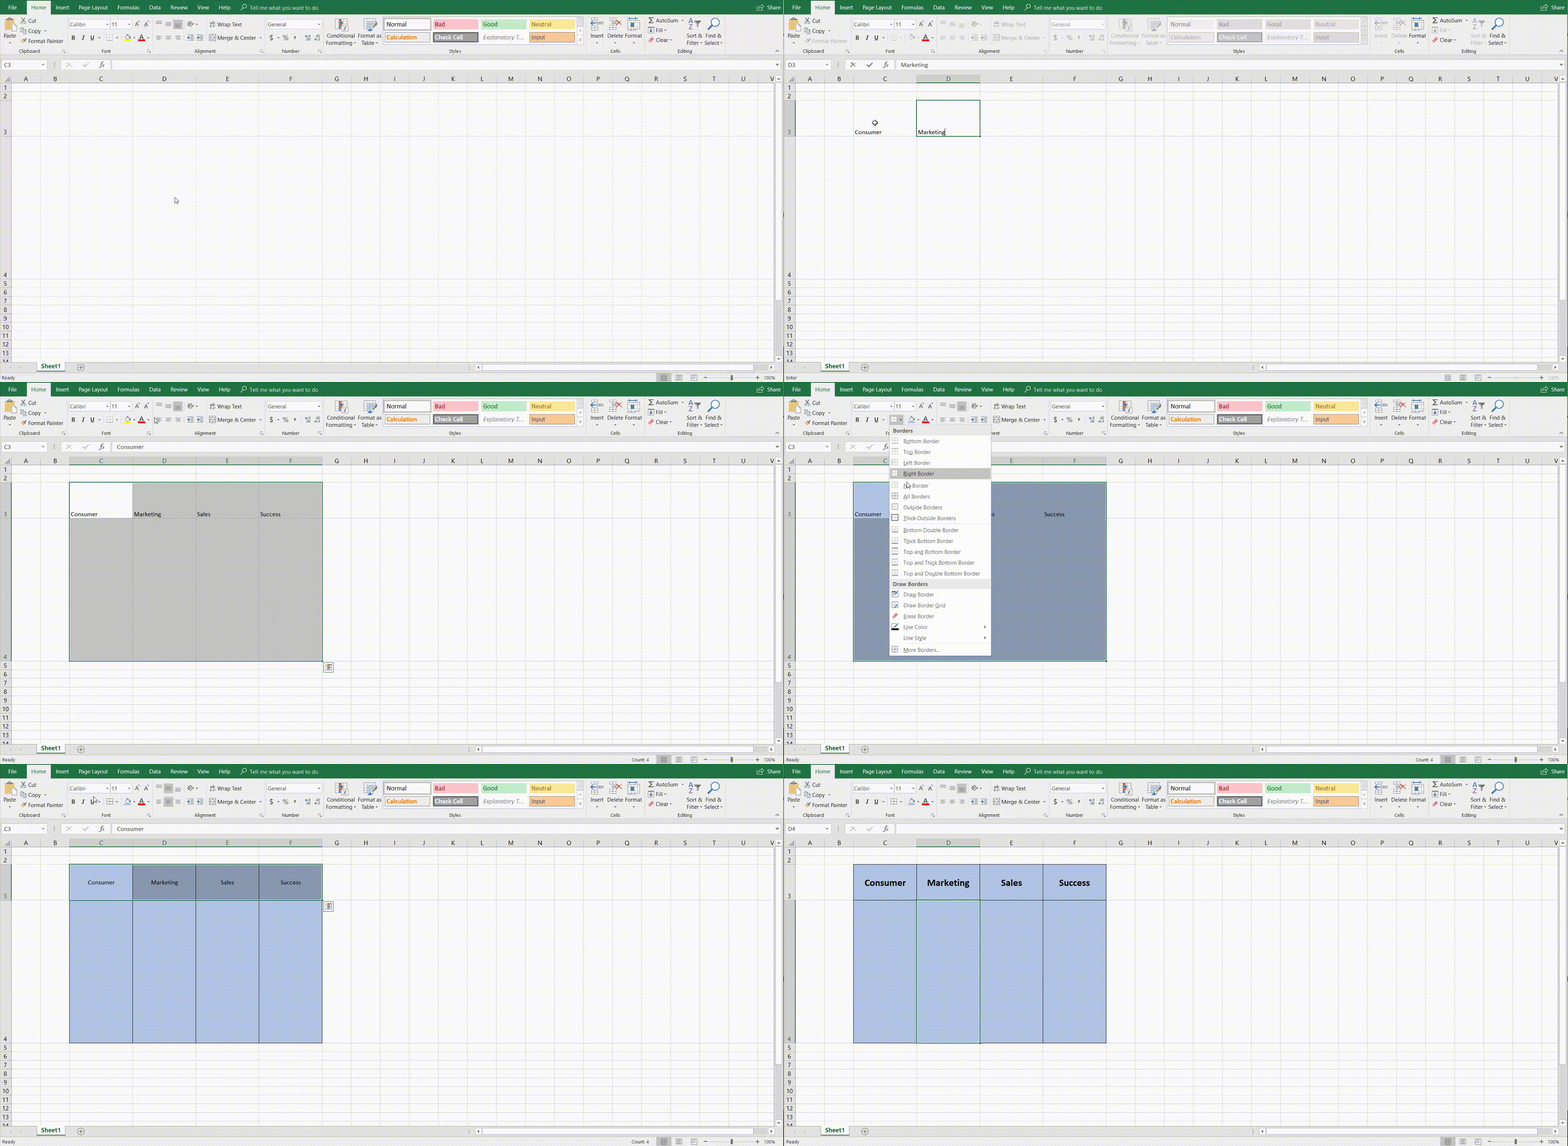
Once you have made the skeleton of your swimlane diagram in Excel, label your containers. Containers will typically represent participants in a process. To aid in visualization, we recommend including colors in your swimlane diagram.
3. Build a flowchart
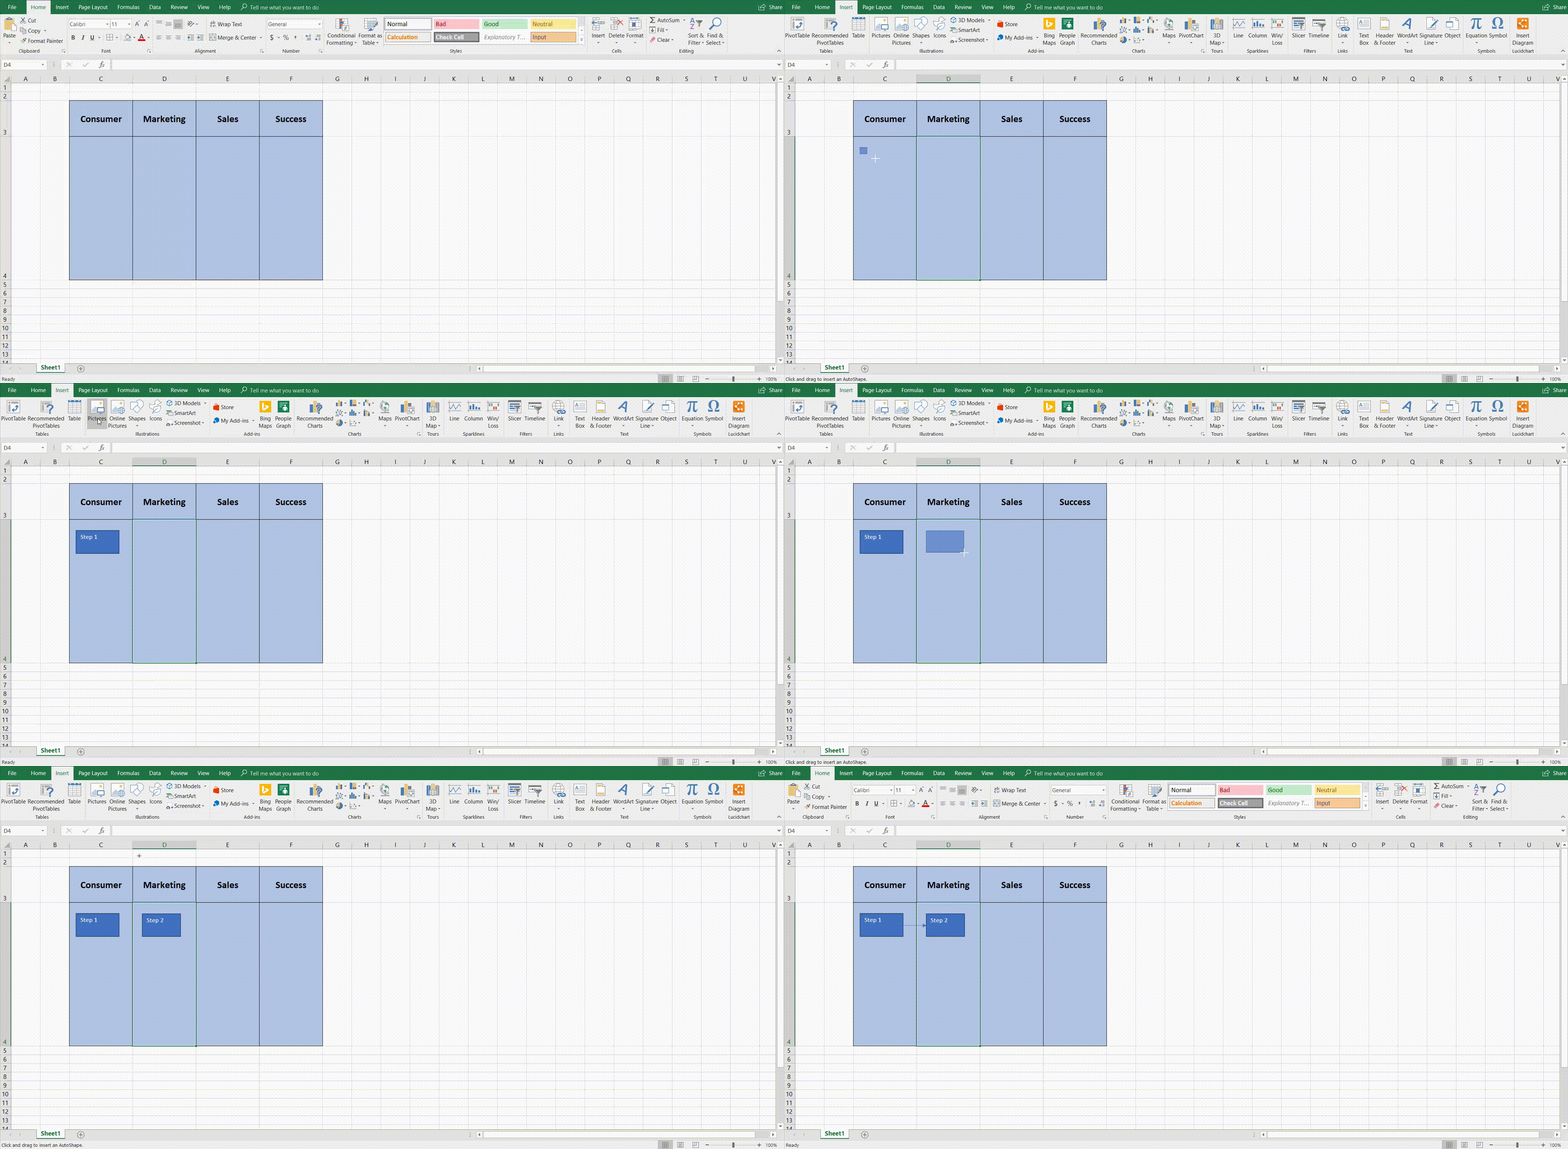
Before you build your flowchart, check out this guide to learn how to build your flowchart correctly. Once you have mapped out your process the way you want it, you can add shapes to your swimlane diagram in Excel by going into the Insert tab,and insert the appropriate shapes into their proper containers.
This process can be very tedious with Excel, as it is difficult to format the shapes and to create consistent styles. That is why we suggest using Lucidchart, a cloud-based diagramming tool that will help you to create stunning swimlane diagrams without the difficulty that Excel includes.
Insert a Lucidchart diagram into an Excel spreadsheet
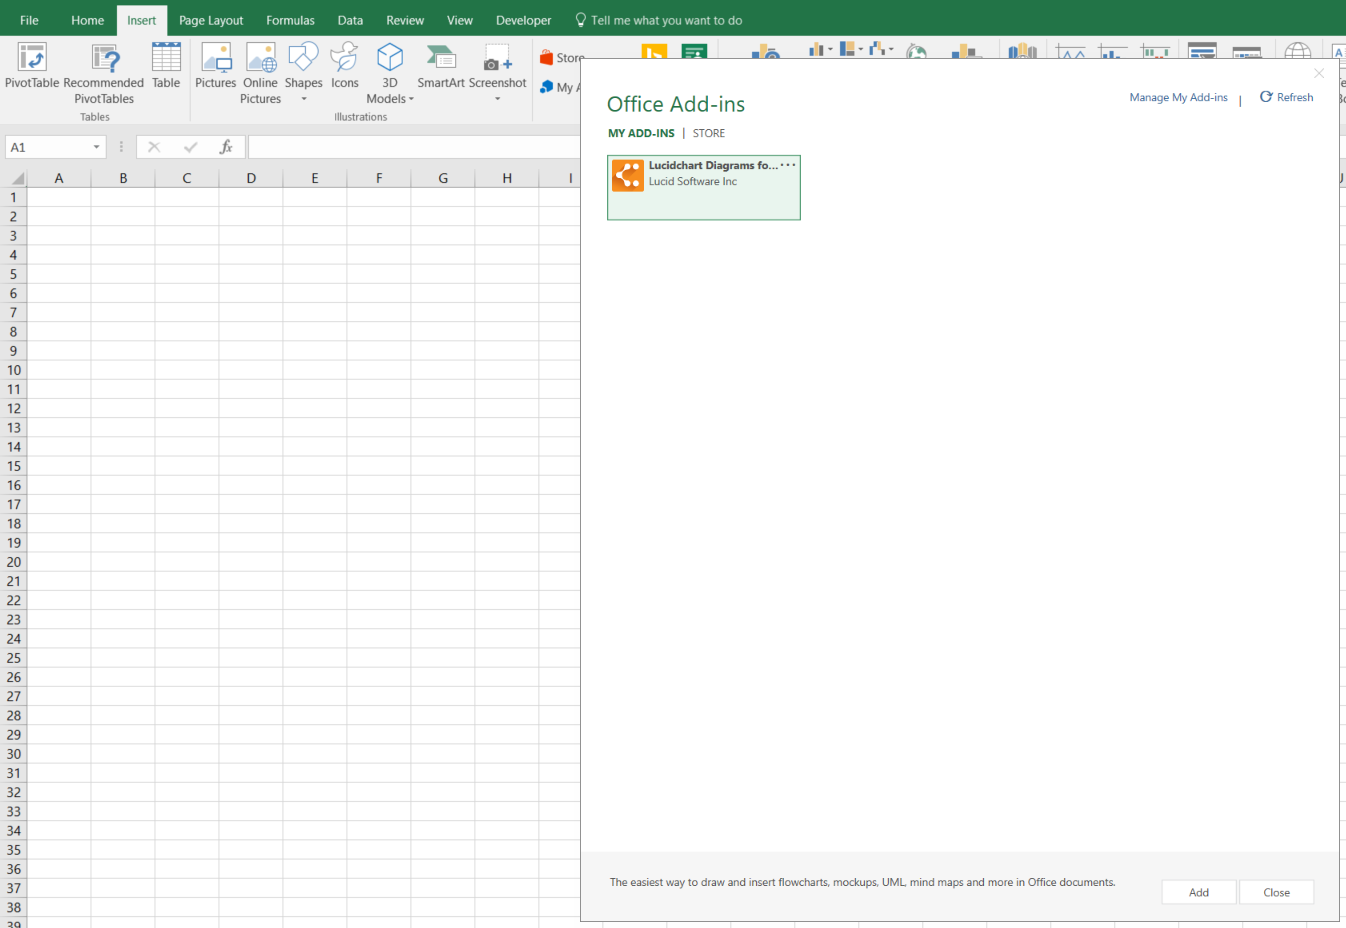
After creating your swimlane diagram in Lucidchart, it is still possible that you will want to insert your document into your Excel Spreadsheet. Inserting your Lucidchart diagram into Excel is incredibly easy with our MS Office Excel add-in. Follow these steps:
- Go to Insert > My Add-ins
-
Search for Lucidchart and install
-
Sign up for a Lucidchart account, if you haven’t already
-
Insert the swimlane diagram that you have already created, or create a new diagram

Everything you need to make a diagram
Make a polished, professional diagram for free with Lucidchart. No matter what you have in mind, we have the tools you need to build it. Make an account and start diagramming today.
Sign up free