Integrate your flowchart with your favorite apps
Integrate Lucidchart with your most-used apps, from Google to Atlassian, AWS, and more. It's easy to publish and embed your final flowchart or diagram to any of these applications for seamless collaboration and alignment.
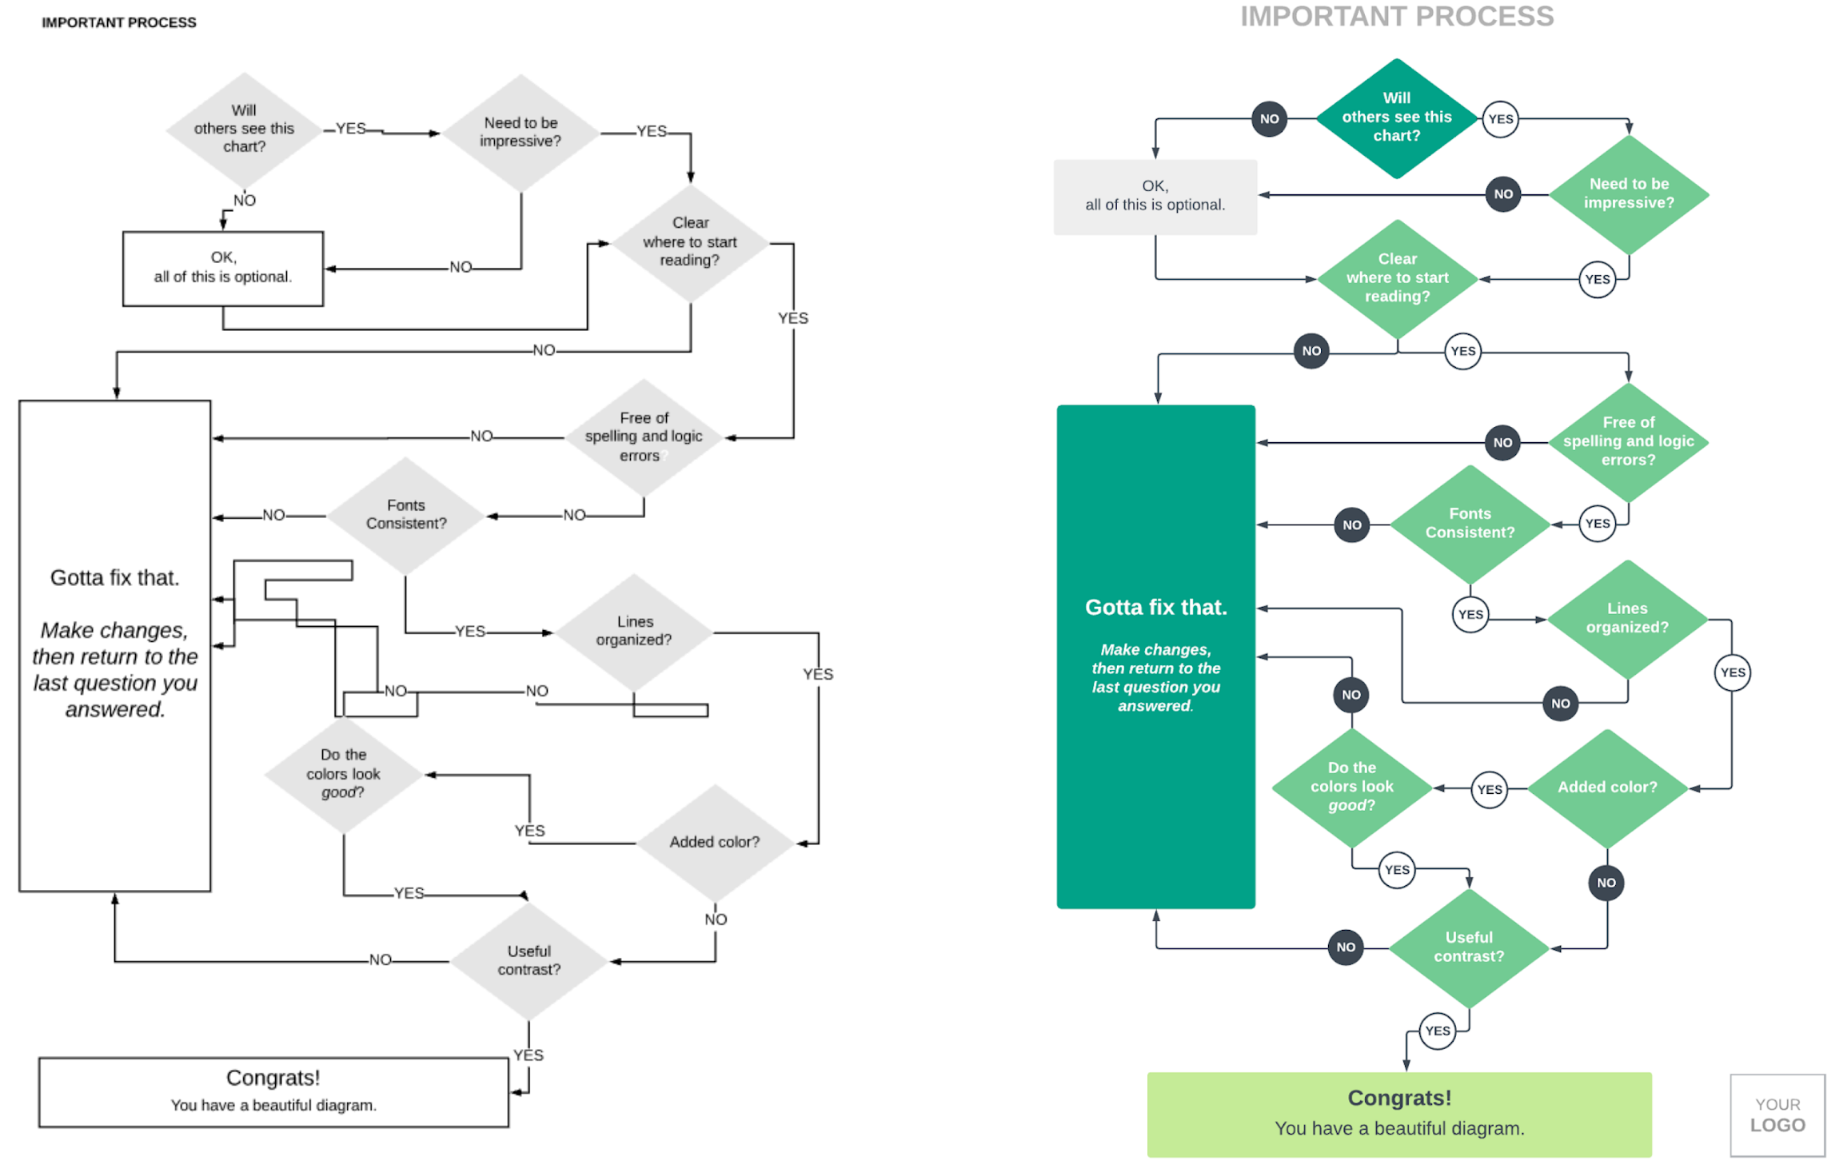
You can create impressive flowcharts to present to your teams or audience quickly and easily with Lucidchart. Don't wait—make a flowchart and share your processes and information in a visual manner, and leave a lasting impression today!
History
Flowcharts to document business processes came into use in the 1920s and ‘30s. In 1921, industrial engineers Frank and Lillian Gilbreth introduced the “Flow Process Chart” to the American Society of Mechanical Engineers (ASME). In the early 1930s, industrial engineer Allan H. Morgensen used Gilbreth’s tools to present conferences on making work more efficient to business people at his company. In the 1940s, two Morgensen students, Art Spinanger and Ben S. Graham, spread the methods more widely. Spinanger introduced the work simplification methods to Procter and Gamble. Graham, a director at Standard Register Industrial, adapted flow process charts to information processing. In 1947, ASME adopted a symbol system for Flow Process Charts, derived from the Gilbreths’ original work.
Also in the late ‘40s, Herman Goldstine and John Van Neumann used flowcharts to develop computer programs, and diagramming soon became increasingly popular for computer programs and algorithms of all kinds. Flowcharts are still used for programming today, although pseudocode, a combination of words and coding language meant for human reading, is often used to depict deeper levels of detail and get closer to a final product.
In Japan, Kaoru Ishikawa (1915-1989), a key figure in quality initiatives in manufacturing, named flowcharts as one of the key tools of quality control, along with complementary tools such as the Histogram, Check Sheet and Cause-and-Effect Diagram, now often called the Ishikawa Diagram.
Flowchart symbols
Here are some of the common flowchart symbols. For a more comprehensive list, see our full flowchart symbols page.
| Terminal/Terminator |  |
| Process |  |
| Decision |  |
| Document |  |
| Data, or Input/Output |  |
| Stored Data |  |
| Flow Arrow |  |
| Comment or Annotation |  |
| Predefined process |  |
| On-page connector/reference |  |
| Off-page connector/reference |  |
Flowcharts for computer programming/algorithms
As a visual representation of data flow, flowcharts are useful in writing a program or algorithm and explaining it to others or collaborating with them on it. You can use an algorithm flowchart to spell out the logic behind a program before ever starting to code the automated process. It can help to organize big-picture thinking and provide a guide when it comes time to code. More specifically, flowcharts can:
- Demonstrate the way code is organized.
- Visualize the execution of code within a program.
- Show the structure of a website or application.
- Understand how users navigate a website or program.
Often, programmers may write pseudocode, a combination of natural language and computer language able to be read by people. This may allow greater detail than the flowchart and serve either as a replacement for the flowchart or as a next step to actual code.
Related diagrams used in computer software include:
- Unified Modeling Language (UML): This is a general-purpose language used in software engineering for modeling.
- Nassi-Shneiderman Diagrams: Used for structured computer programming. Named after Isaac Nassi and Ben Shneiderman, who developed it in 1972 at SUNY-Stony Brook. Also called Structograms.
- DRAKON charts: DRAKON is an algorithmic visual programming language used to produce flowcharts.