The PERT formula and when to use it to estimate expected time
There are several variables that can affect task completion, making it difficult to estimate how long a project will take. PERT chart users typically rely on four standard calculations when determining the appropriate length of their projects:
-
Optimistic time (O): The least possible amount of time required to accomplish a task
-
Most likely time (M): An educated estimate of how long a task will take to complete without problems or delays
-
Pessimistic time (P): The maximum amount of time required to accomplish a task
-
Expected time (E): A reasonable estimate of how long a task will take to complete, taking into account possible problems or delays
The basic PERT estimate equation used to determine your expected time is E = (O + 4M + P)/6.
Once you have identified each time estimate, you can plug them into the PERT formula to more effectively calculate a project's duration.
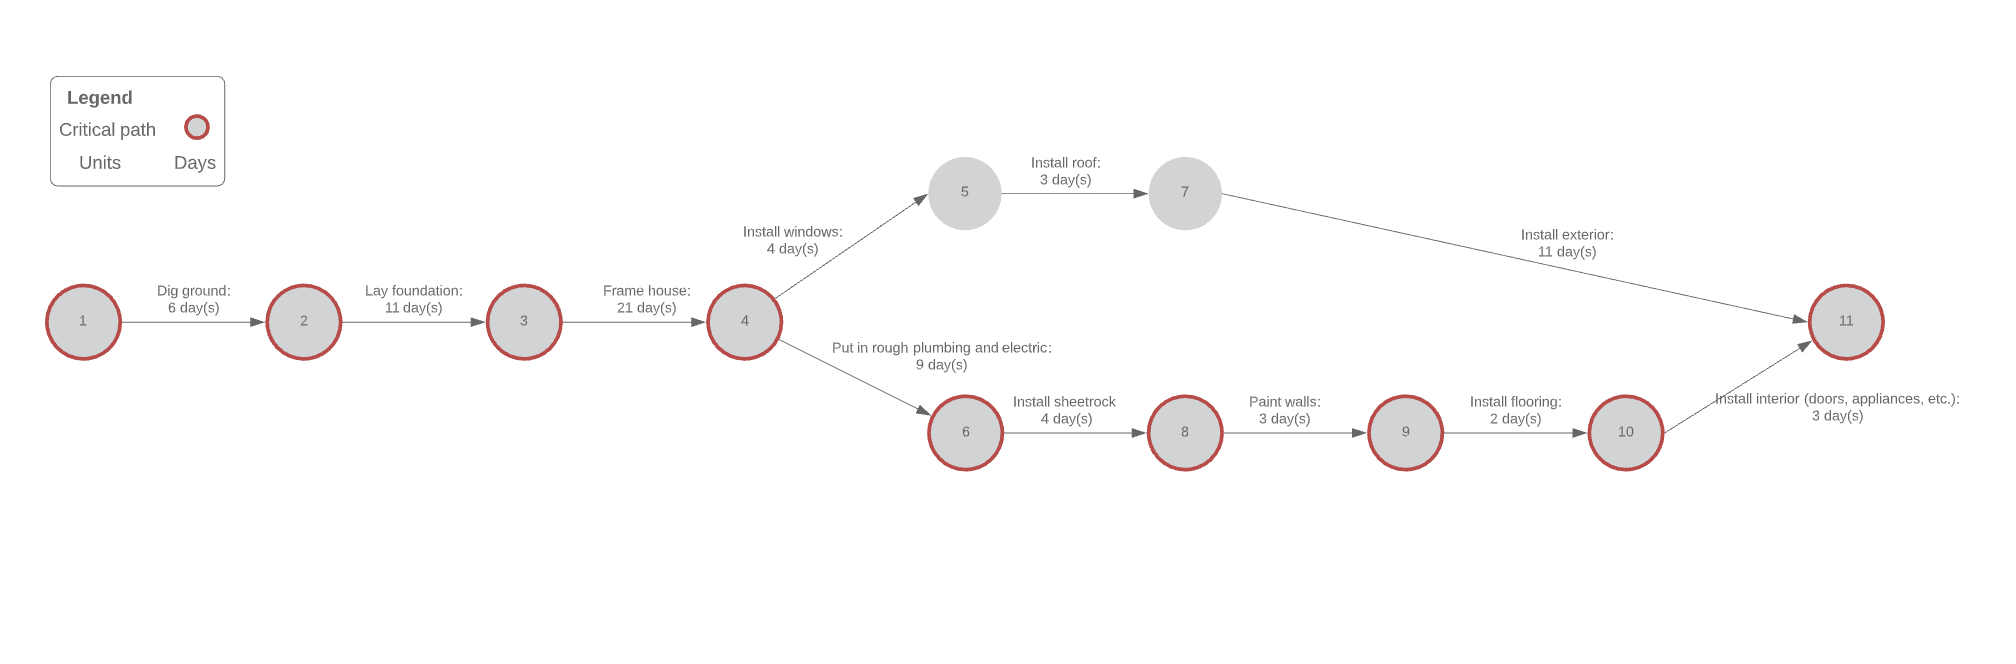
Let's demonstrate with a simple house remodel. If your optimistic time estimate is 160 days, your pessimistic time estimate is 365 days, and your most likely time estimate is 200 days, your equation will look like this:
E = (160 + 4 x 200 + 365)/6
So, you can estimate that your home remodel will be complete in approximately 221 days.
If you prefer a smaller-scale example, the same weighted-average approach works for short tasks as well. For example, say you estimate a step to take about 12 hours of work. If everything goes right, the step could be completed in eight hours. If you run into multiple delays, it could take 28 hours. Plug those figures into the chart:
Estimated duration = 8 + 28 + (4*12)/6 = 14
So now you know that your step is likely to take about 14 hours to complete.
Note that the "most likely" estimate is weighted more heavily than the optimistic and pessimistic estimates, which is why PERT can be more realistic than a simple average when uncertainty is high. Each number (o, p, and m) holds a weighted average of 16.66% each.
How to conduct a PERT analysis
A PERT analysis is used to determine the probability of your project being completed on time. To conduct a PERT analysis, use standard deviation to determine the amount of variation in your data.
The formula for standard deviation is: (P - O)/6
The lower your standard deviation, the more confidence you can have in your expected completion date.
With PERT, you'll also be able to more accurately predict a feasible deadline for your project. PERT is a fantastic method for project management when there's a high degree of uncertainty, as it provides built-in flexibility to account for potential issues.
Advantages of using a PERT chart
PERT charts can be helpful when tackling non-routine or time-sensitive projects with many task dependencies.
Using a PERT chart can:
-
Clarify time constraints for your team.
-
Offer a detailed view of the sequence in which tasks should be performed.
-
Help you manage your time and resources across your team more effectively.
-
Reduce waste and costs as you complete your project.
-
Potentially speed up a project's completion by allowing for overlapping tasks to be identified and initiated.
-
Allow you to easily visualize and organize a complex project.
Perhaps the biggest benefit of using a PERT chart is the potential for higher worker and client satisfaction. When used effectively, the contextualized data in PERT charts can simplify the decision-making process and provide your team with a sense of accountability regarding project requirements. This means less stress, fewer missed deadlines, and more time to get to your next project.
PERT can also help teams spot opportunities to overlap work safely (when dependencies allow), which can shorten the schedule or create buffer time for inevitable delays.
What is the difference between a Gantt chart and a PERT chart?
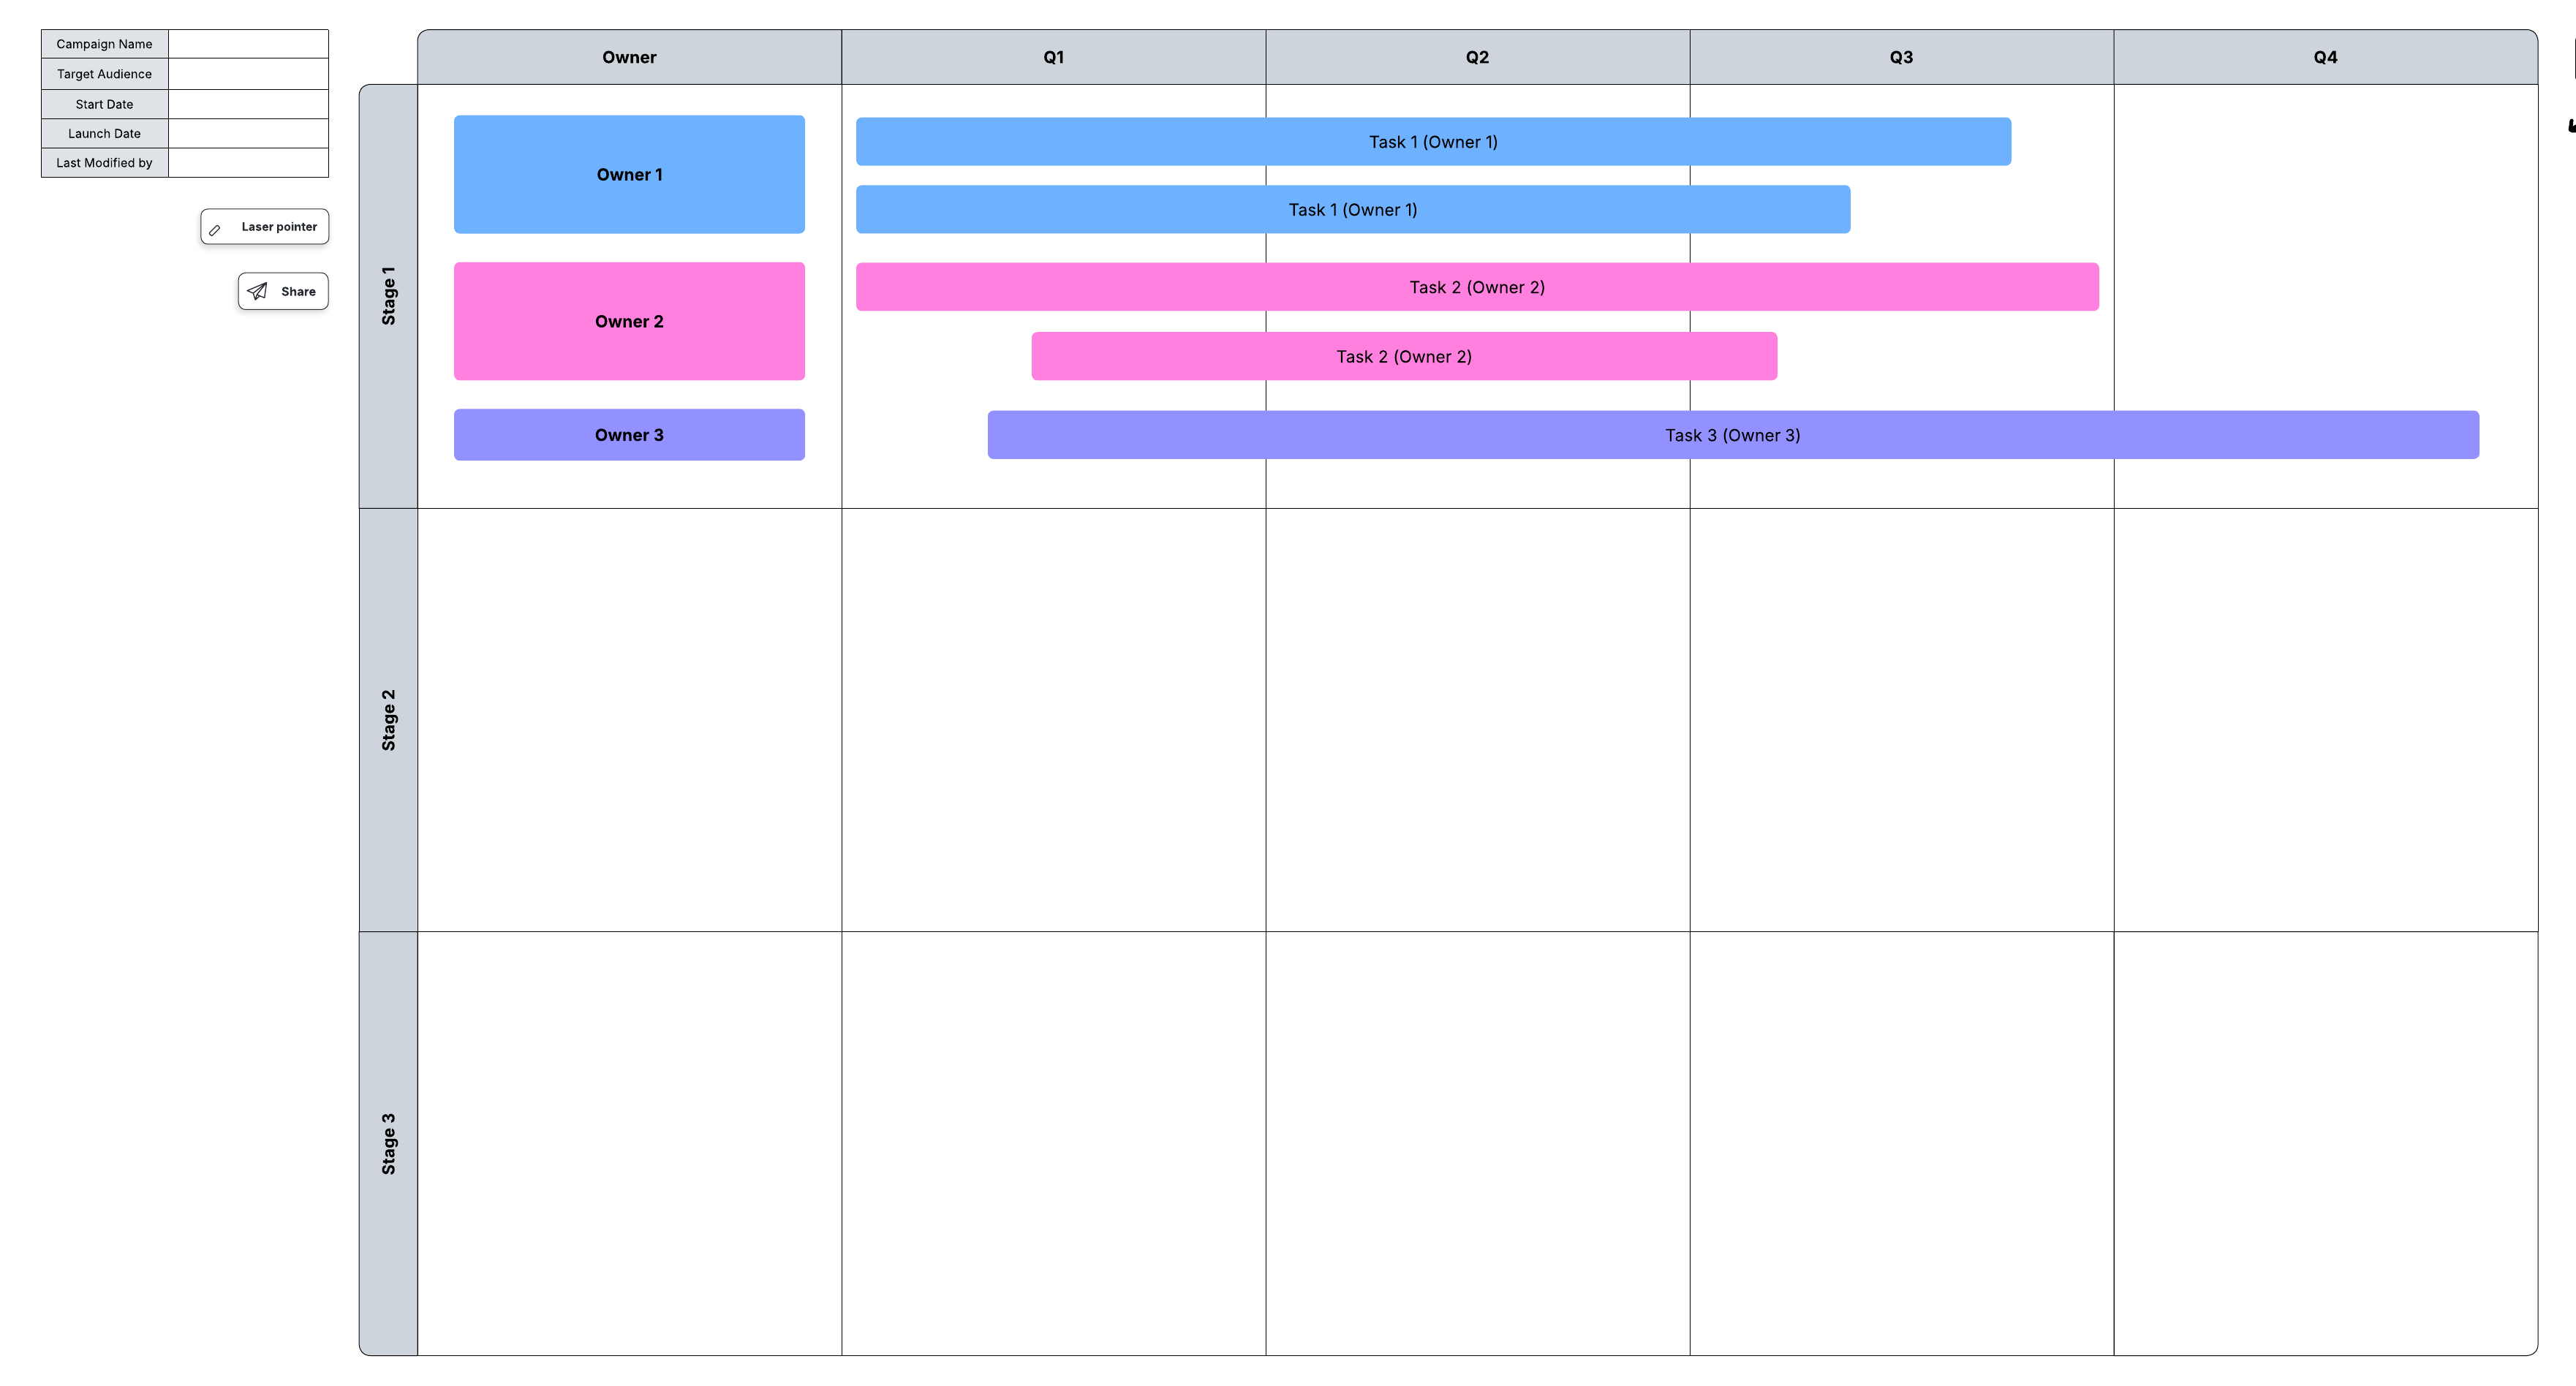
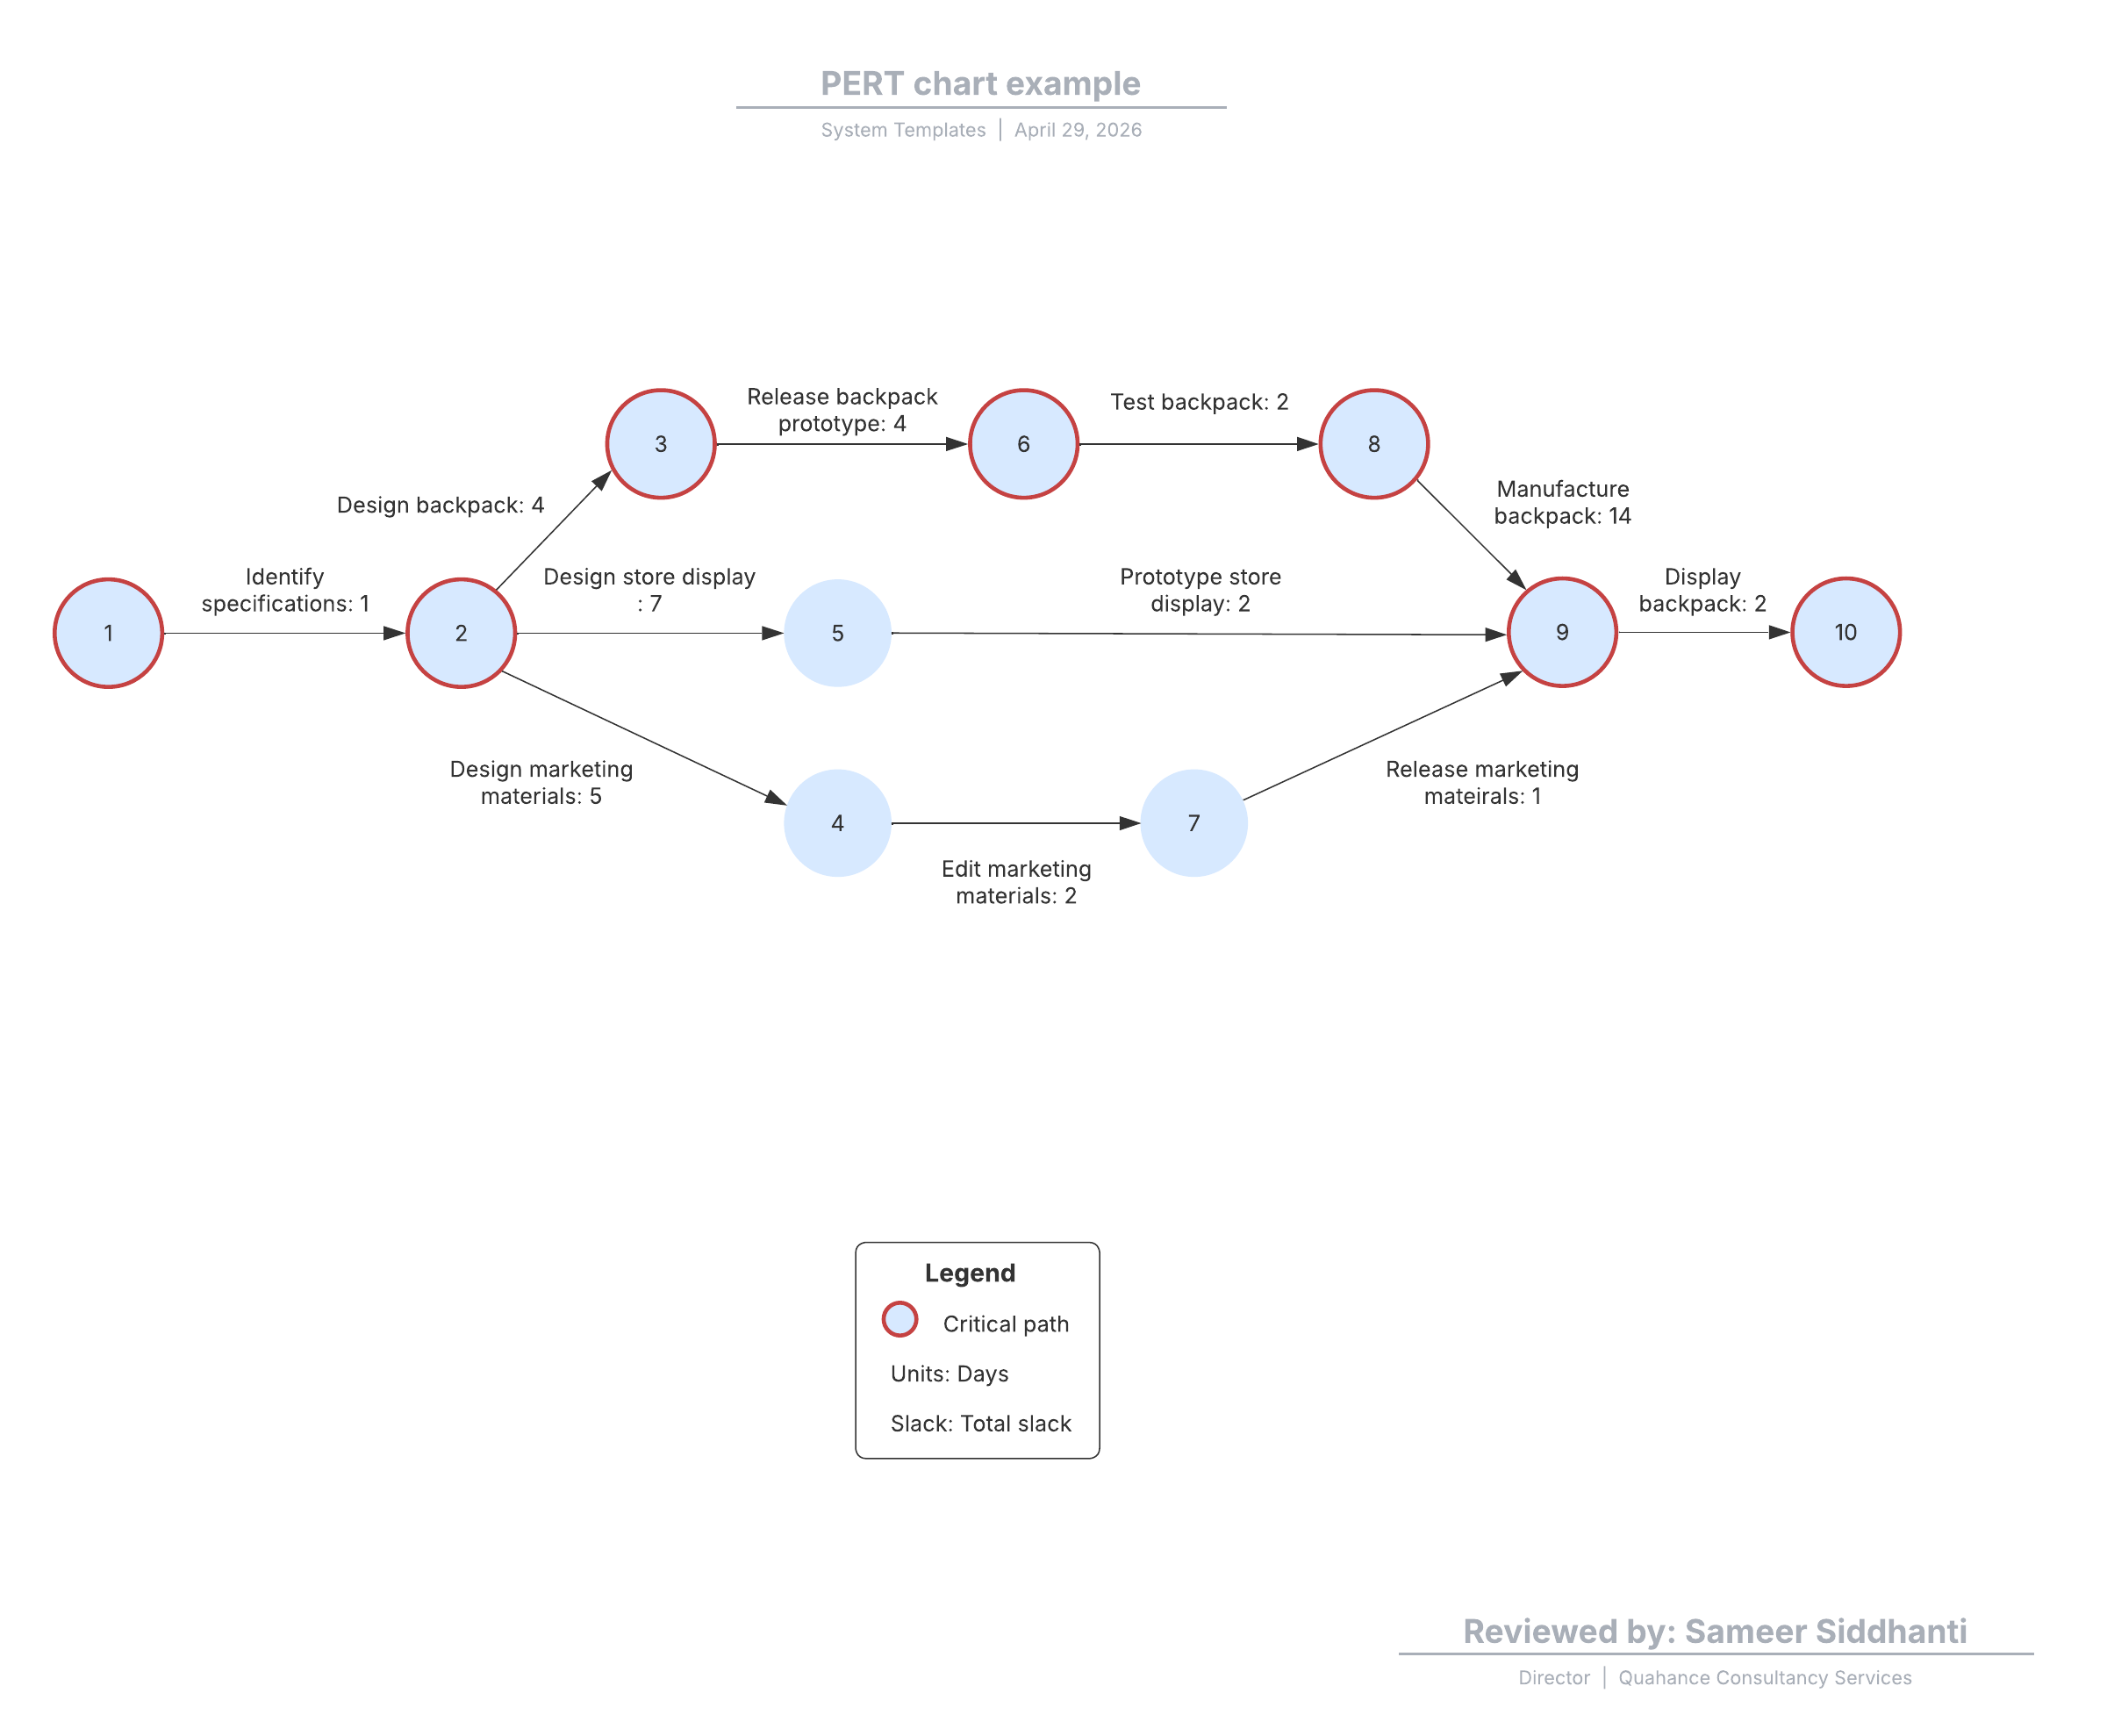
Both PERT charts and Gantt charts are visual tools used for project management, but there are a few notable differences between the two. Most importantly, PERT charts are more commonly used before a project begins to break a larger project into smaller tasks, while Gantt charts are used during a project to schedule tasks by date and depict how much work has been completed.
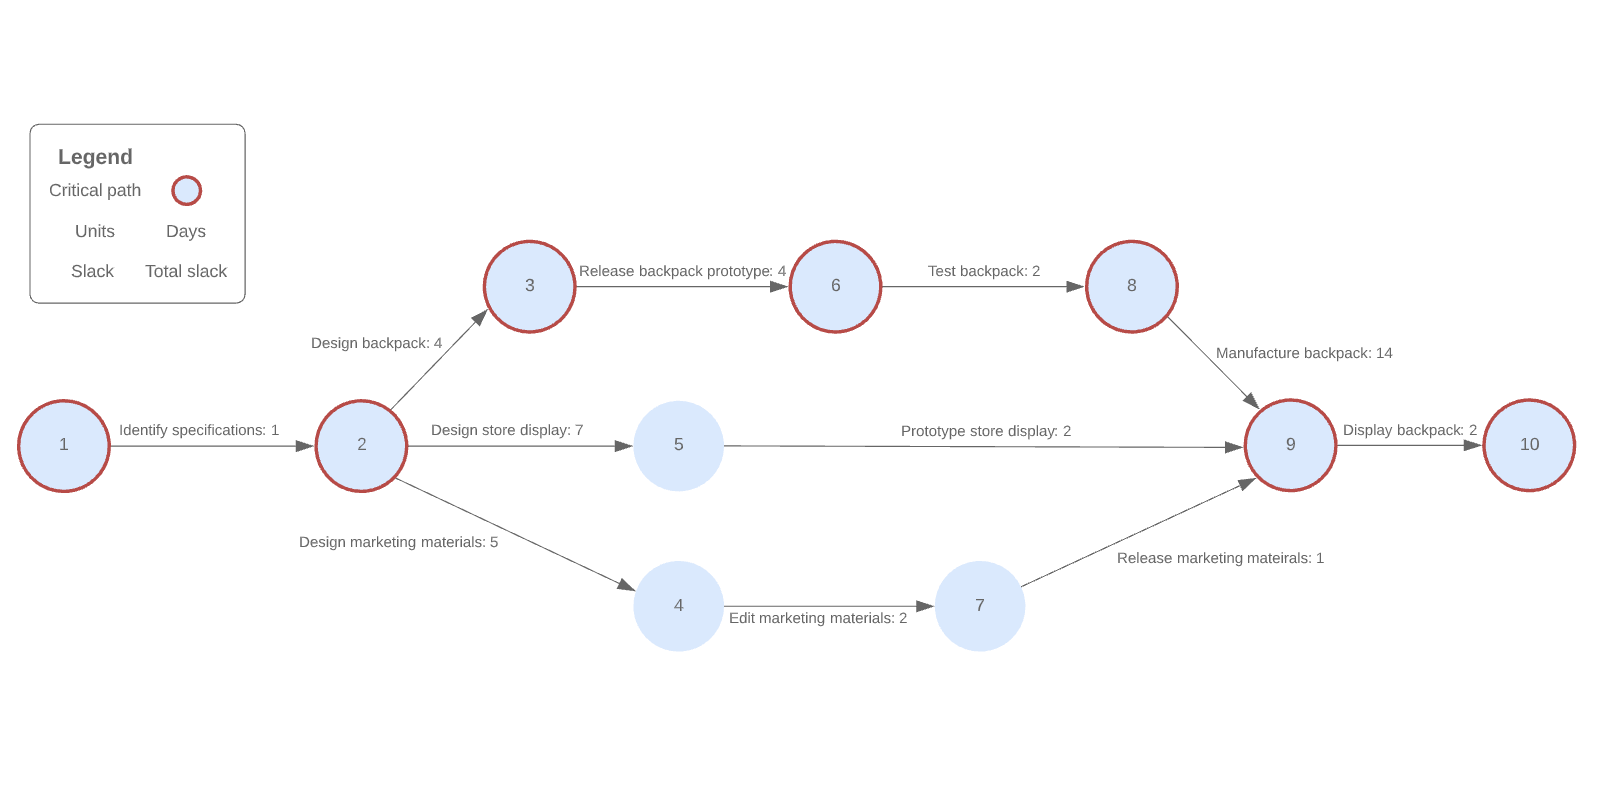
Consider using a PERT chart rather than a Gantt chart if you want to visualize interdependencies, determine your project's critical path, or accurately estimate your project's duration.