Contents
ER Diagram Symbols and Notation
6 min


Everything you need to make a diagram
In addition to our online diagram maker, Lucidchart offers support and training resources to help you branch out to any type of diagram.
View training labs
6 min


In addition to our online diagram maker, Lucidchart offers support and training resources to help you branch out to any type of diagram.
View training labs
You could say that the modern world runs on databases. Whether itâs a CRM, an online market, or a medical records software, virtually all businesses uses databases to track and serve their contacts, customers, or patients.
With data at the heart of every transaction and every query, designing efficient databases becomes an absolute priority to keep operations running smoothly (no pressure). Fortunately, there are many tools that can help engineers to design, document, and troubleshoot databases quickly. For example, consider entity relationship diagrams (ERDs).
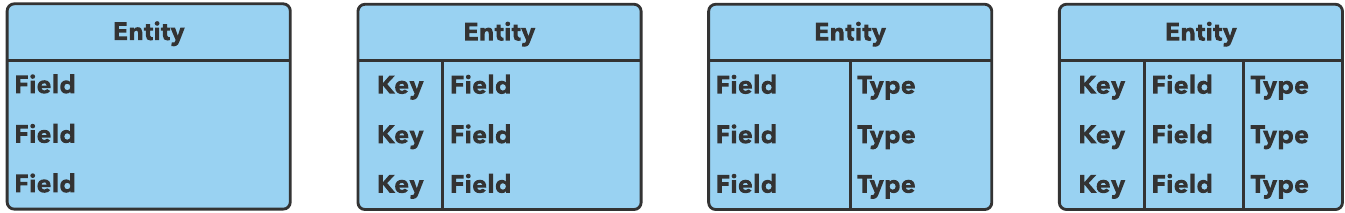
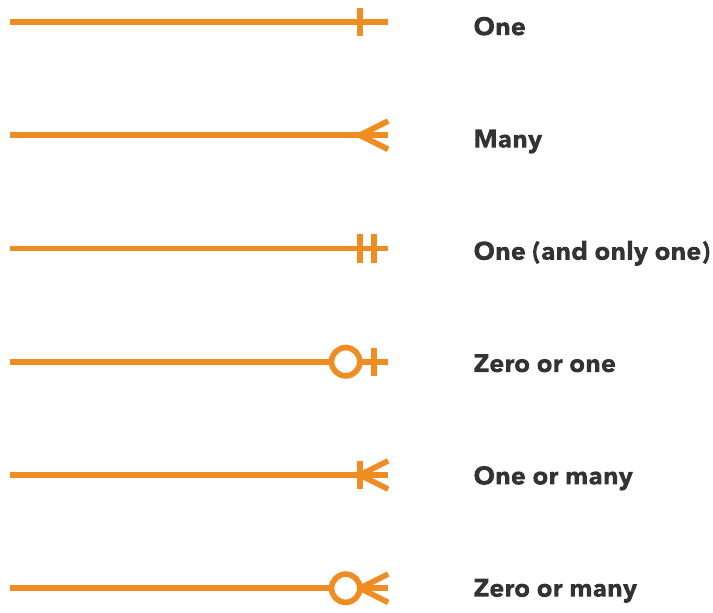
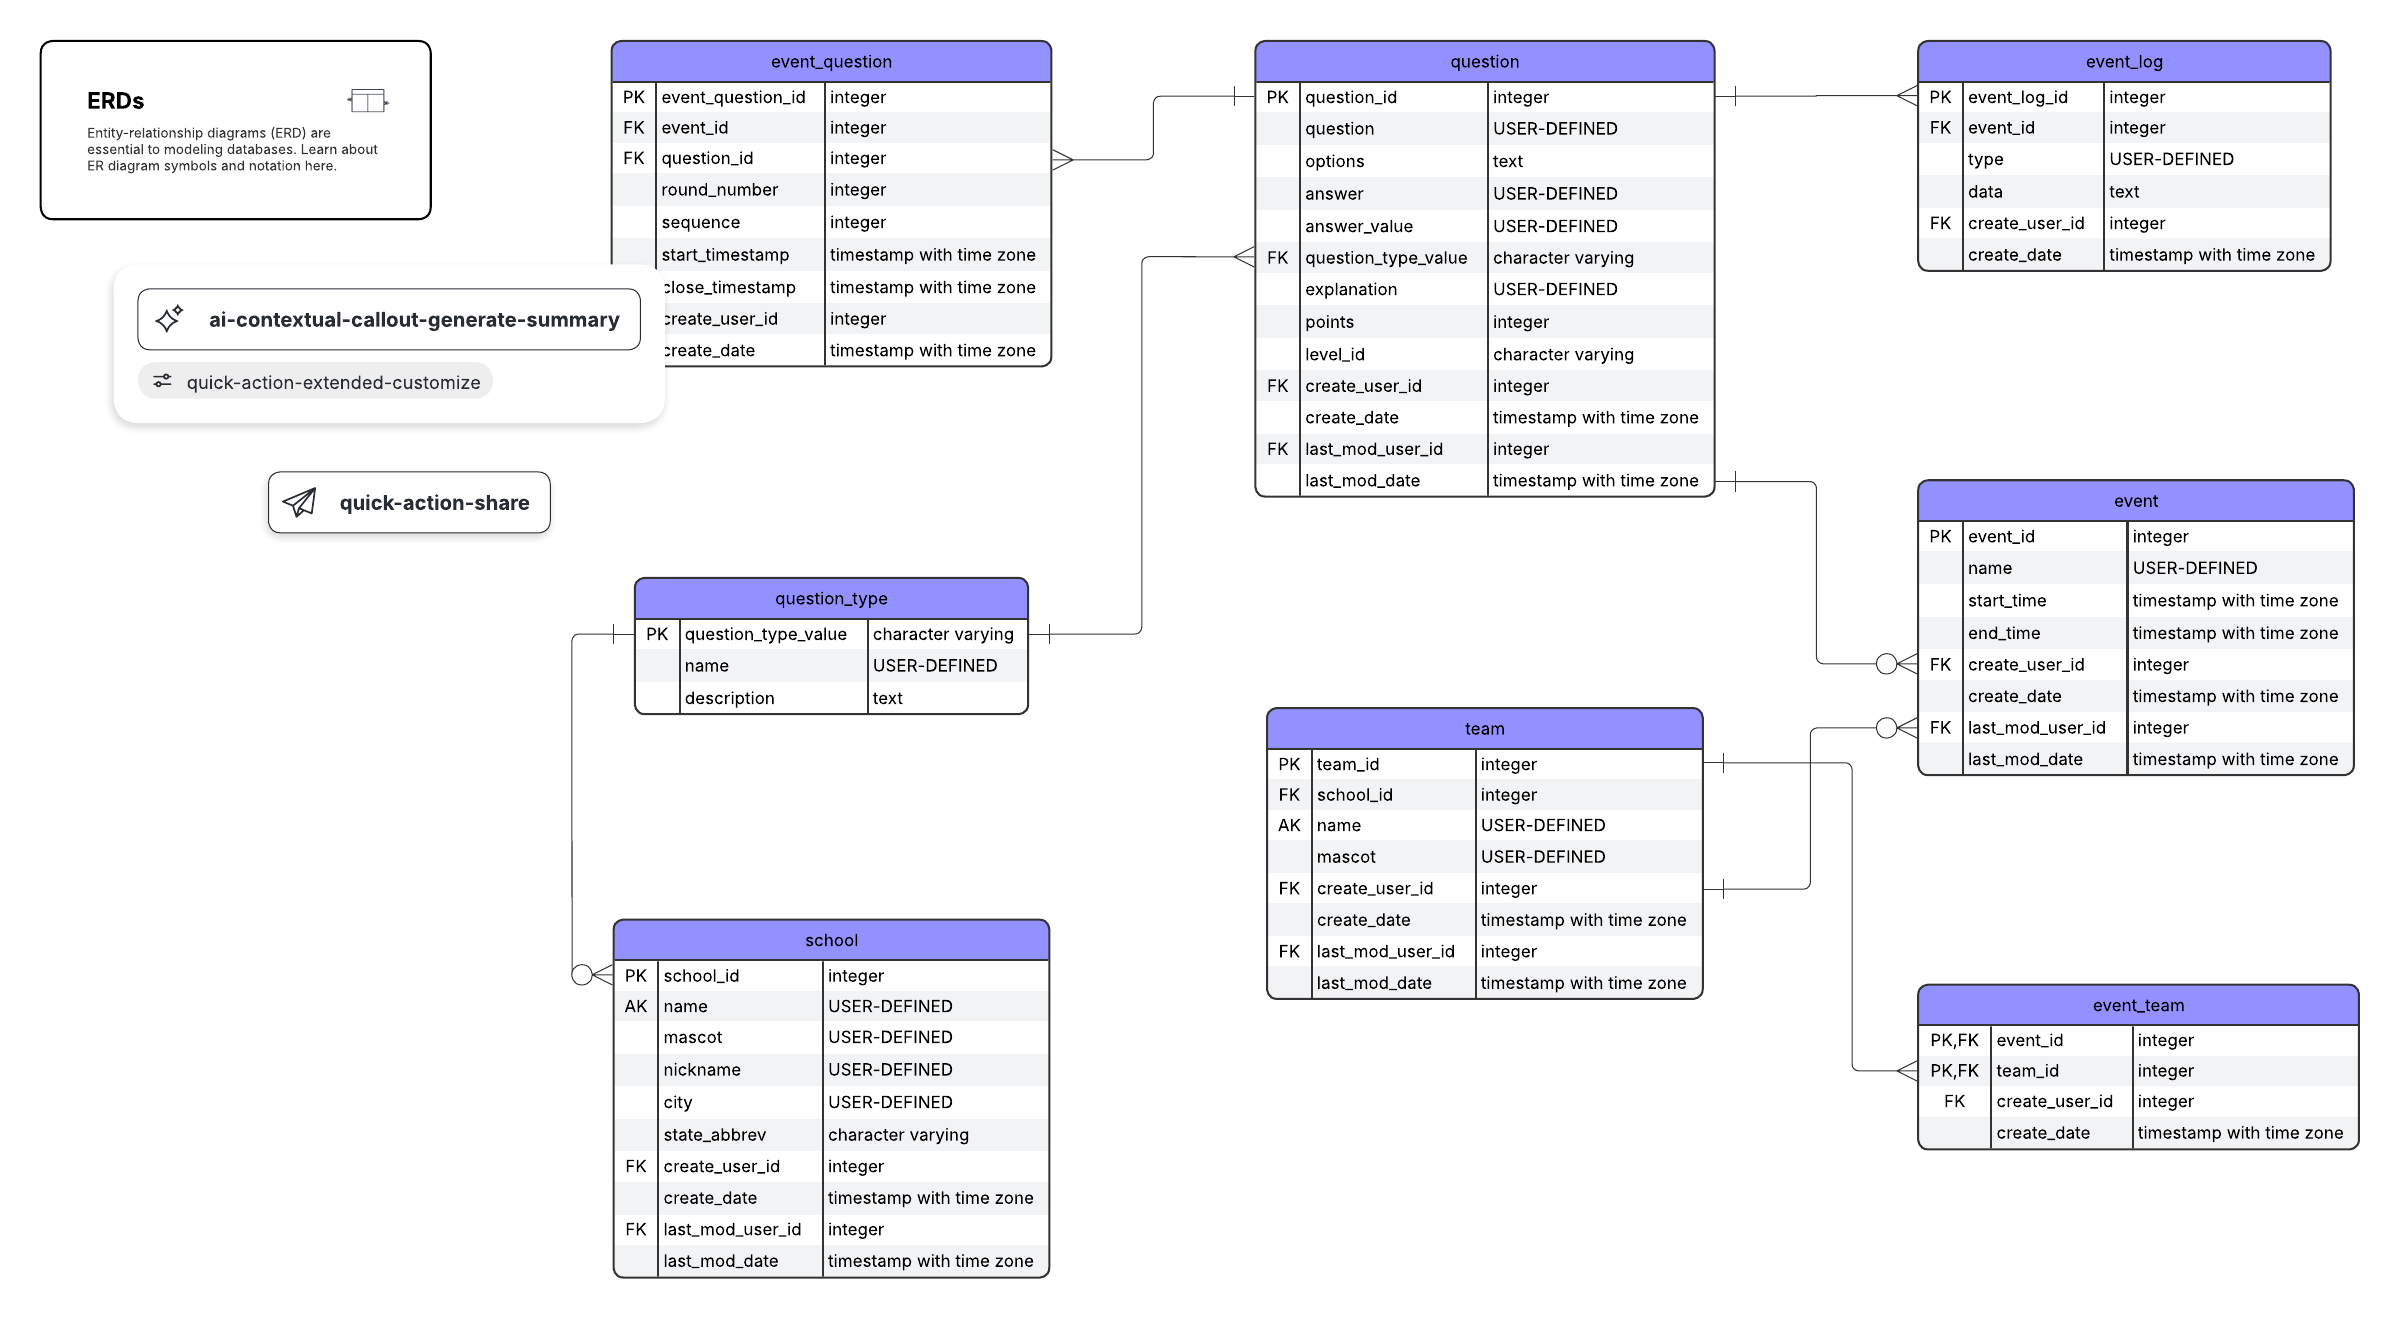
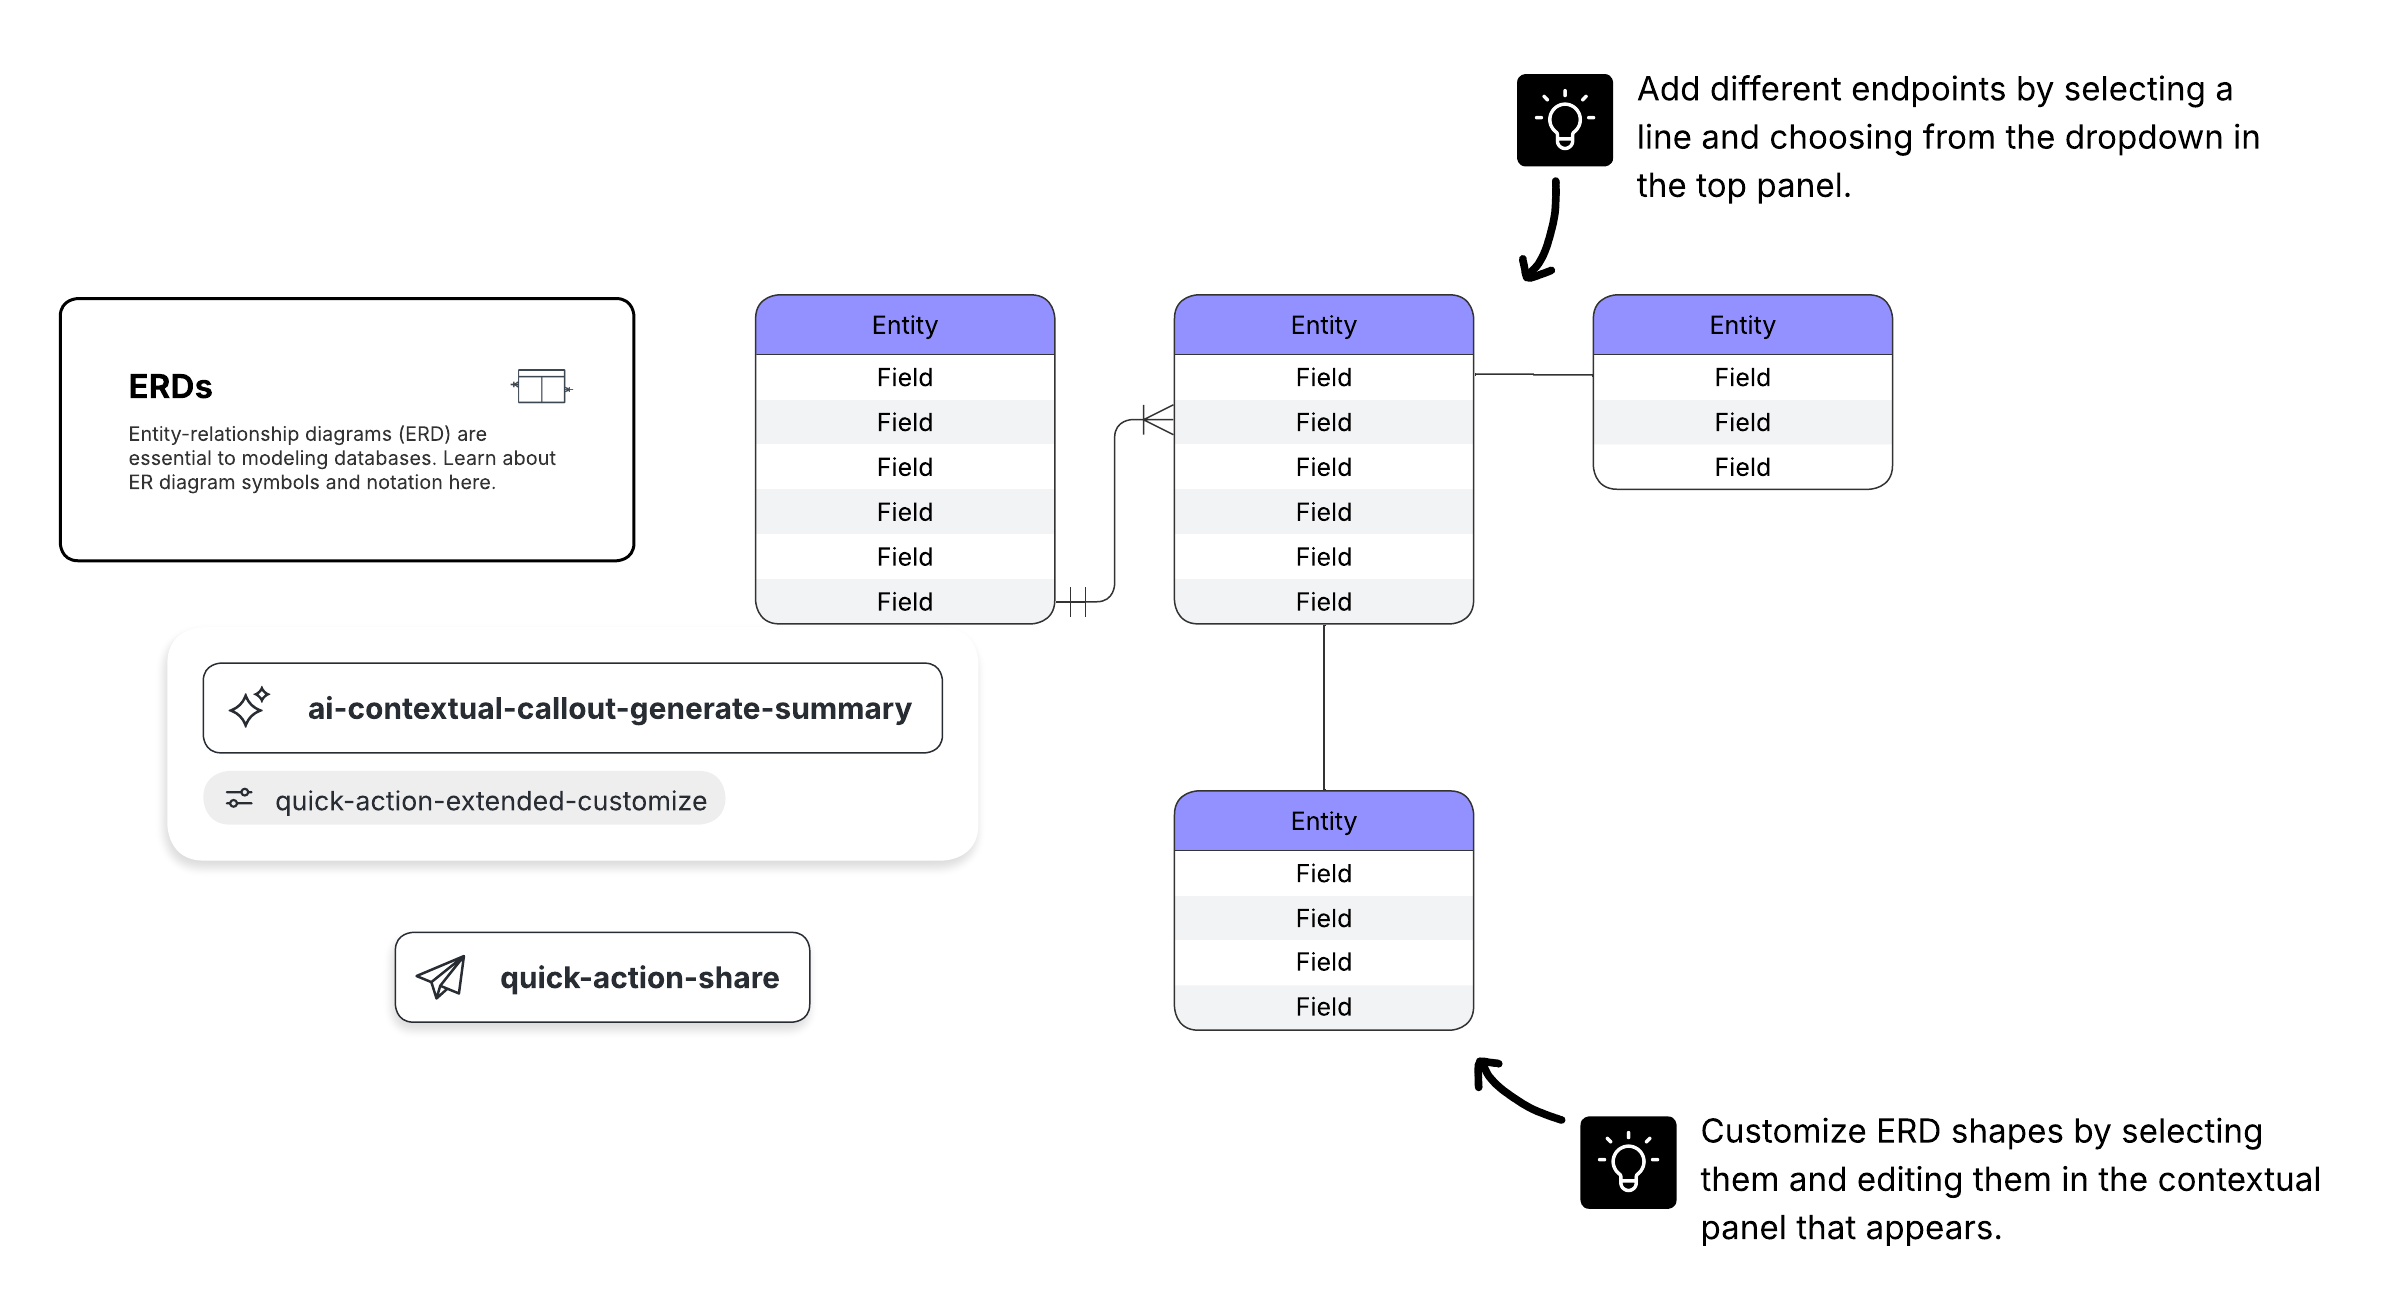
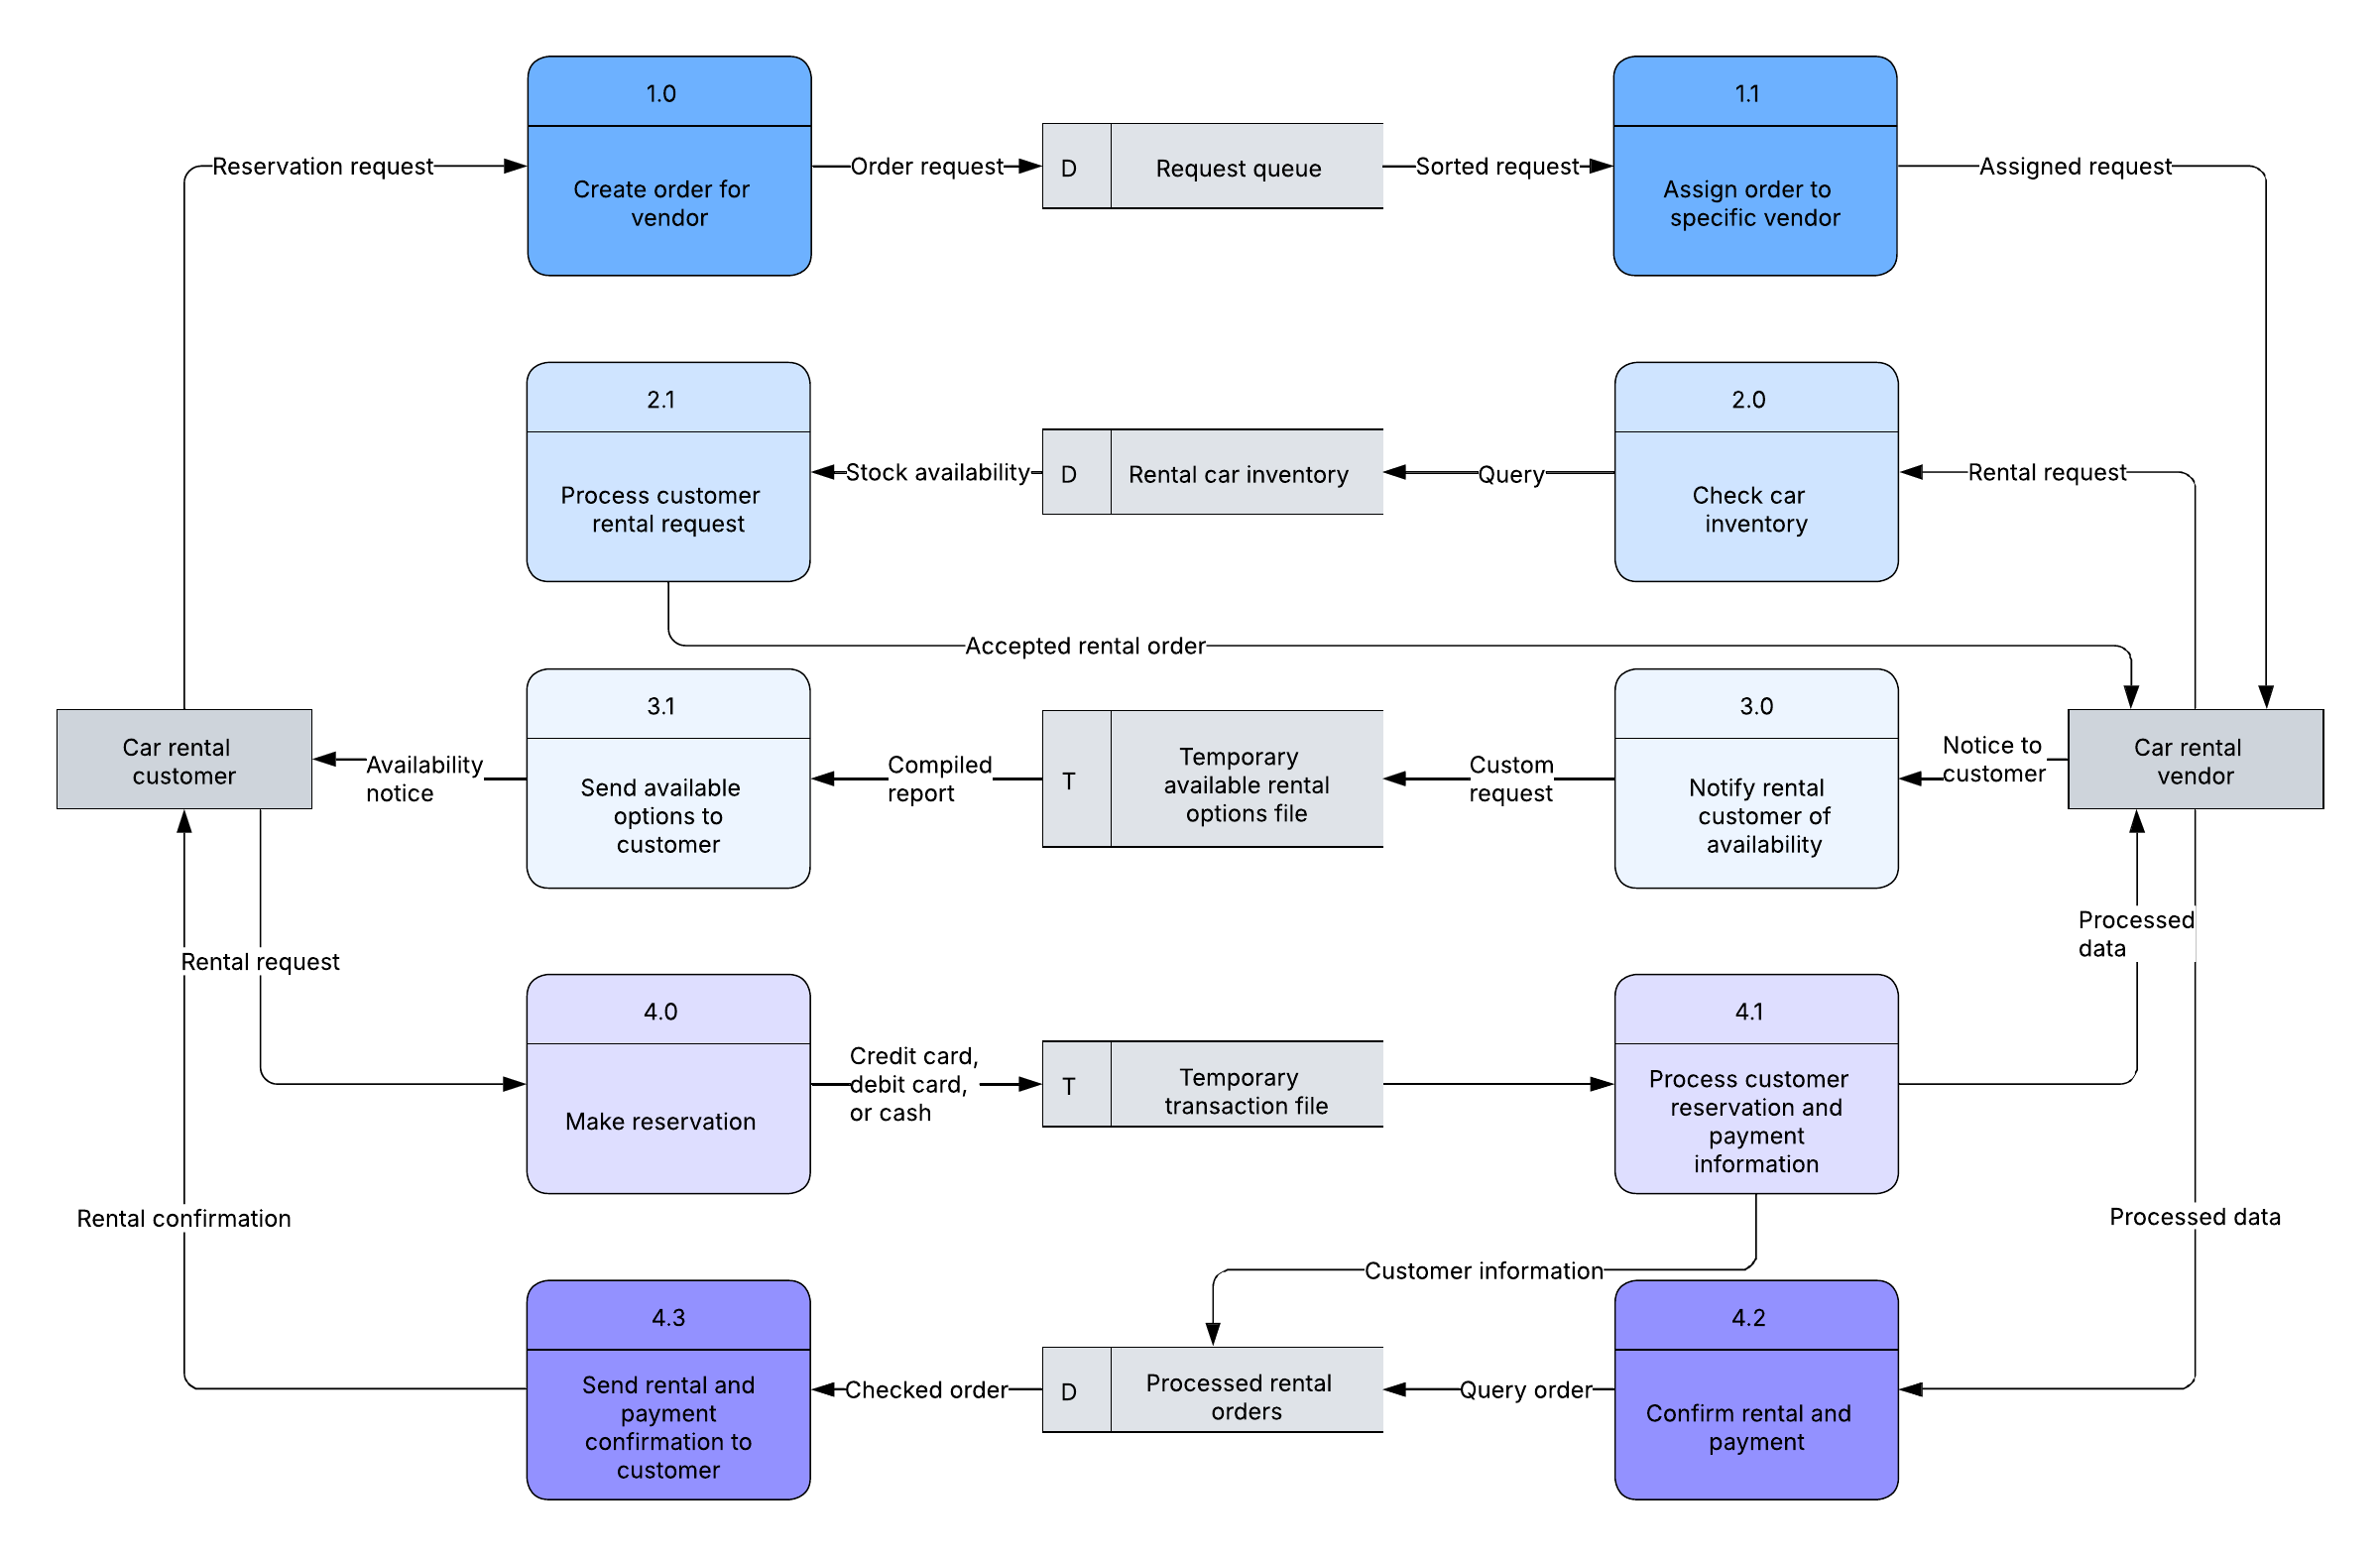
ERDs help engineers visualize relationships between the many elements that are part of a system so they can make intelligent decisions about their work. Consequently, anyone planning on entering the field of database management or on working closely with database engineers should be well-versed in the basics of ERDs.
If youâre in need of a crash course or a quick refresher, weâve put this guide together for you. Take a minute to brush up on your ERD savvy so youâll be ready for your next database adventure.
Looking for a quick and easy way to build and share ER diagrams with your team? Try collaborative diagramming in Lucidchart!  Â
Learn how to make ERDs in Lucidchart
Before you look at specific symbols, it's important to understand the basics of ER diagrams. There are several ways to model entity-relationship diagrams depending on the amount of detail you want to provide.
The most high-level ER diagram is a conceptual data model followed by the logical data model. The lowest-level diagramâand therefore the most detailedâis the physical data model. Consult the chart below to see which diagram elements are included in each data model.
This ER model establishes a broad view of what should be included in the model set. Conceptual data models:
Conceptual ERDs can be used as the foundation for logical data models. They may also be used to form commonality relationships between ER models as a basis for data model integration.
This model contains more detail than the conceptual ER model, without regard to how information will be physically implemented in the database. Logical data models:
Normalization is the process of removing redundancy in a table so that the table is easier to modify. Normalization typically occurs by dividing an entity table into two or more tables and defining relationships between the tables.

The physical data model represents the process of adding information to the database. This model shows all table structures, including column name, column data type, column constraints, primary key, foreign key, and relationships between tables. Physical data models:
These symbols are generally used for conceptual data models, although some aspects may spill over into logical data models. They can be found in the UML Entity Relationship and Entity Relationship shape library of Lucidchart. If you don't see the shape you need, use an image file (Lucidchart supports PNG, JPG, or SVG import) or create your own with our existing shapes and styling options.
Entities are objects or concepts that represent important data. They are typically nouns, e.g. customer, supervisor, location, or promotion.
Relationships are meaningful associations between or among entities. They are usually verbs, e.g. assign, associate, or track.
The symbols below are used at the most granular level of ERDsâphysical data models. Some elements are also used for logical data models.
Relationships illustrate an association between two tables. In the physical data model, relationships are represented by stylized lines.
Cardinality and ordinality, respectively, refer to the maximum number of times an instance in one entity can be associated with instances in the related entity, and the minimum number of times an instance in one entity can be associated with an instance in the related entity. Cardinality and ordinality are represented by the styling of a line and its endpoint, as denoted by the chosen notation style.
When it comes to notation, data modelers have many options to choose from. While crow's foot notation is widely accepted as the most intuitive style, some developers use OMT, IDEF, Bachman, or UML notation to indicate cardinality. Since crow's foot notation shows both minimum and maximum cardinality in an easy-to-read graphic format, Lucidchart offers crow's foot notation as the preferred style.
Now that youâre all caught up on ERD symbols and notation, try building your own ER diagram in Lucidchart. Itâs free to use and offers every standard entity relationship shape so you can quickly build professional ER diagrams. When youâre done, export your design to MySQL, PostgreSQL, SQL Server, or Oracle to instantly generate a database. For extra credit, take a screenshot of your diagram and share it with us in the comments below (minus proprietary information of course)!
Try Lucidchart free
Make a polished, professional diagram for free with Lucidchart. No matter what you have in mind, we have the tools you need to build it. Make an account and start diagramming today.
Sign up free