Contents
What is a data flow diagram?
7 min
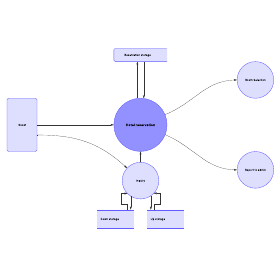
DFD Level 1
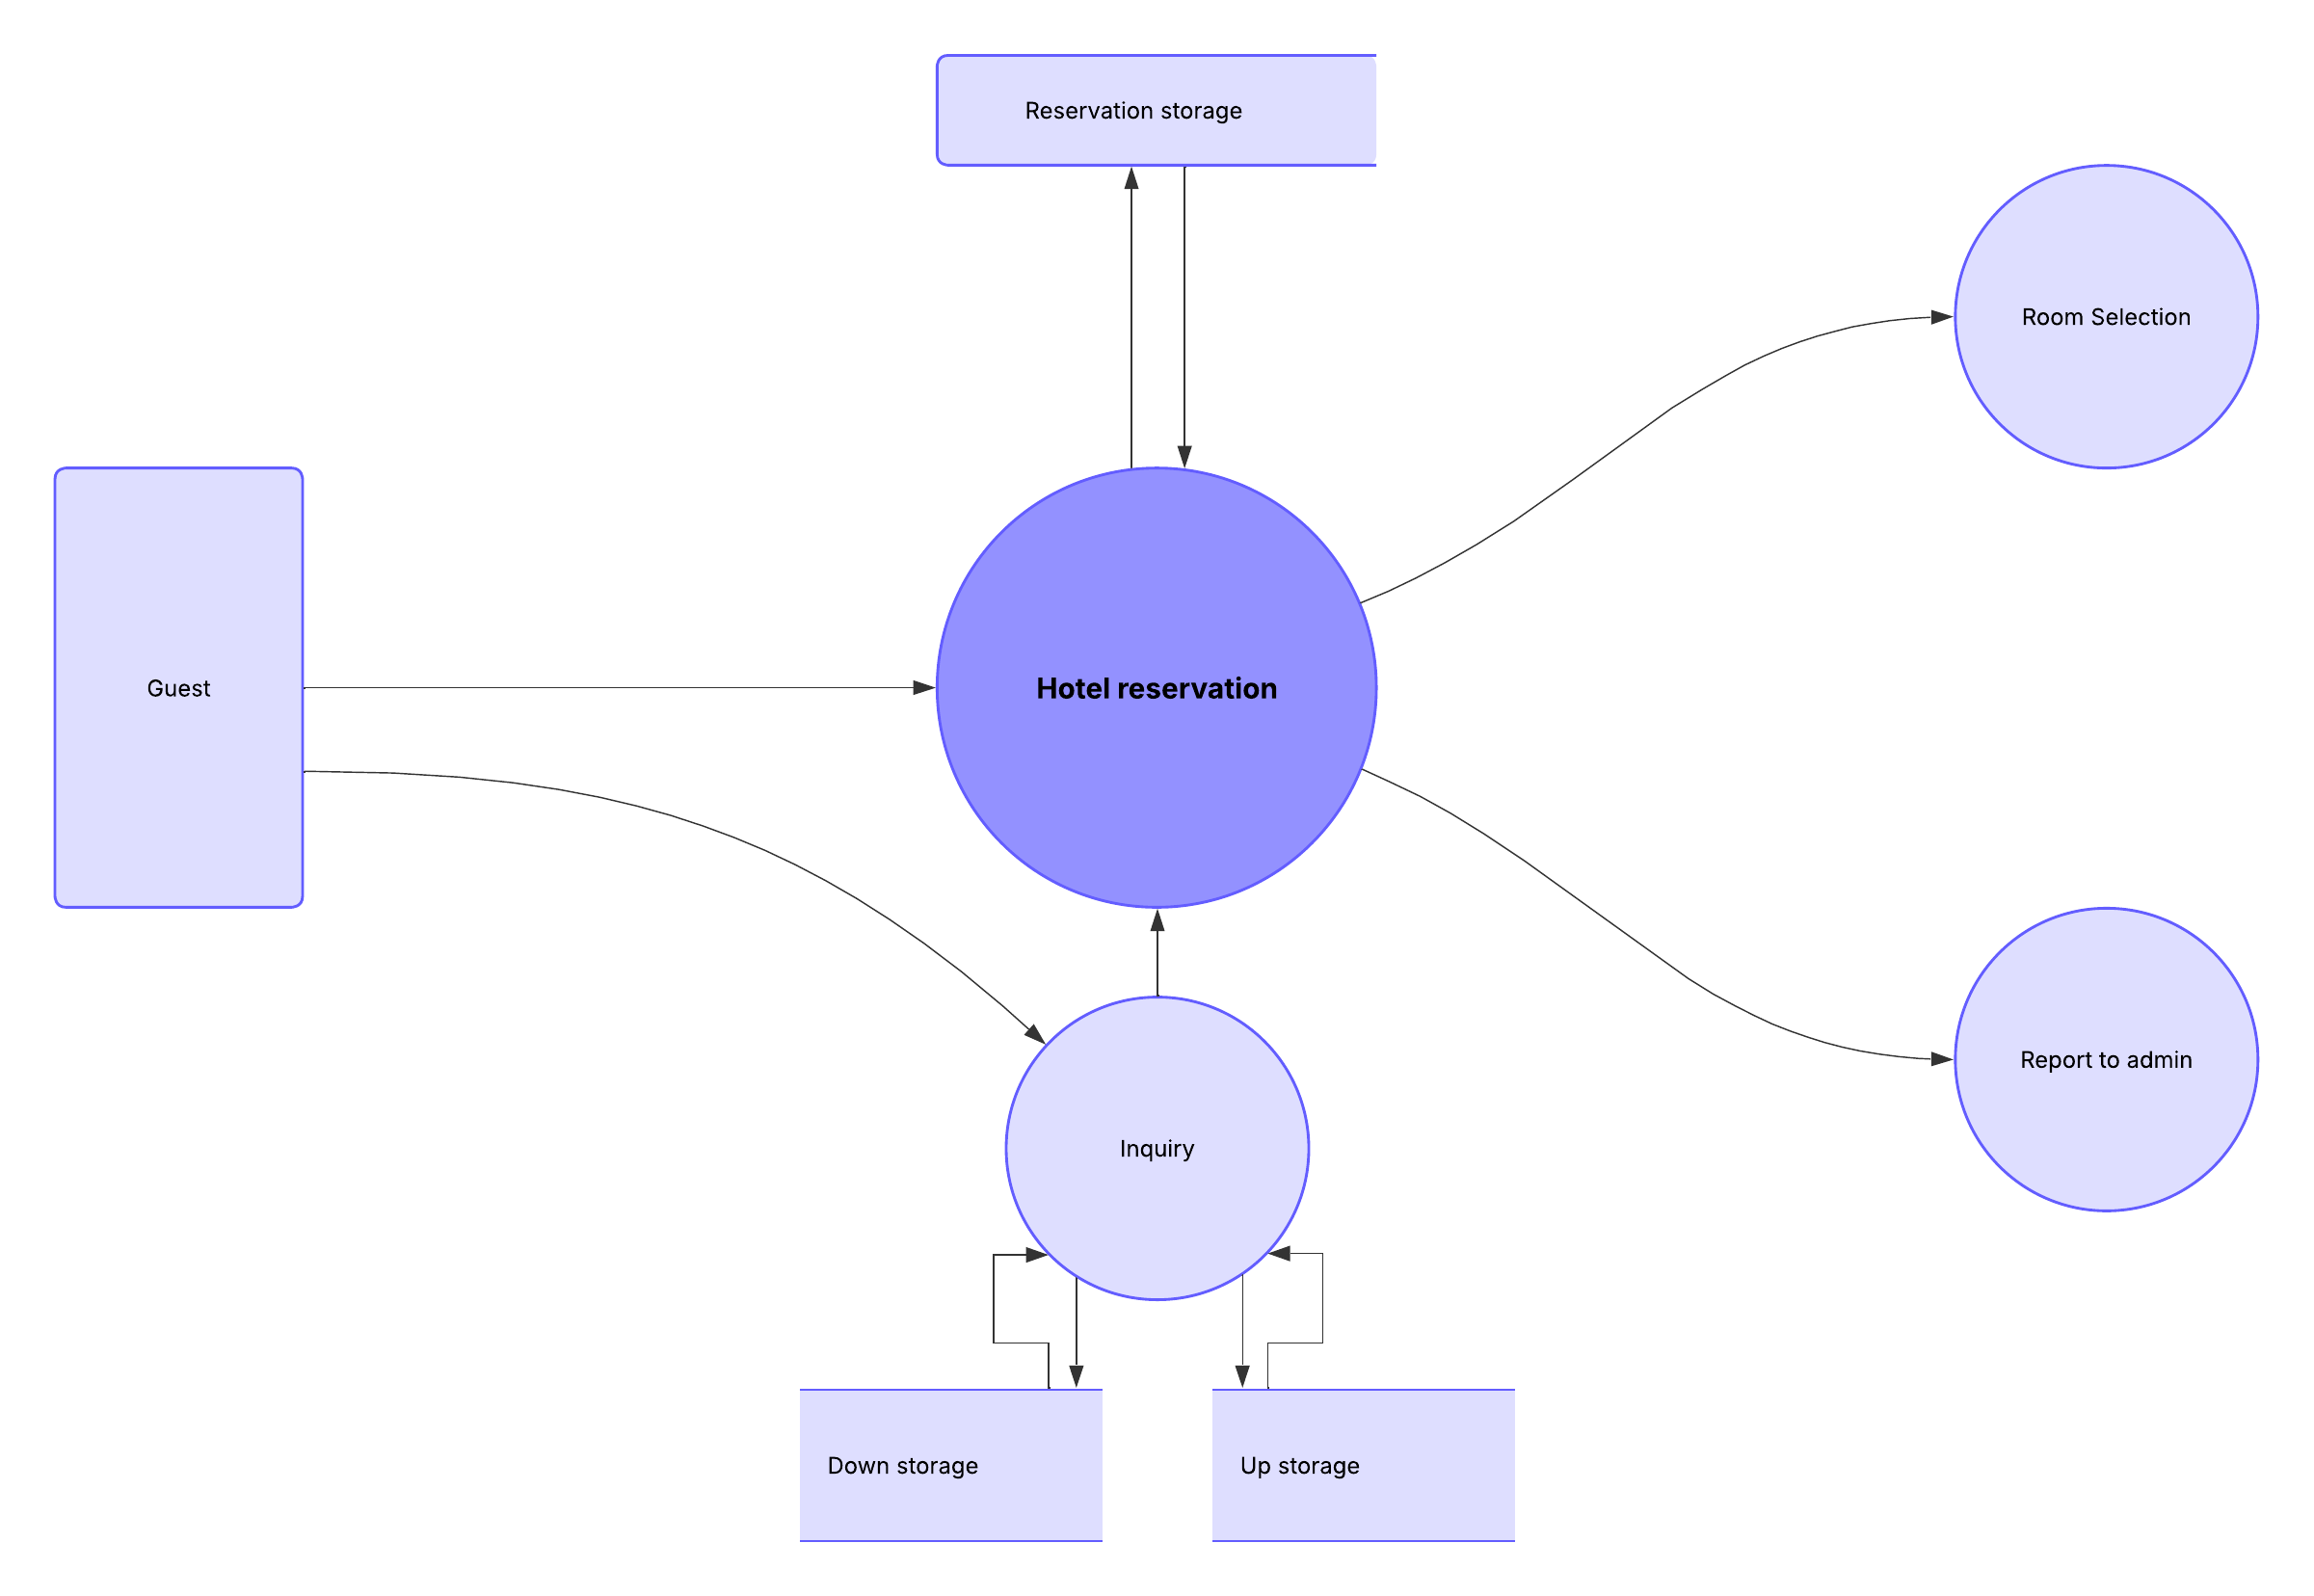
A DFD Level 1 diagram provides a more detailed breakdown of pieces of the context-level diagram. It highlights the system’s main functions.
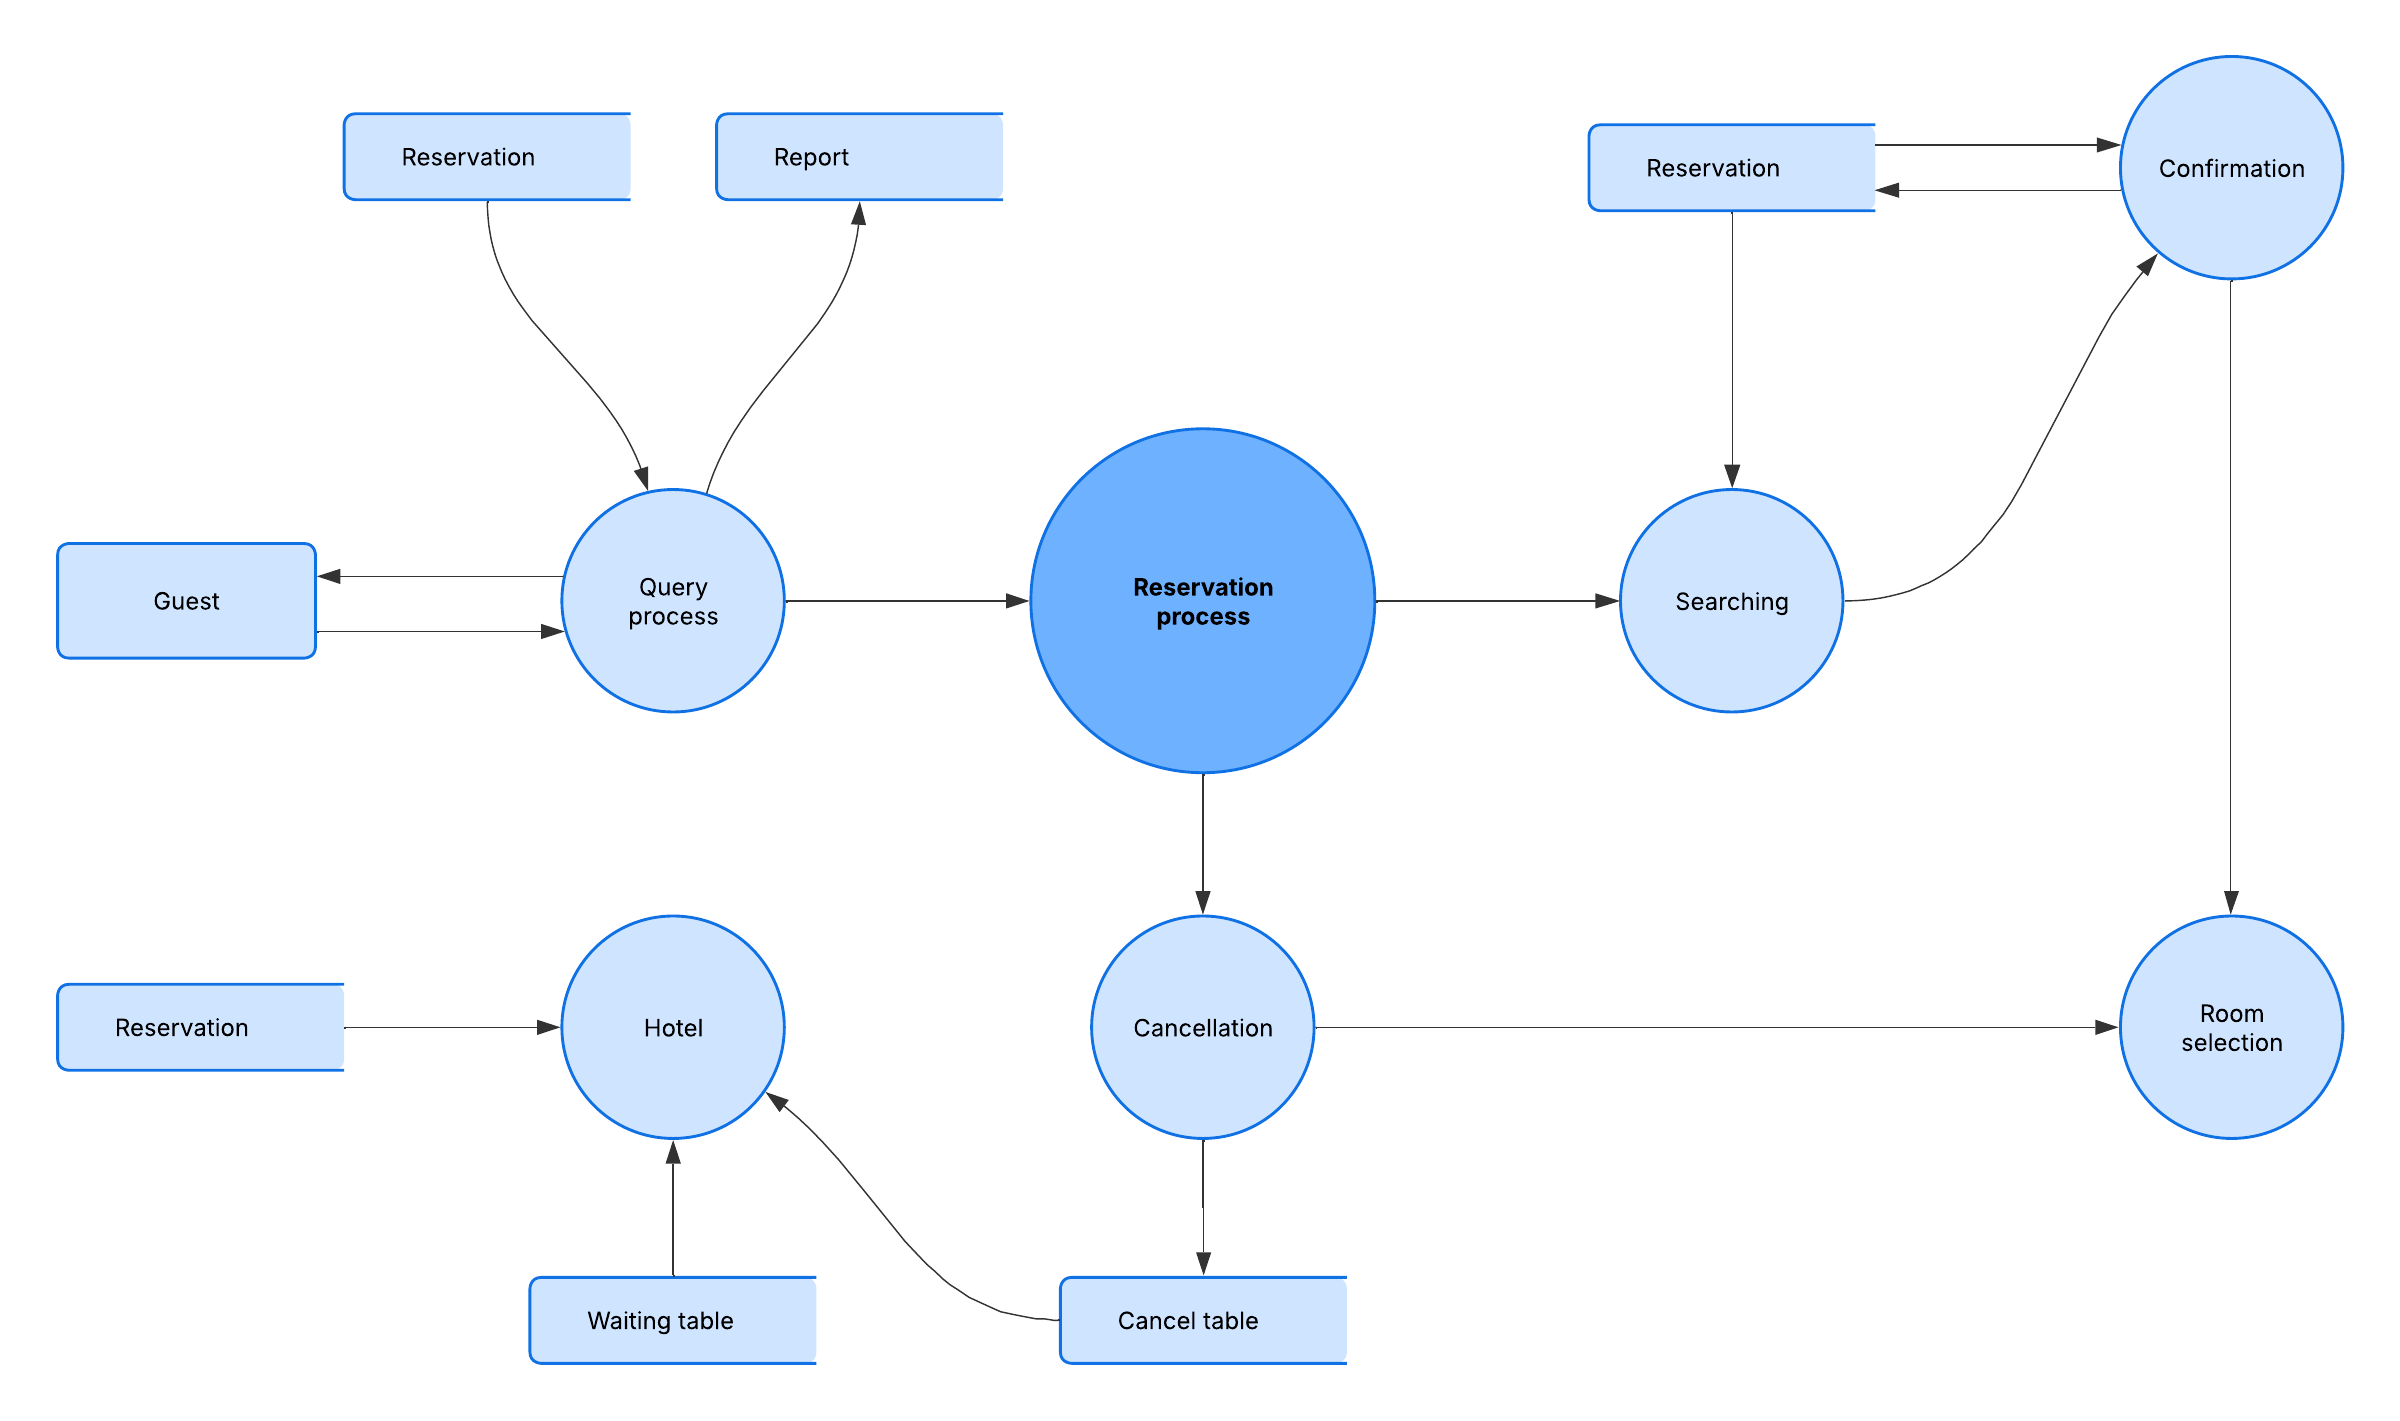
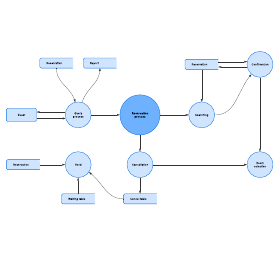
DFD Level 2
A Level 2 DFD then goes one step deeper into parts of Level 1. It may require more text to reach the necessary level of detail about the system's functioning.
Data flow diagram templates and examples
Use a template from our gallery to help you start work on your data flow diagram.
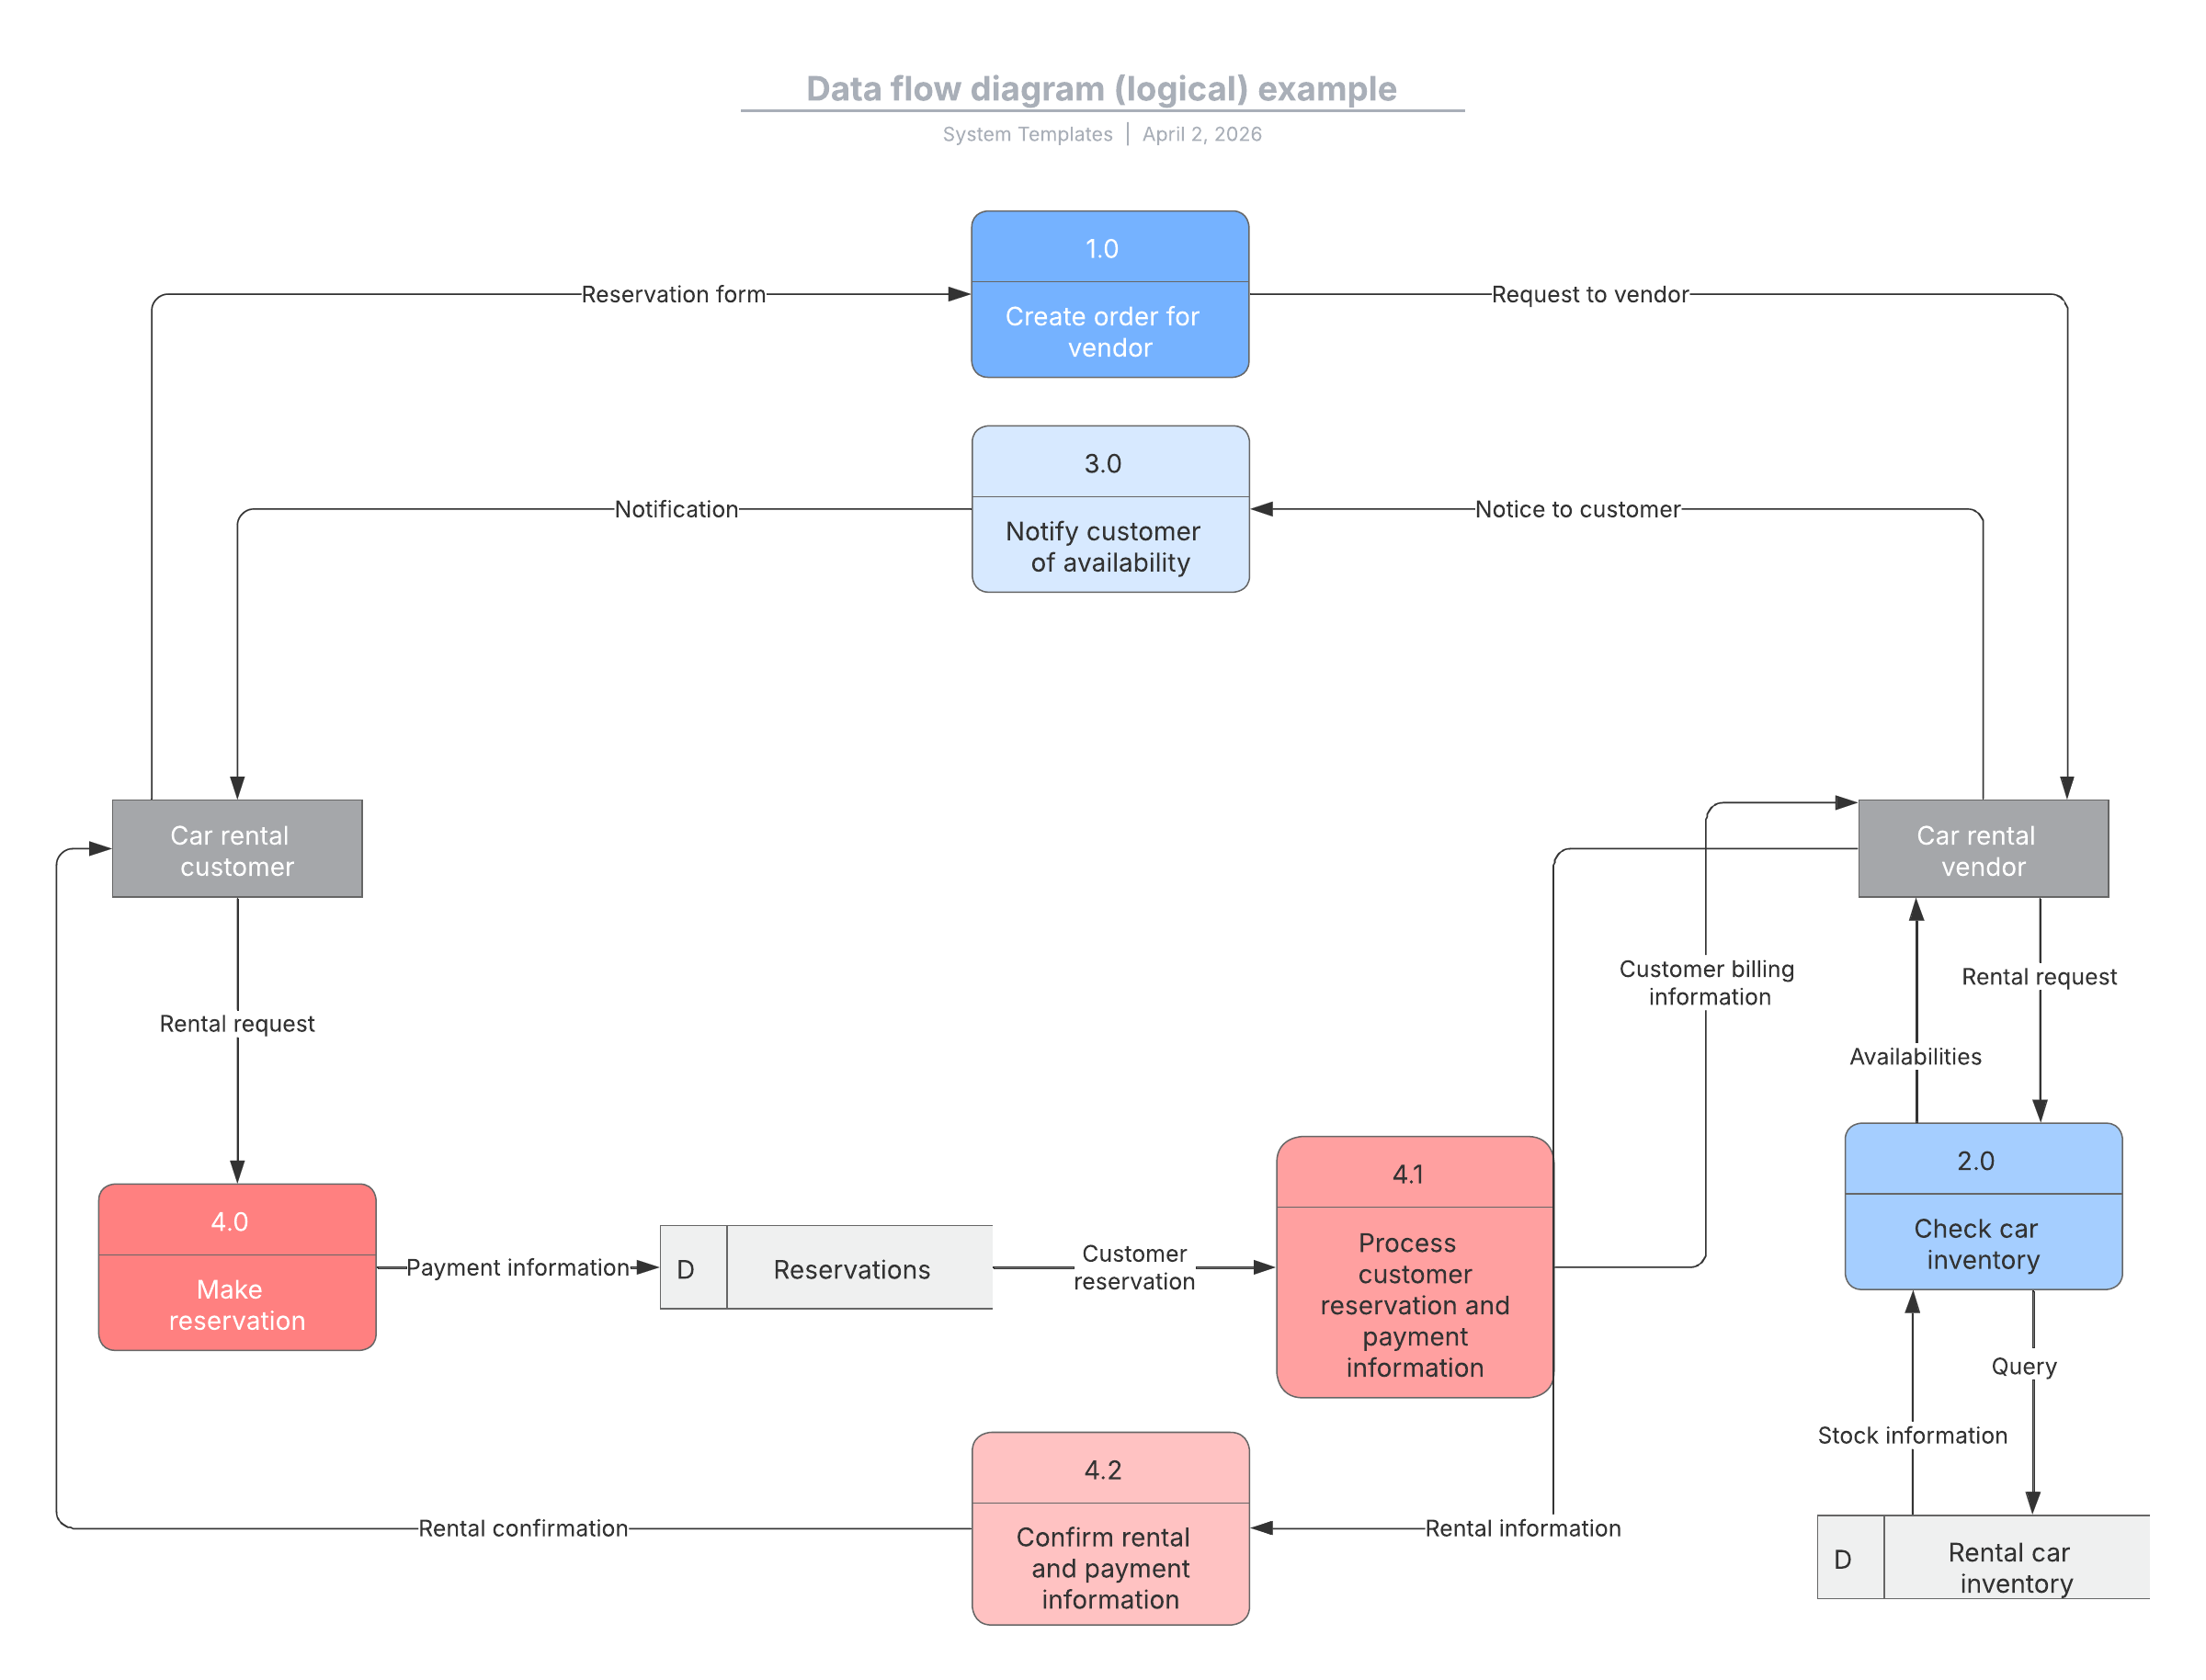
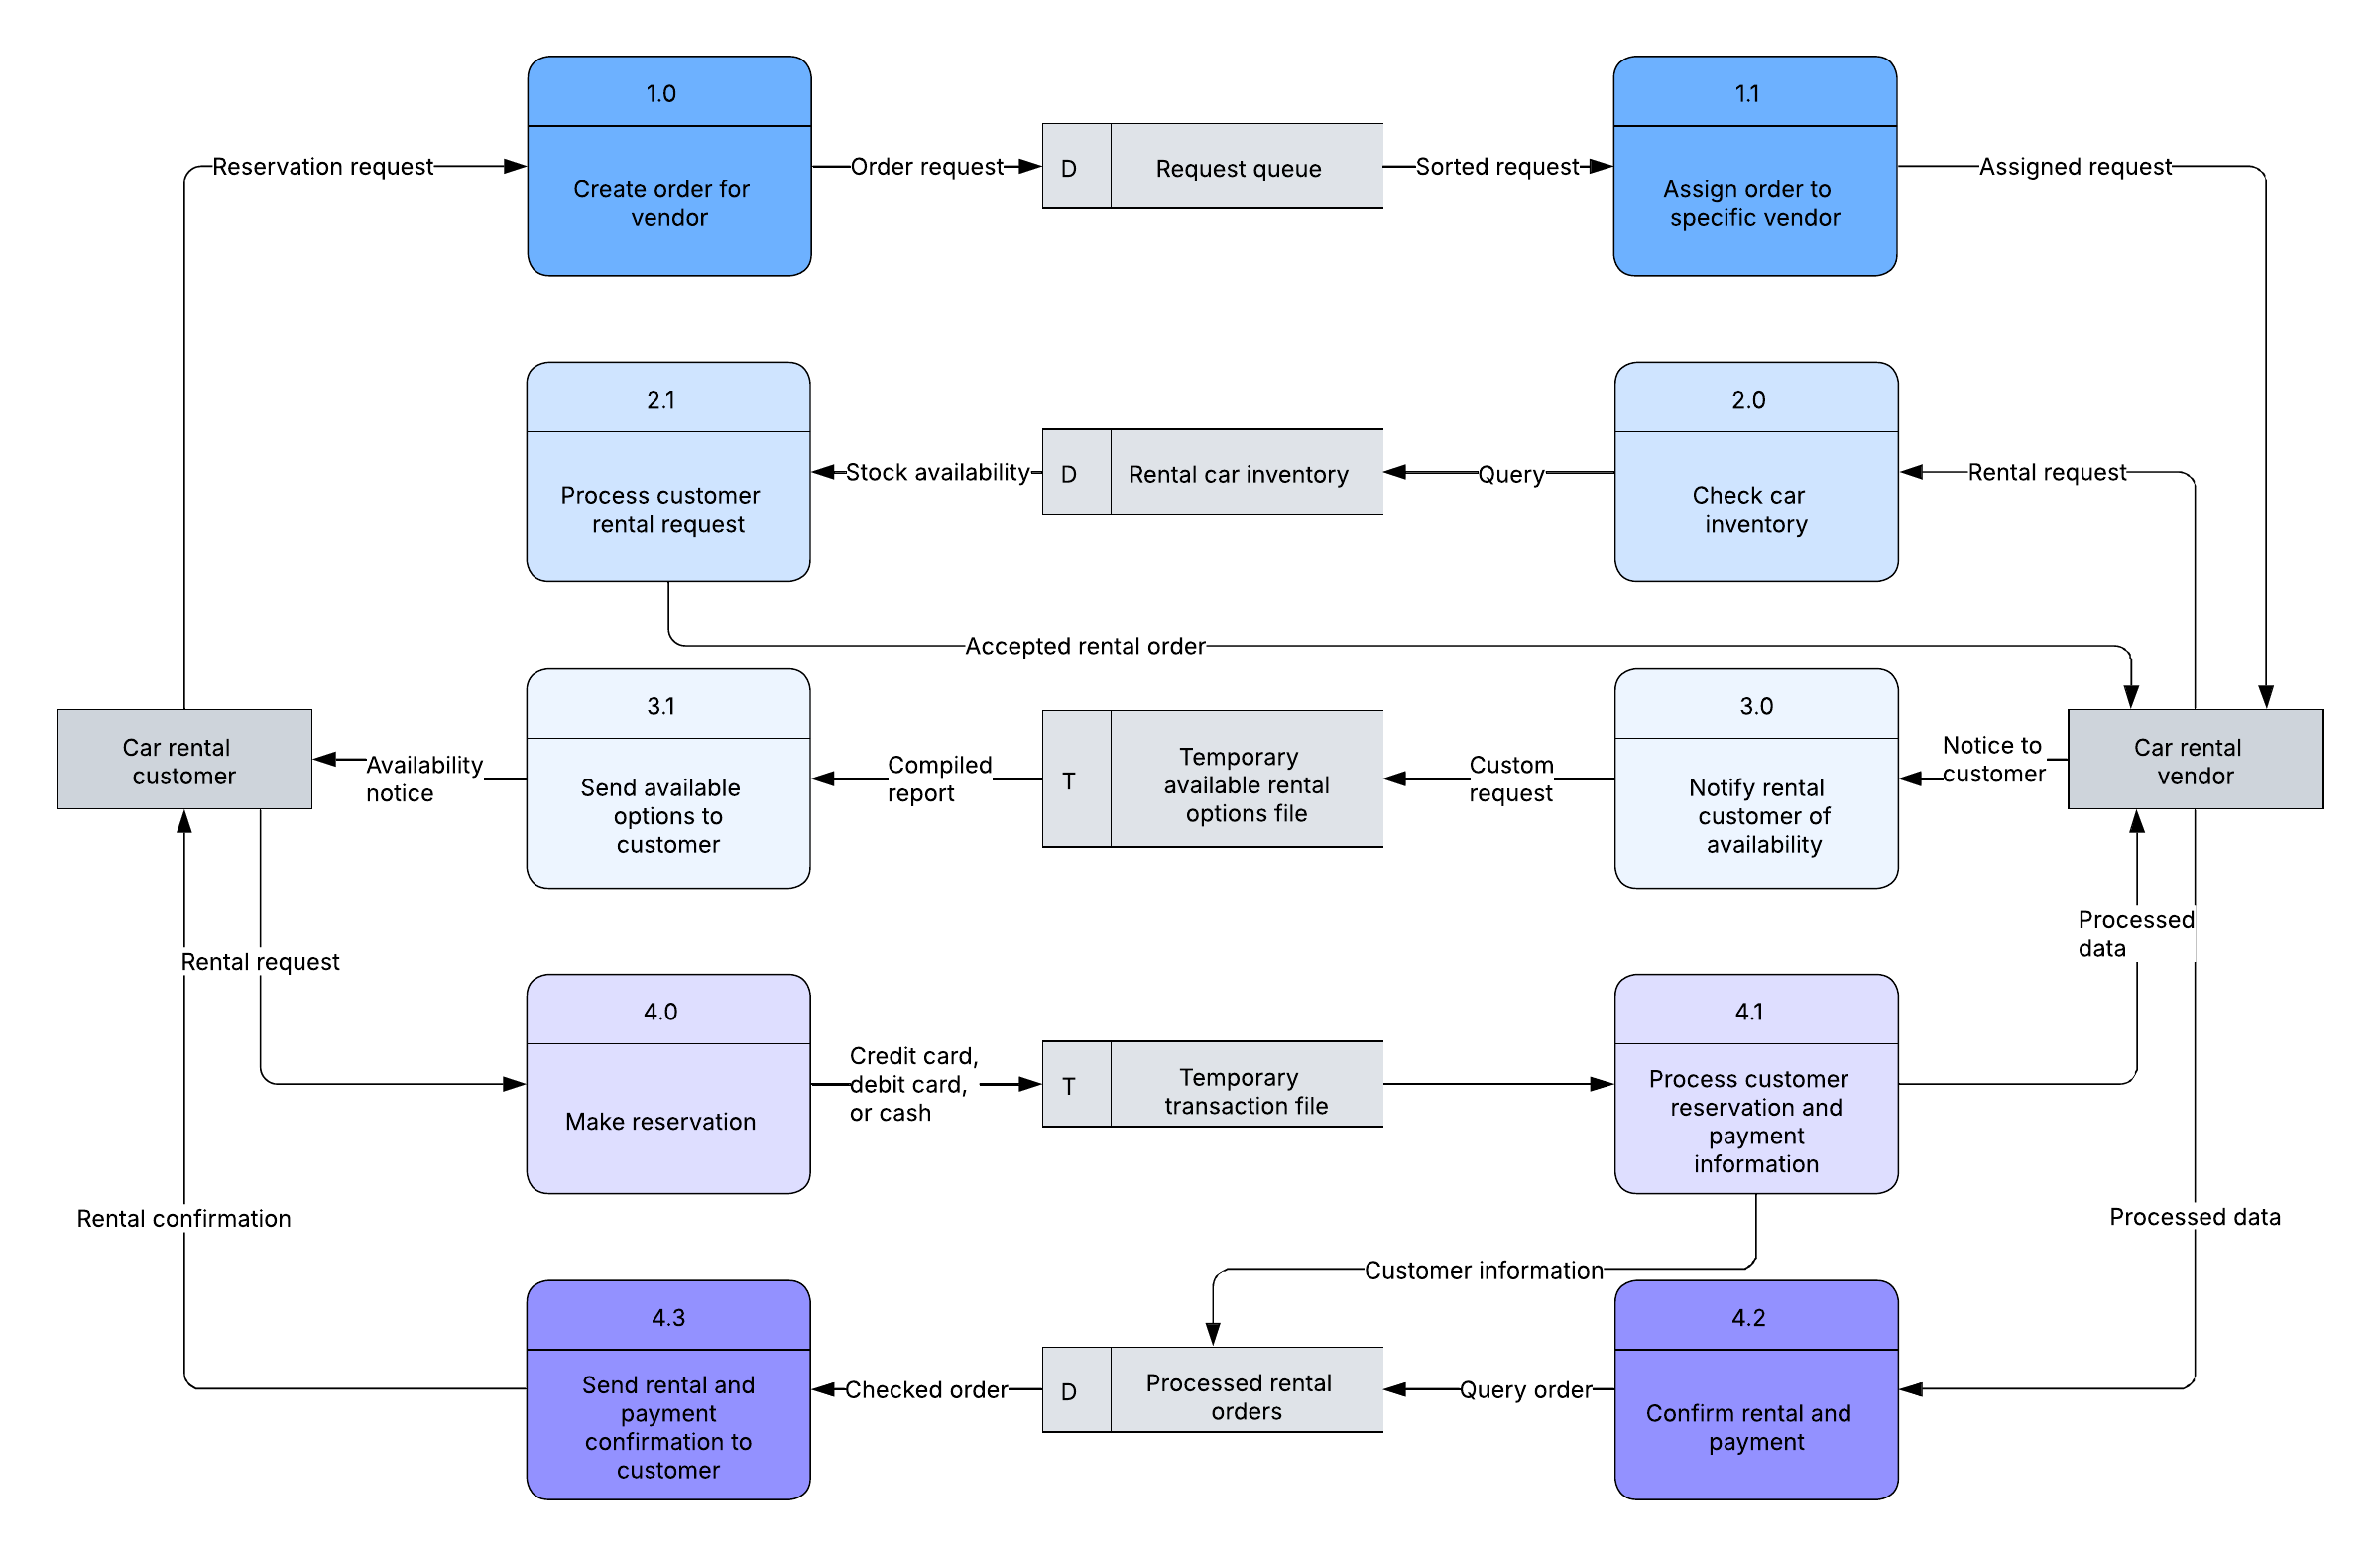
Data flow diagram (physical) example
Pricing:
Paid Account
Data flow diagram (physical) example, Pricing: Paid Account
Helpful resources
Data flow diagram software
Begin working on your DFD online in minutes with our intuitive data flow diagram maker.
How to make a data flow diagram
Learn how you can make a DFD with Lucidchart in just 10 steps. This guide also includes templates to get you started!
Data flow diagram symbols and notations
In this guide, you'll learn about the primary components of data flow diagrams and the symbols used to represent them.
Frequently asked questions about data flow diagrams
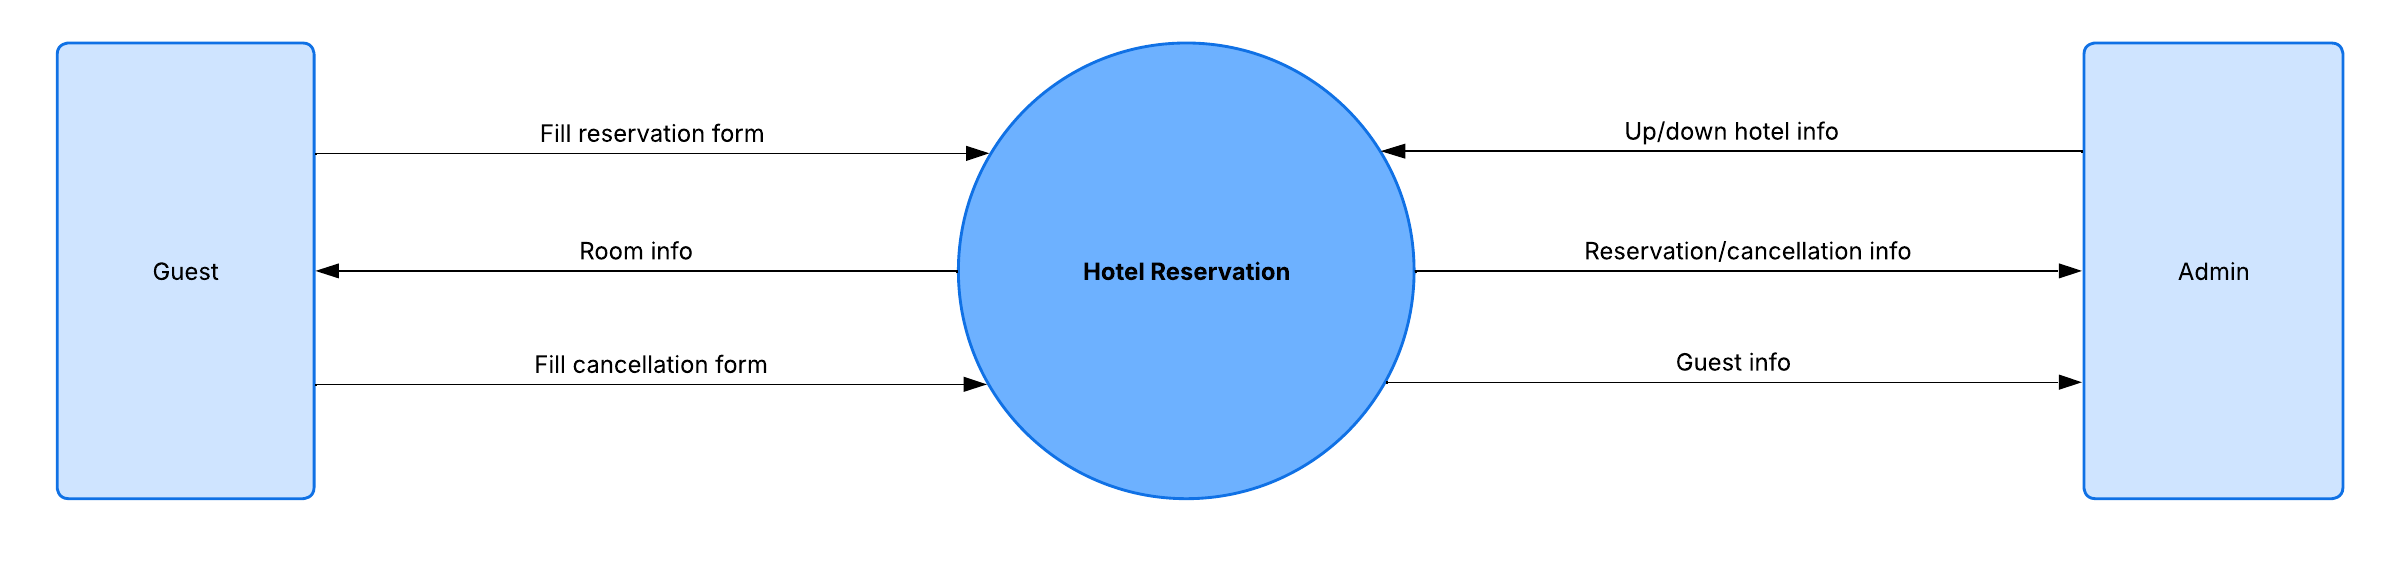
What is a data flow diagram?
What are the main components shown in a data flow diagram?
What symbols are used in a data flow diagram?
What are the different levels of DFDs?
What's the difference between logical and physical data flow diagrams?
Who should use data flow diagrams and why?
Is a data flow diagram still relevant today?
How do I make a data flow diagram?
Everything you need to make a diagram
In addition to our online diagram maker, Lucidchart offers support and training resources to help you branch out to any type of diagram.
View training labs