Planning future development
Before you can design the future state of your cloud infrastructure, you need to understand your current architecture and the changes it will require. Plan with cost and performance in mind to ensure scalable, effective architecture that fits your budget.

Ensure new development fits with existing architecture
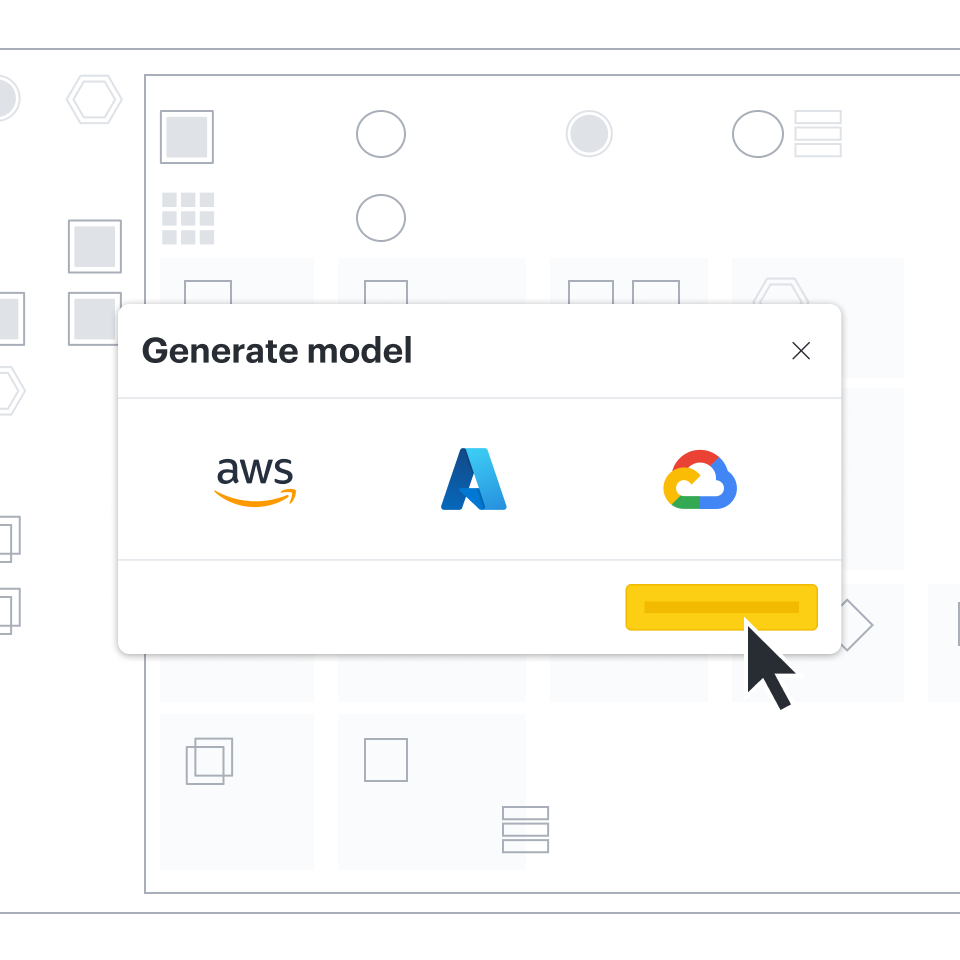
Use Lucidscale to create up-to-date diagrams as your starting point for new architecture designs to check that new development will work with existing infrastructure and to prevent performance issues from occurring later. Additionally, you can use any issues found in your current infrastructure to inform future state changes and iterations.
Enhanced functionality with Lucidchart
Use Lucidscale together with Lucidchart to unlock even more capabilities for maintaining and planning your cloud architecture. Lucidscale gives you insight into your current architecture while Lucidchart helps you design an improved future state.
Share plans with your team
Set your developers up for success
Provide your developers with an easy-to-follow, future state diagram in Lucidchart, using official AWS, Azure, and Google Cloud shapes. Or get them up to speed on current architecture by sharing Lucidscale models and creating saved views to quickly reference a specific context within your diagram, including lines to show connected elements of your architecture.
Security and compliance
Maintain accurate documentation of your cloud environment for security and compliance audits by automatically generating diagrams pulled from cloud provider metadata.
Downtime and incident response
Downtime is really expensive for your organization. Having up-to-date documentation helps your teams align and start resolving issues quicker.
Internal documentation and visibility
Keeping everyone informed and up to date on your cloud environment is essential to using your resources efficiently, and it starts with real-time documentation.
Consulting
Getting up to speed on a client’s cloud environment is time consuming and complex. Automatically generated diagrams make it easier.