Contents
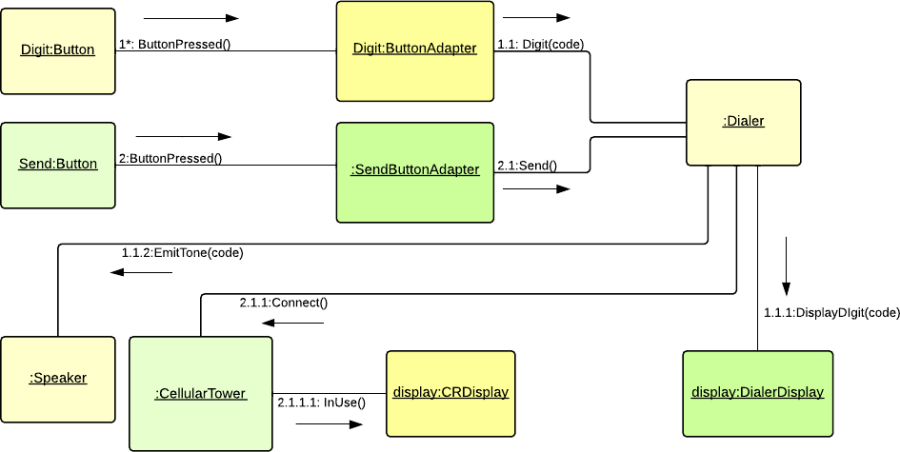
Communication diagram tutorial
6 min
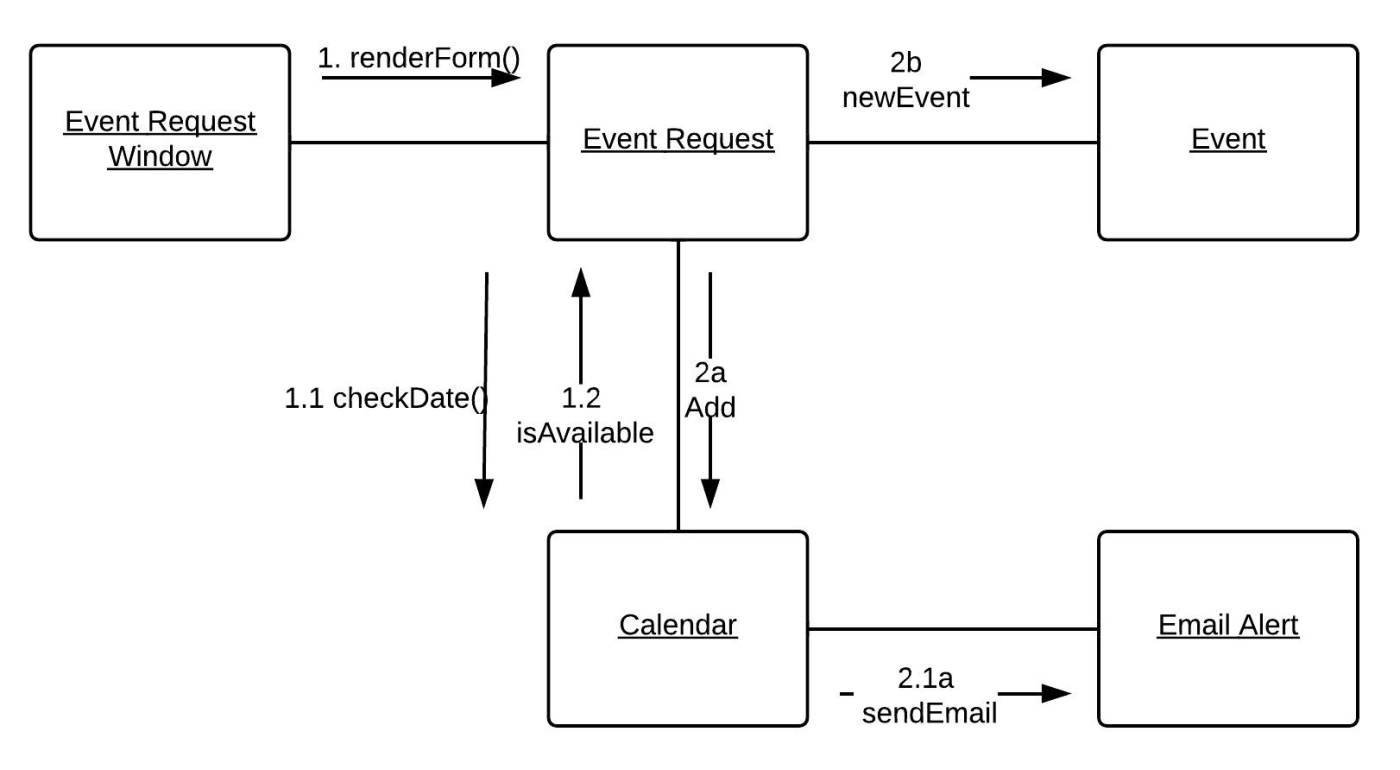
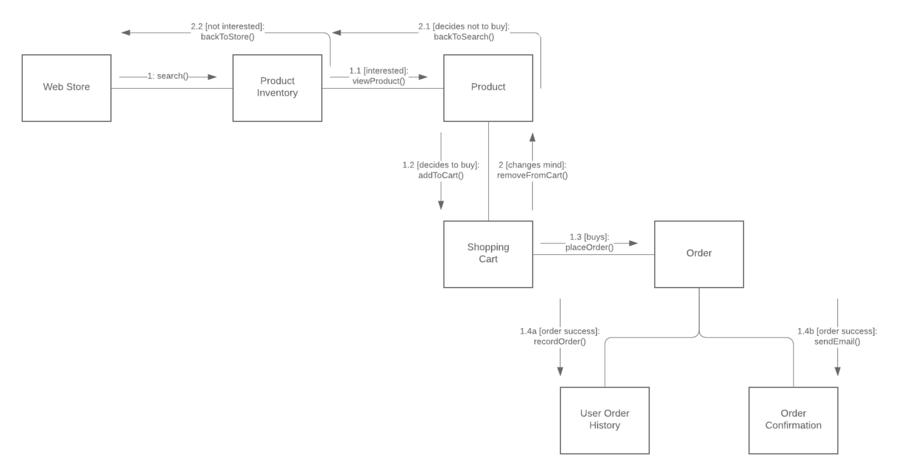
Communication diagram templates and examples
Additional resources
UML diagram maker
No matter the type of UML diagram you need to create, Lucidchart can help you get to work on it right away, with detailed shape libraries, hundreds of templates, AI diagram generation, and more.
UML diagram tutorial
Read our comprehensive guide to learn the definition of UML, the 14 types of UML diagrams, and the steps for creating a UML diagram.
Deployment diagram tutorial
Continue your UML education! Deployment diagrams describe the physical deployment of information generated by the software program on hardware components.
Frequently asked questions about communication diagrams
What is a communication diagram?
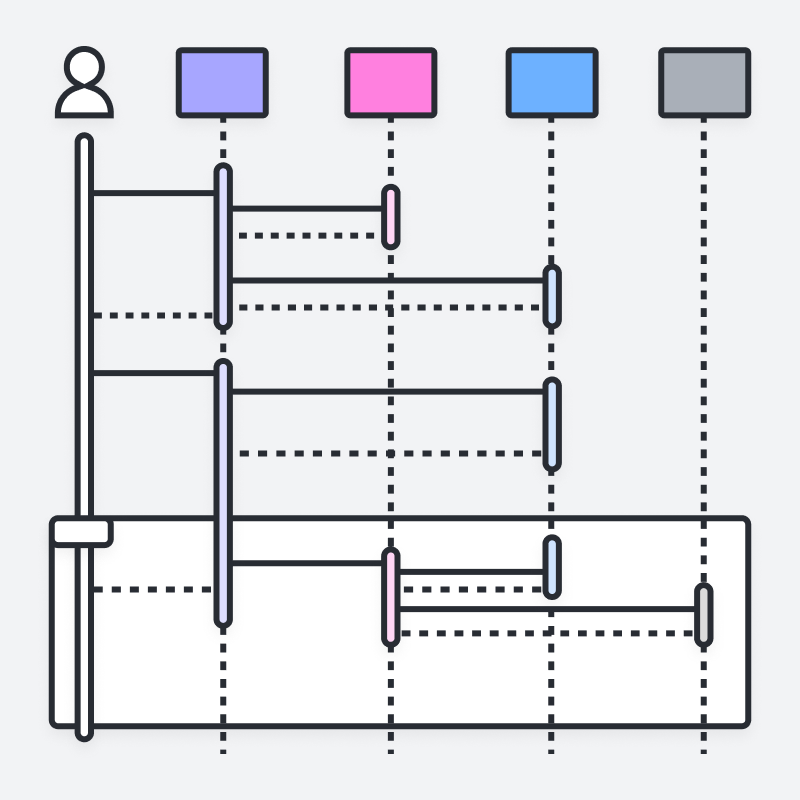
How does a communication diagram differ from a sequence diagram?
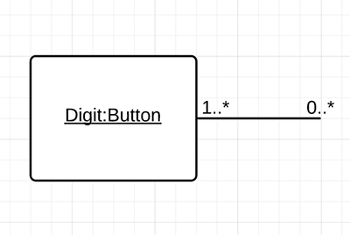
What are the basic symbols used in communication diagrams?
When should I use a communication diagram?
How do sequence numbers work in communication diagrams?
Can I create communication diagrams in Lucidchart?
Do communication diagrams use swimlanes?
Can I convert between communication and sequence diagrams?
Everything you need to make a UML diagram
In addition to our online UML diagram tool, Lucidchart offers support and training resources to help you branch out to any type of diagram.
Make a diagram