Studies show that interactivity increases engagement, opens in a new tab, which often increases retention of information as well. In previous articles, we’ve explained the importance of visual content, and we still mean it! Why not take it one step further and make interactive diagrams as well? With two simple Lucidchart features—hotspots and layers—visual and interactive diagrams are just a few clicks away.
Lucidchart layers
Lucidchart layers
Lucidchart layers, opens in a new tab allow you to overlay multiple elements of a diagram and control which ones are seen at any given time. To add a layer to your diagram, select the layers icon from the bottom-right corner of the canvas. This will bring up the layer context menu where you can select + Layer.
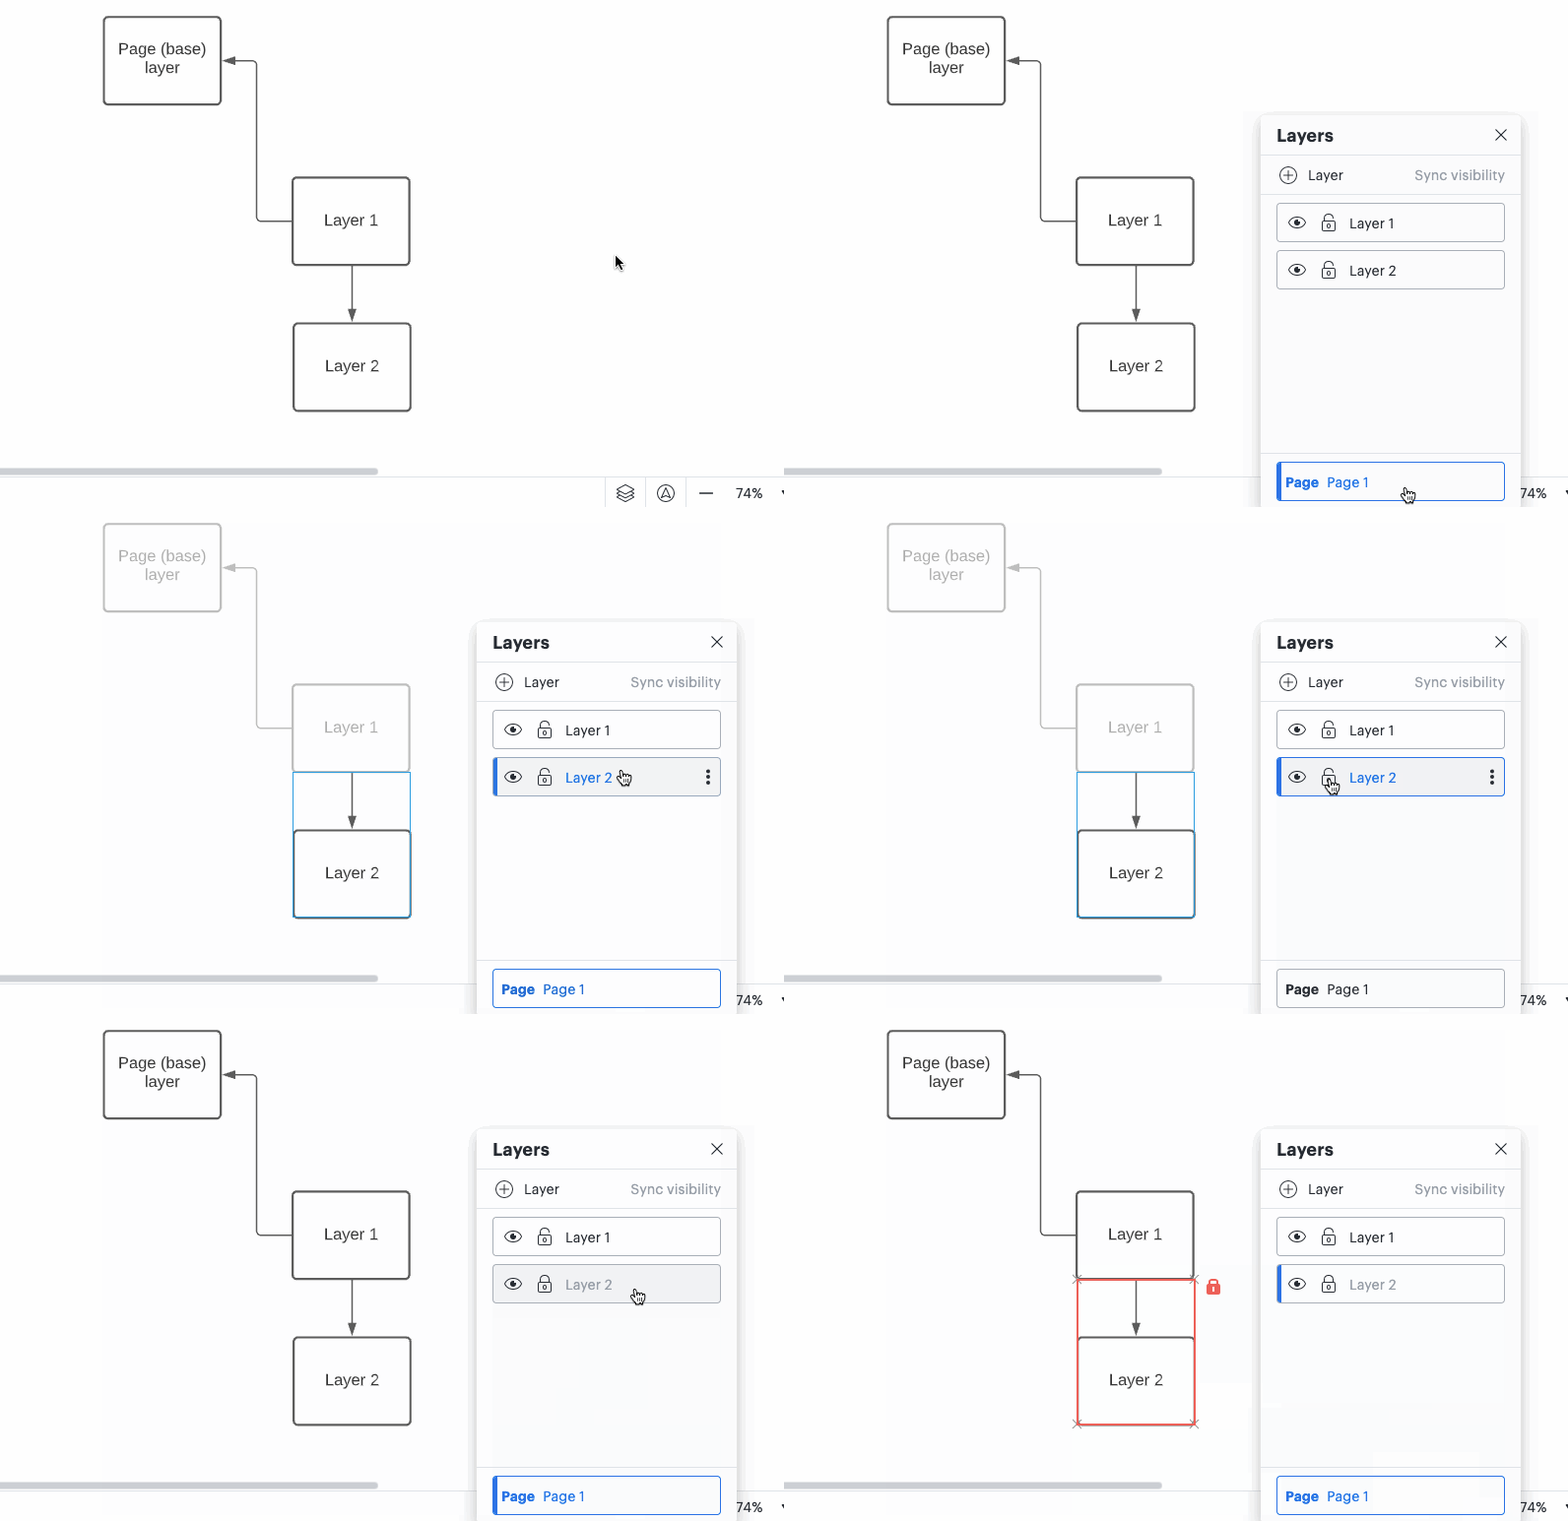
To edit a layer, click on the name of the layer in the layer context menu or double-click on a shape that is part of the layer you want to edit. You can hide a layer by selecting the eye icon next to the name of the layer.

Learn how to create and leverage layers in Lucidchart.
Learn nowHotspots
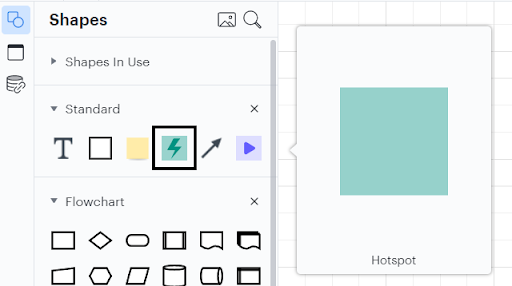
Use hotspots to make static elements interactive. With a hotspot, you can toggle between Lucidchart layers, pages in your Lucidchart document, link to external content, or hop from one Lucid document to another. To add a hotspot, drag and drop the green square with a lightning icon from the standard shape library.
To add an action to a hotspot, select the hotspot and then click the gear icon.

Learn more about the difference between using hotspots, Actions, and link previews in Lucidchart to make interactive diagrams.
Read moreMaking interactive diagrams
There is no limit to the number of ways you can combine hotspots, layers, and other Lucidchart features to make interactive diagrams. But to get you started, here are a few ideas.
1. Make an interactive wireframe or mockup
Use Lucidchart to make wireframes and mockups online that not only look but also act like real websites and mobile applications. For example, create multiple pages in your document to mock up different pages of a website. Then, use hotspots to make buttons that will actually navigate from one page to the next. To do this, select the “Link to Page” option in the hotspot menu.
You can create a pop-up that works with a combination of layers and hotspots. First, add a new layer and design your pop-up. Then, on your main wireframe, add a hotspot with the functionality “Show Layers.” This hotspot will allow you to open the pop-up. Do this by right-clicking a hotspot and selecting More actions > Add action > Layers. From there, select the layers you’d like to show.
2. Compare current and future states of a new workflow or feature
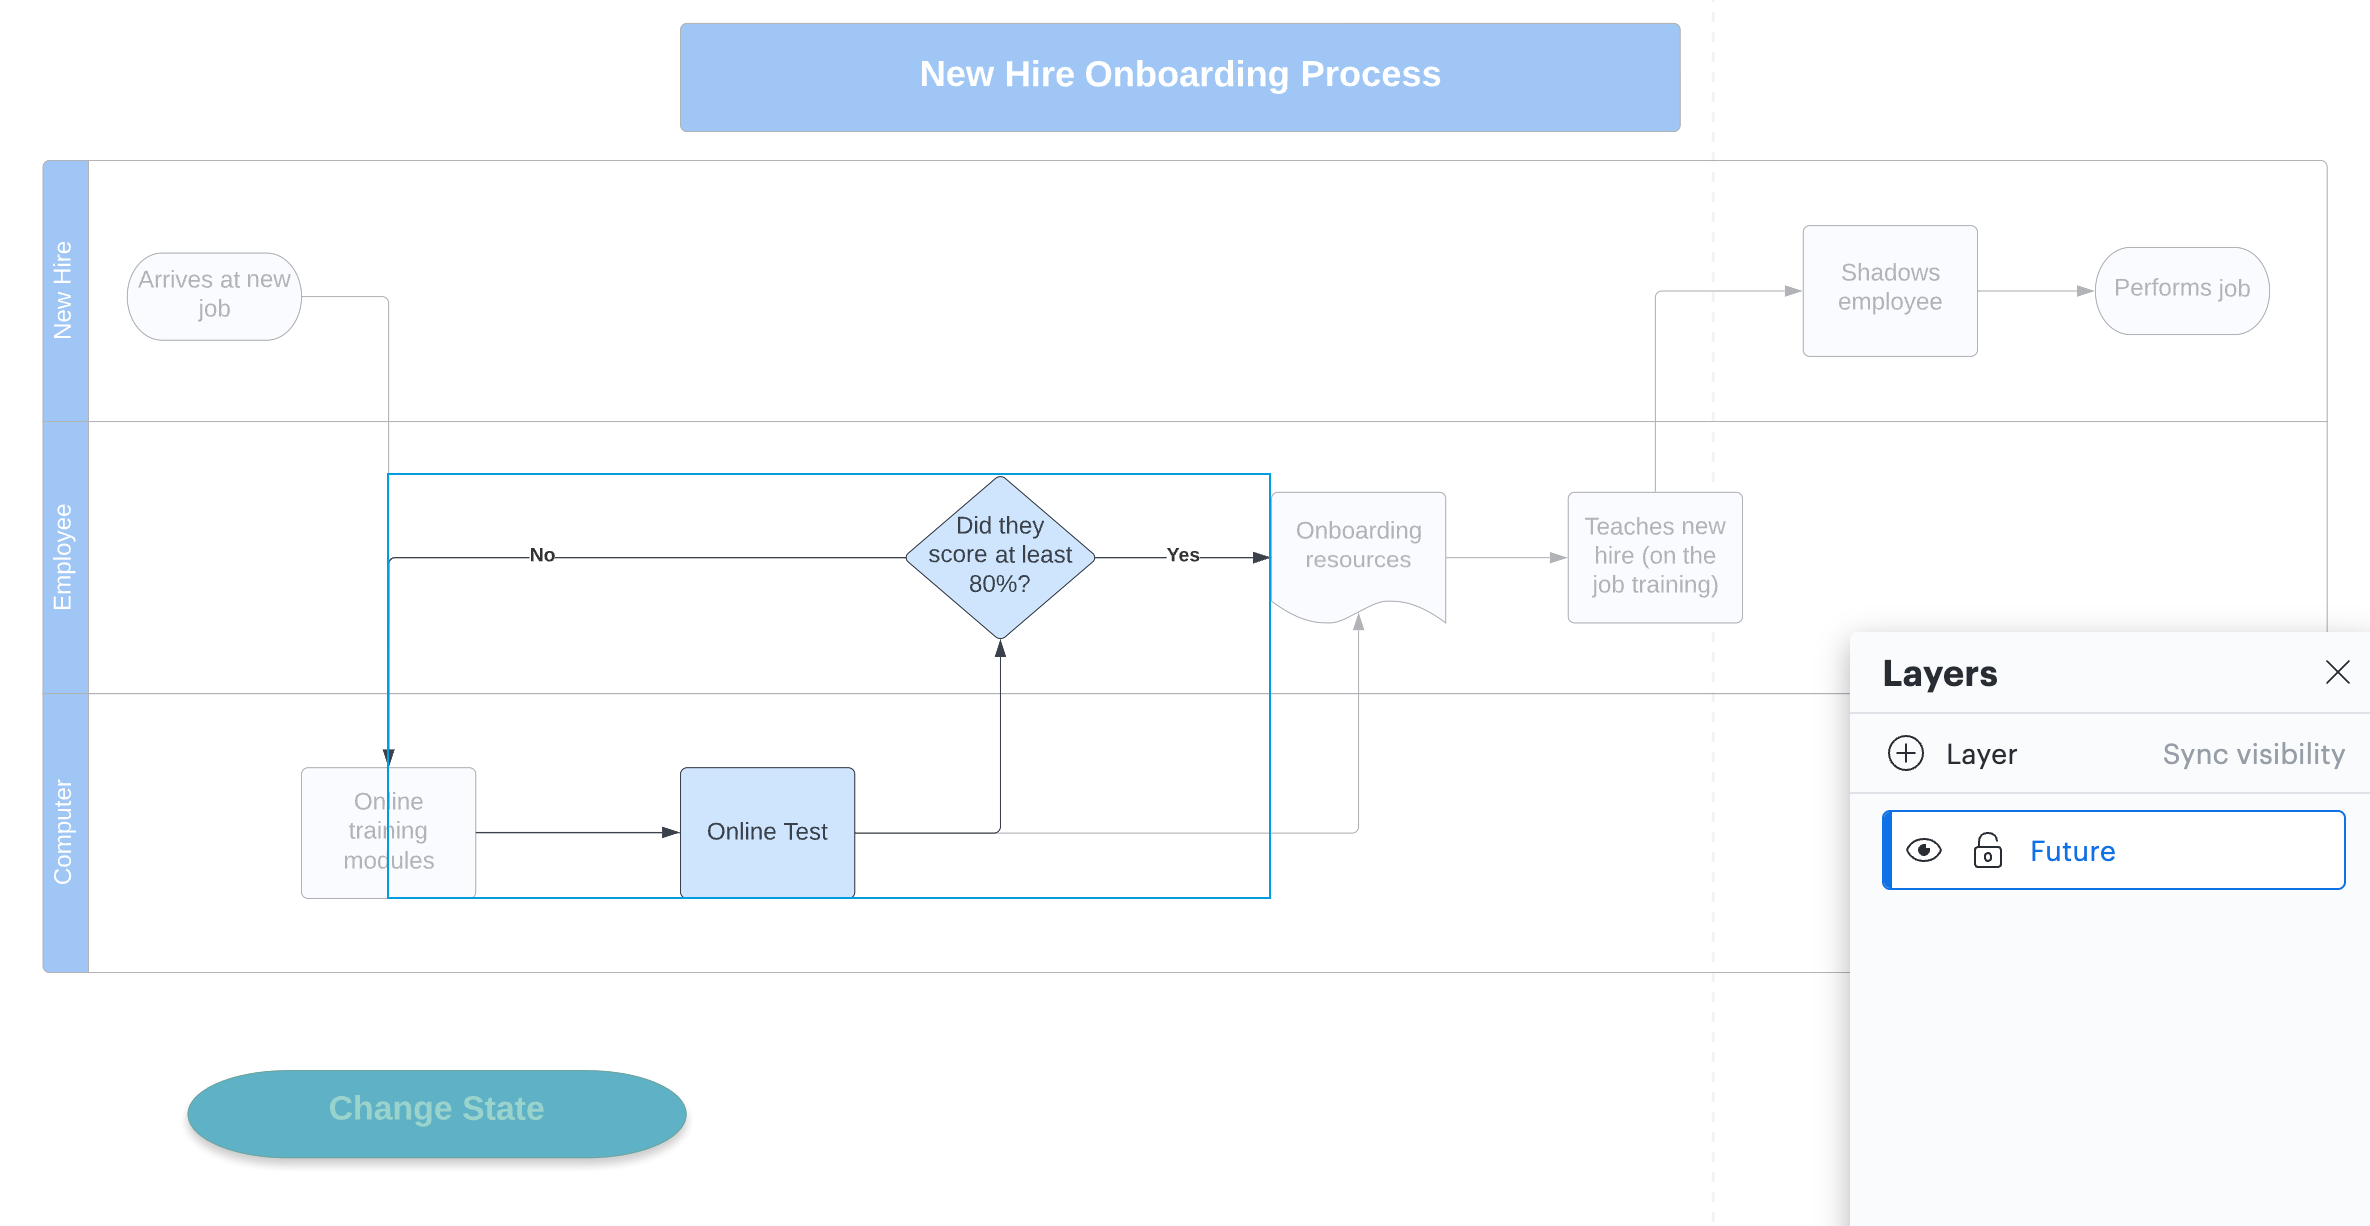
You can use hotspots and layers to propose or compare current and future states of an existing diagram. For instance, a software developer could present their idea for a new development project. To do so, they would find existing documentation of a network or application and then use layers to show how their new piece of hardware or code would fit into the existing system.
A process analyst might introduce changes to a process in a similar way. They would diagram the as-is process and then use a layer and a hotspot to switch between the current state and the to-be diagrams for emphasis.
3. Divide large diagrams into smaller pieces
Sometimes, diagrams get so large that they become difficult to see and understand. For example, comprehensive org charts at large companies can quickly get out of hand. Break large diagrams into more manageable pieces using multiple document pages. Then, link the pages together using hotspots.
4. Link to documents and resources
Use hotspots to link to documents and resources that are stored outside of Lucidchart. For example, diagram an email flow in Lucidchart then use a hotspot to link to the actual text of each email in Google Docs, DropBox, or elsewhere. Doing so allows you to take advantage of visual thinking while staying connected to all of your resources.
Using Lucidchart layers and hotspots in any diagram can offer added context for collaborators, help you plan and track changes, and even make your diagrams central repositories for projects.

Give layers and hotspots a try!
Jump into Lucidchart