If you've never experienced a disorganized brainstorming session, here's what it's like: The team shows up with different understandings of the purpose for the session. When brainstorming starts, one person tends to contribute most of the ideas, while another team member is completely checked out, secretly placing a lunch order. The ideas the team generates are difficult to make sense of and not as creative as they could be.
Enter the brilliance of the affinity diagram. The affinity diagramming method involves your entire team in generating ideas, categorizing thoughts, and prioritizing topics. The best part is that affinity diagrams are especially useful for sorting and organizing large amounts of ideas, which makes them great for big teams, difficult issues, and complex ideas. They're also a practical way to create an environment where everyone has a voice and early-stage conflict is minimized, allowing the group to capture more natural, authentic ideas before overanalyzing them.
In this article, we'll walk you through how to use a cloud-based affinity diagram to make the most out of your team's time together.
What is an affinity diagram?
The affinity diagram was invented by a Japanese anthropologist named Jiro Kawakita in the 1960s. In fact, affinity diagrams were originally referred to as "KJ" diagrams in his honor. Kawakita was influenced by philosophers such as Kant, Hegel, and Bergson and was interested in solving complex problems, including addressing the disintegrating environmental equilibrium in Nepal's Sikha Valley. These days, affinity diagrams are commonly used across many business settings. You may also hear them called affinity charts, affinity maps, or the KJ method.
When to use an affinity diagram
There are two ideal times to use an affinity diagram:
-
To solve a complex problem. This situation will inherently require sorting through a large amount of data. For instance, if you're overhauling your UX, you'll want to gather ideas from your team about all aspects of UX, from font size to dropdown menus.
-
To gather unique viewpoints. The beginning of the affinity diagram process is largely self-led, which is conducive to generating unique ideas and suggestions.
In practice, teams also lean on affinity diagramming when they need to make sense of messy inputs and align people who don't currently agree.
You can also use affinity diagrams to:
-
Organize the results of a brainstorming session.
-
Improve processes.
-
Mediate professional conflict.
-
Develop innovative solutions.
-
Drive group consensus.
How to create an affinity diagram
To create an affinity diagram, we recommend using a cloud-based platform like Lucid, where you can easily collaborate and share your diagram with your team and store it for future reference.
Here’s how to design your own affinity diagram using Lucidspark, Lucid’s intelligent whiteboarding solution.
1. Choose a leader
It may be you, but if it's not, make sure the designated leader understands how to conduct an affinity diagramming session, how long the brainstorm should be, how to set up the Lucidspark board, and how to coordinate each step of the session.
2. Prepare your board
Set up a brainstorming board in Lucidspark and share it with participants. The more diverse perspectives, the better and more unique the solutions. Consider keeping the working group small enough that everyone can meaningfully participate in the sorting and labeling steps.
3. Present the problem
Define the problem to be solved and make sure it is visible on your board during the brainstorm. You could simply label your diagram with the problem or put it in a box at the top of your diagram to keep everyone aligned throughout the session. For best results, phrase the prompt as a question, such as "How can we improve time management at the office?" so the board naturally invites solutions.
4. Start the brainstorm
This part of the session is self-directed. Each member of your team should be assigned a collaborator color and encouraged to contribute as many ideas as they can. Unlike a typical brainstorm, where the team talks and generates ideas together, affinity diagram brainstorms are usually conducted in silence. With Lucidspark, you can set a timer to encourage the team to contribute as many ideas as possible within the given time. Remember, the idea is to welcome volume and a variety of ideas.
5. Organize the ideas
At the end of your brainstorm, you'll have a large number of ideas. This can seem overwhelming at first, but this next part is especially fun: clustering the data into topics.
Use Containers on your Lucidspark board to organize ideas by themes as they emerge from your brainstorm. For instance, if you notice that, some of your solutions involve using a different content management platform, you could group those together and label them as "content management solutions."
It's important you involve the entire team, though the leader may offer suggestions for labeling the containers. If there are duplicate ideas, simply delete one. Lucidspark makes this step easy, as virtual sticky notes can be infinitely dragged and dropped and easily organized.
Keep the grouping step silent to reduce bias, prevent louder voices from steering the discussion, and let people rely on their first instincts rather than debate. If an idea doesn't seem to fit anywhere, it's fine to leave it on its own. And if a note keeps getting moved between groups, consider duplicating it and placing a copy in each relevant cluster to reduce friction and acknowledge overlap. Depending on the complexity of the topic, you may even let the sorting run asynchronously so people can add and regroup over time.
6. Step back
Once the ideas have been organized into containers, it's time to step back and look at your affinity diagram. There are normally some interesting findings that can be seen right away. These patterns will guide you to the next steps, such as prioritizing ideas and determining the best solutions.
At this point, bring the group together to agree on labels for each cluster. You can use the most representative note as the label or create a new title that captures the theme. If multiple clusters feel closely related, add a higher-level "superheader" to combine them and make the diagram easier to interpret.
Affinity diagram example
Let's practice with an affinity mapping example. Say your content team wants to produce more content than they currently are, but they keep getting bogged down with inefficiencies. You can use an affinity diagram to identify bottlenecks and develop solutions to resolve them.
To start, create a Lucidspark document with the title "What are the glitches in our content creation process?" After sharing the document with all relevant stakeholders, give them time to record their ideas.
Now, ask everyone to organize their ideas into groups. Some of the sticky notes will get shuffled around, but after a few days, the groups will become clear.
Next, schedule a meeting that all stakeholders attend, and give titles to each grouping with more than one idea.
At this meeting, you will also discuss ways to overcome these glitches. Because they are grouped into categories, it is easier to identify root causes, so instead of solving a large number of individual problems, you’ve narrowed it down to a few overarching obstacles.
Extra tips:
-
Affinity diagram sessions work best when you have more than 15 contributions.
-
Keep the containers broad and the ideas specific.
-
Feel free to remove ideas as you work. Lucid has revision history, allowing you to go back to a previous version of your board, tracking the evolution of ideas. Try not to edit ideas as they're put on the board, as that can discourage team members from contributing.
-
Don't worry about next steps during the brainstorm; they will emerge once the affinity diagram has been fully organized.
-
Keep the process of ideation and grouping silent, or you'll inadvertently limit contributions for fear of rejection or judgment.
-
Don't overthink groupings.
-
If you're working with a distributed team or a complex problem, consider giving people more time than a single meeting, allowing ideas to unfold over a day or two leads to clearer patterns.
How Lucidspark can help you build affinity diagrams
Lucidspark is an efficient way to collaborate and coordinate, especially for remote or hybrid teams. An infinite canvas means infinite possibilities to surface the best ideas. The best part? Everything is updated and saved in real time, which means that your team can get the context they need anytime, no matter where they’re working from.
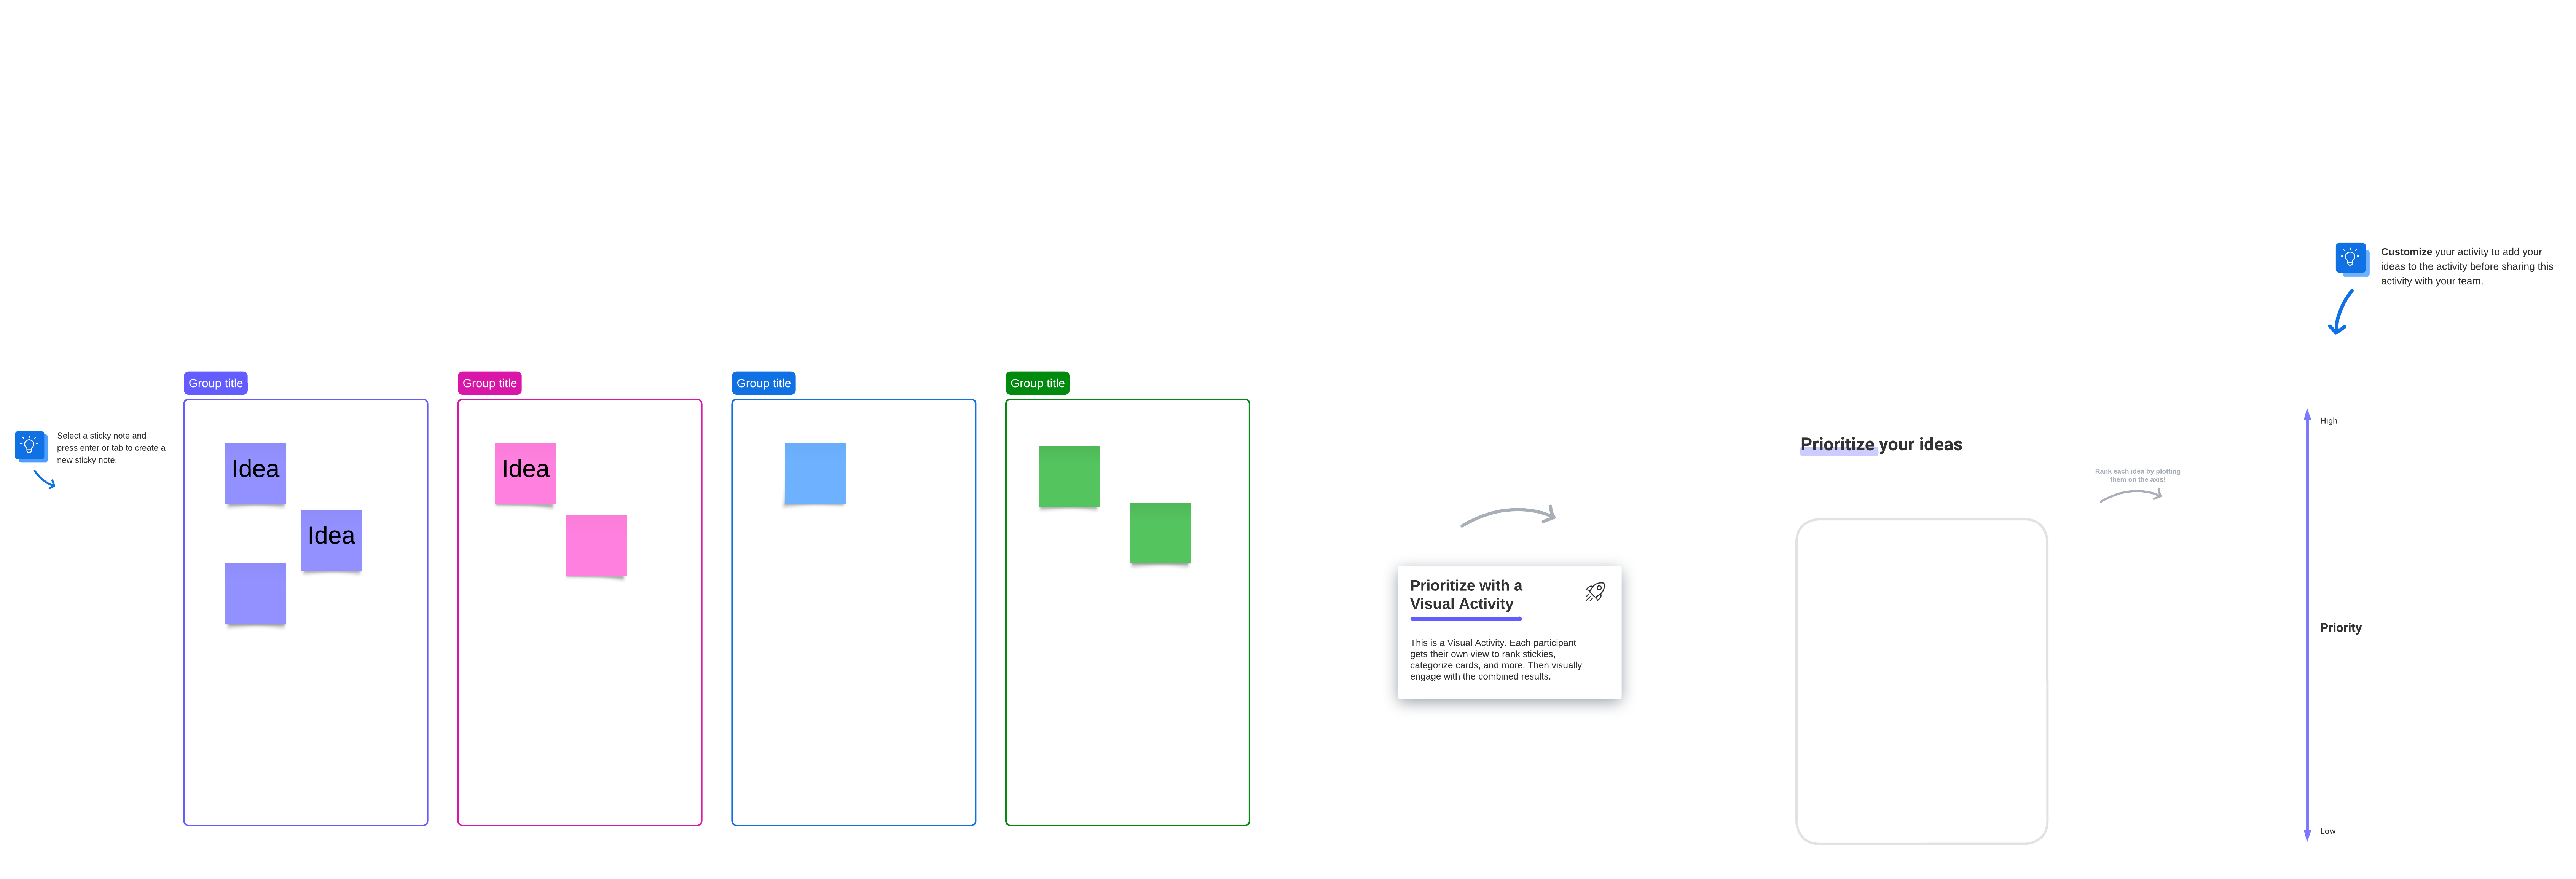
To use Lucidspark to build an affinity diagram online, you can start with an affinity diagram template or from scratch. Since it's likely some members of your team won't be able to attend the brainstorm, you can share the affinity diagram with those who weren't there and ask them to contribute their ideas and interact with the board asynchronously. You can also assign tasks directly from Lucidspark, export contributions to Lucidchart, and transform the affinity diagram into actionable tasks.
Get started today!
Everything you need to whiteboard online
Get the ultimate online whiteboard for teams. Brainstorm, plan projects, and collaborate virtually on Lucidspark’s infinite canvas.
Sign up free