Graphing inequalities
*For all Lucid plan types
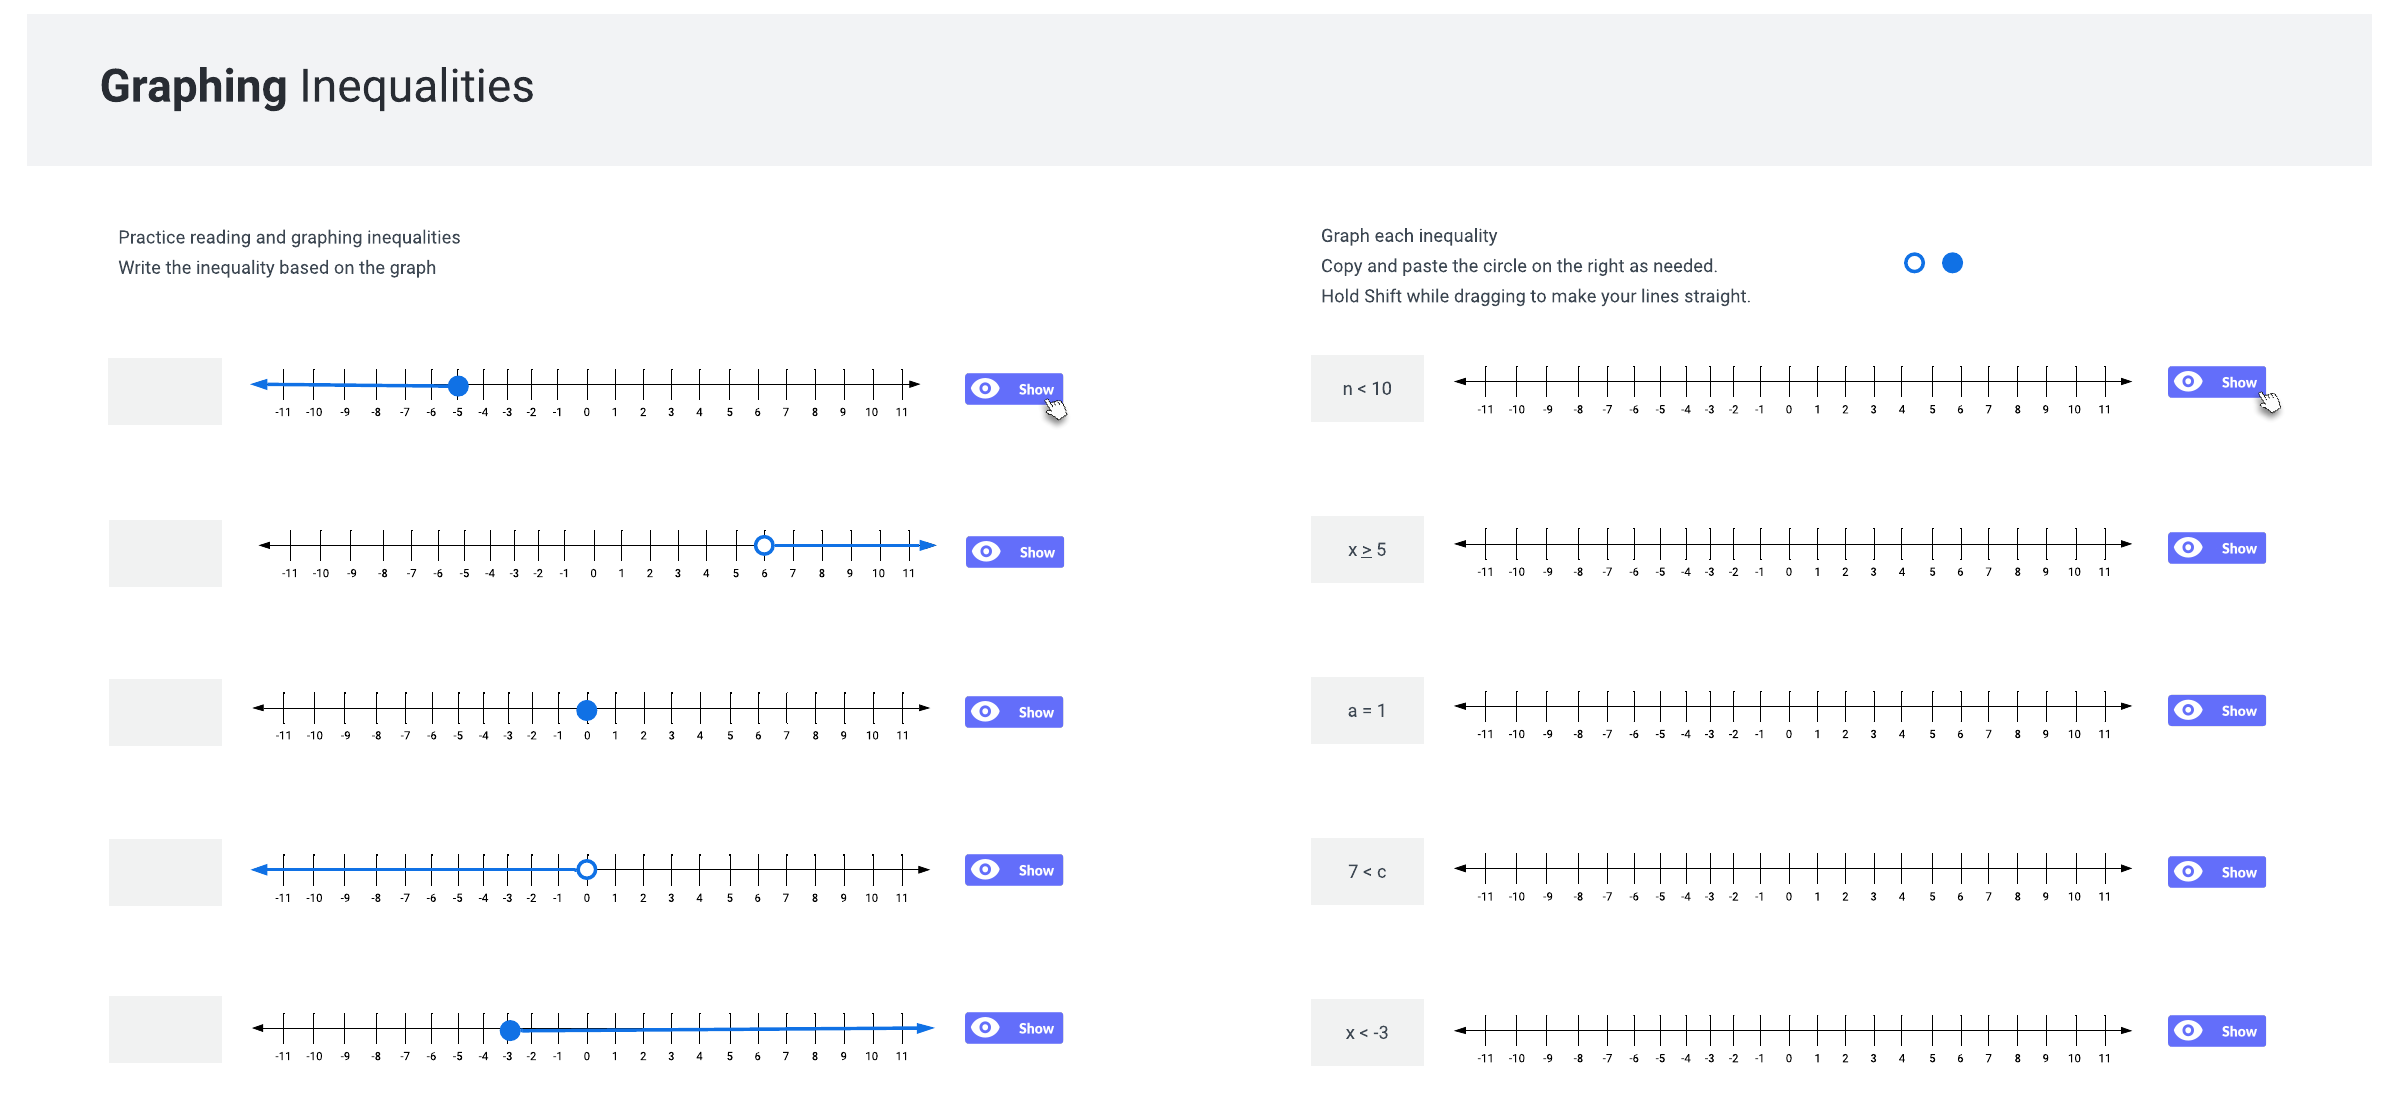
This Inequality graphing template can help you:
-
Visually represent linear inequalities on a coordinate plane with clarity.
-
Guide students step-by-step in identifying shaded regions and boundary lines.
-
Reinforce understanding of inequality concepts and solution sets.
Open this template to view this interactive inequality graphing tool that you can customize for your classroom.
Resource for algebra, pre-calculus, and geometry courses in both K-12 and higher education. It's perfect for introducing new concepts, providing guided practice, or serving as a review tool. This interactive approach makes learning about inequalities both intuitive and enjoyable for all learners.