Google Cloud cloud performance diagram example
*For Team and Enterprise plans
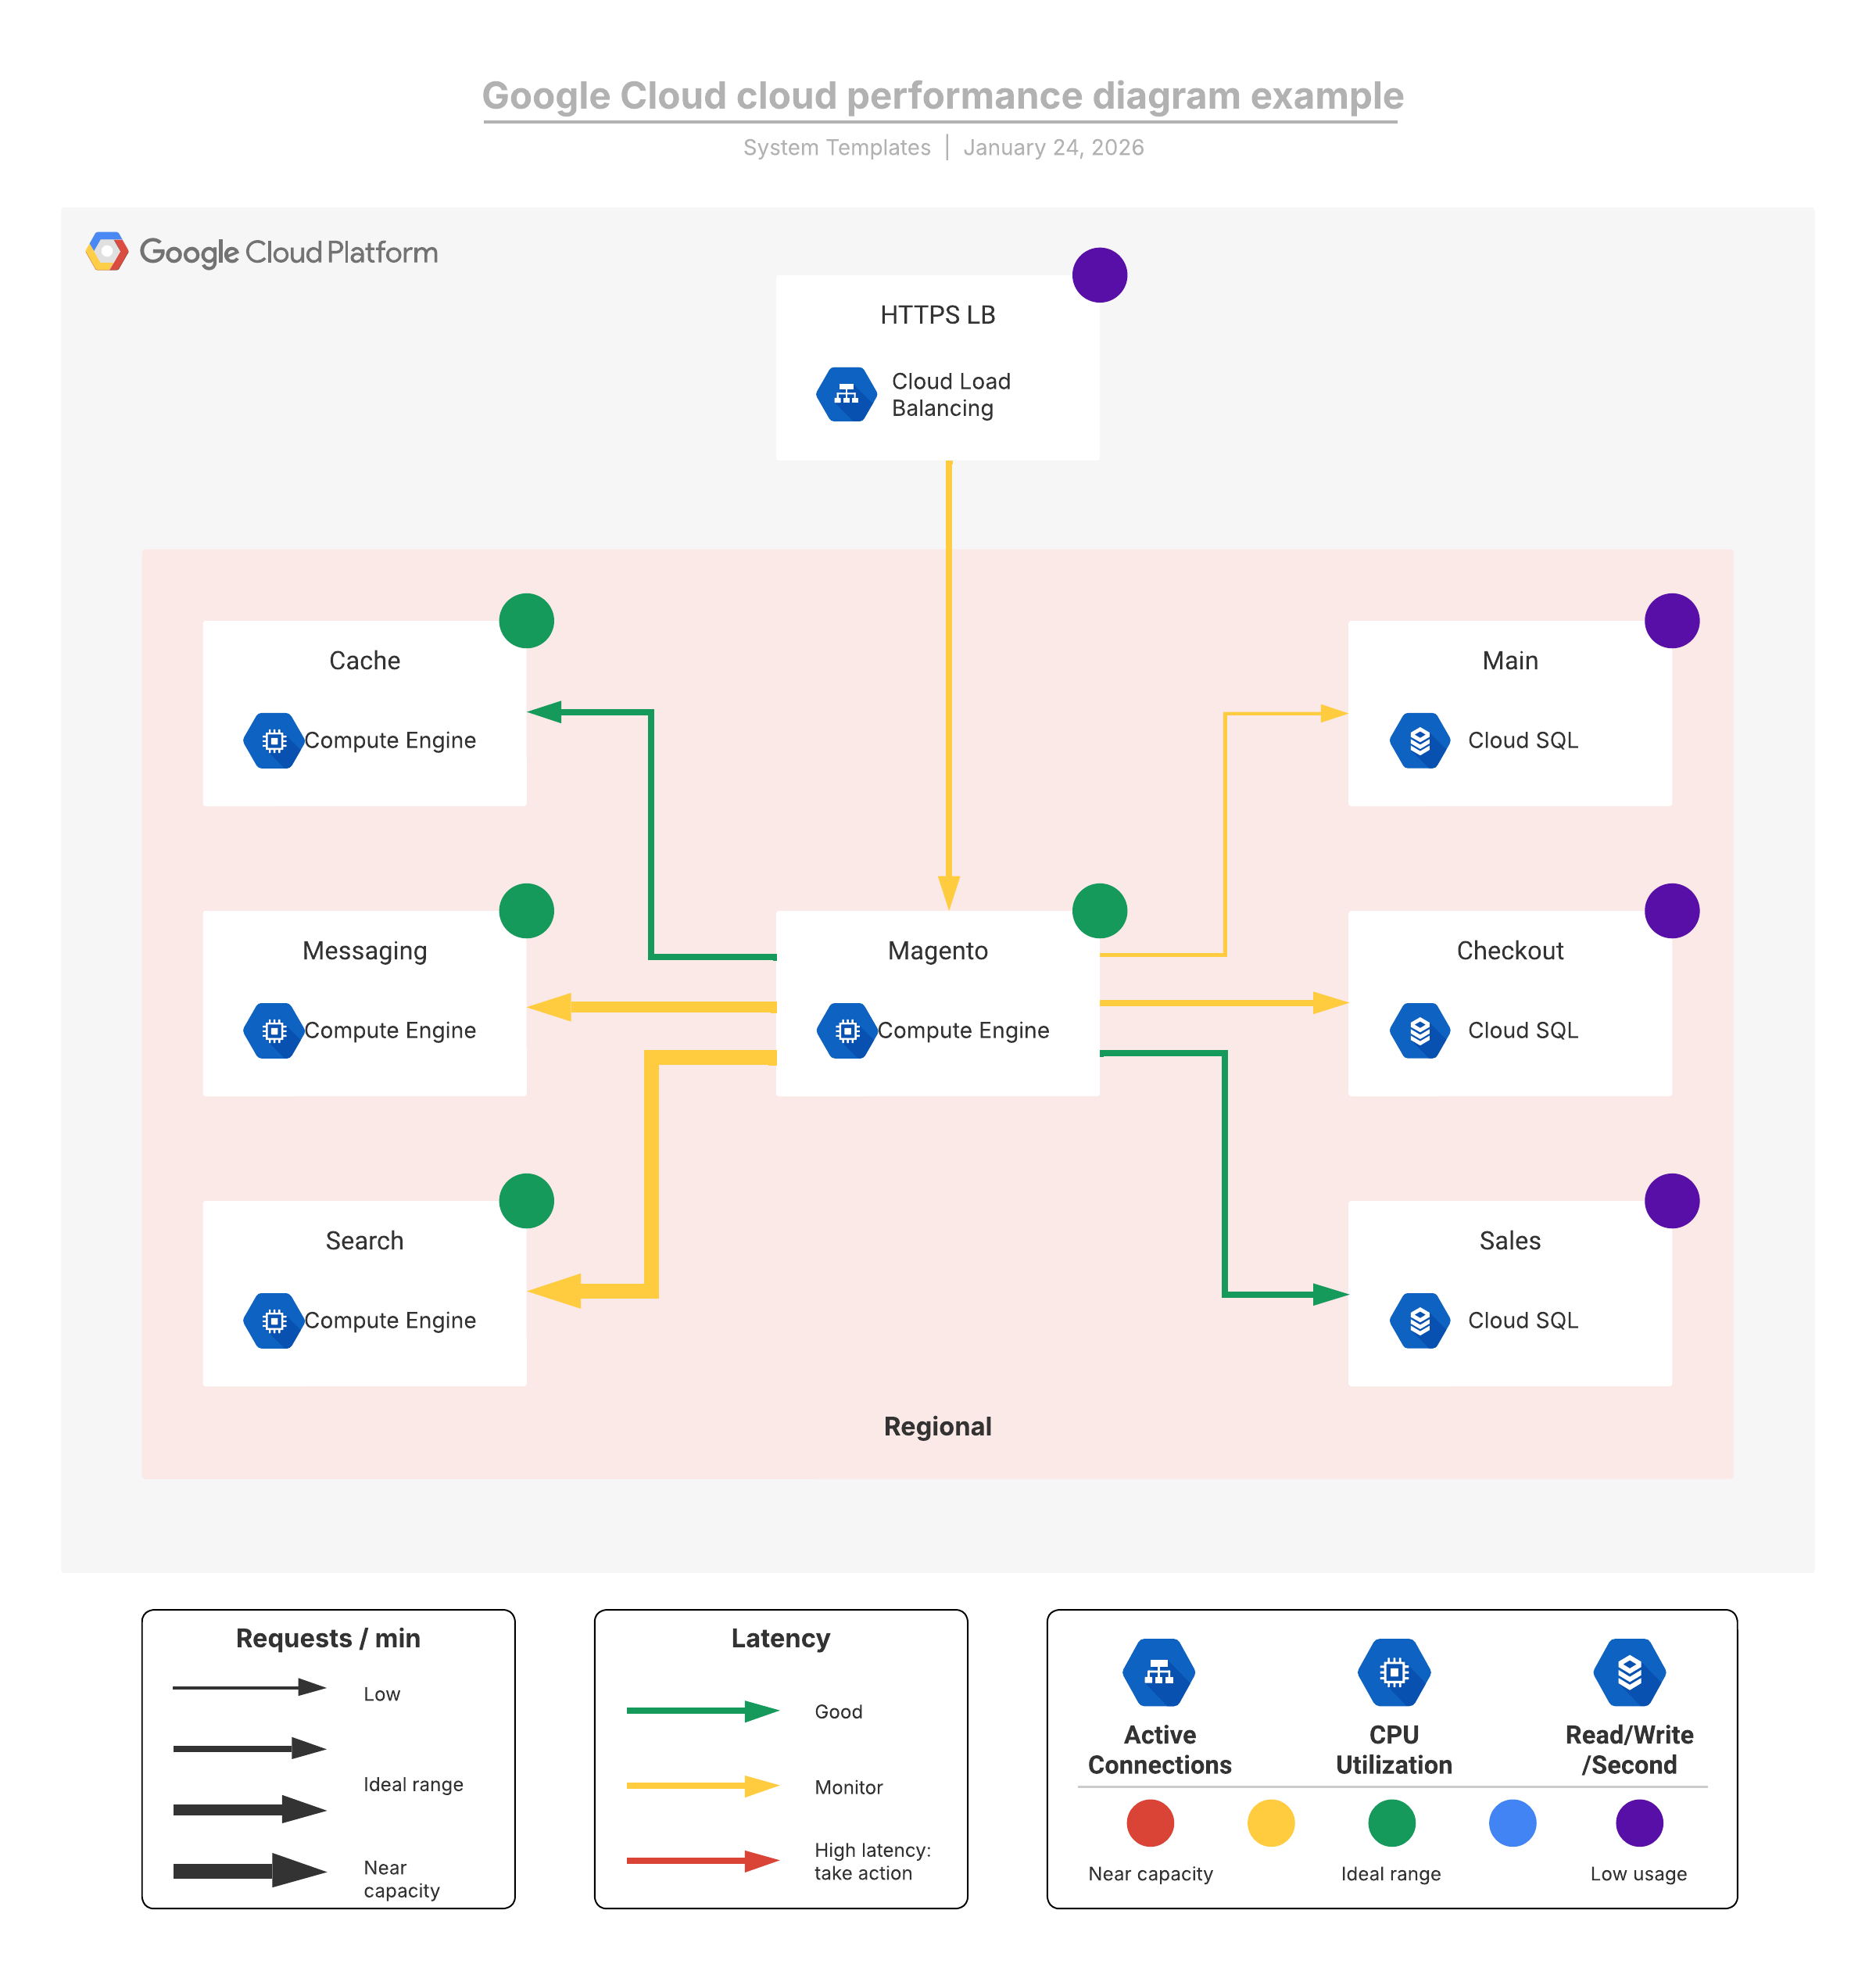
This Google Cloud cloud performance diagram example template can help you:
- Visualize your Google Cloud architecture at a high-level.
- Gain insights about the performance and overall health of your Google Cloud instance.
- Reduce troubleshooting time and easily identify areas for scaling back.
Open this template to view a detailed example of a Google Cloud cloud performance diagram that you can customize to your use case.