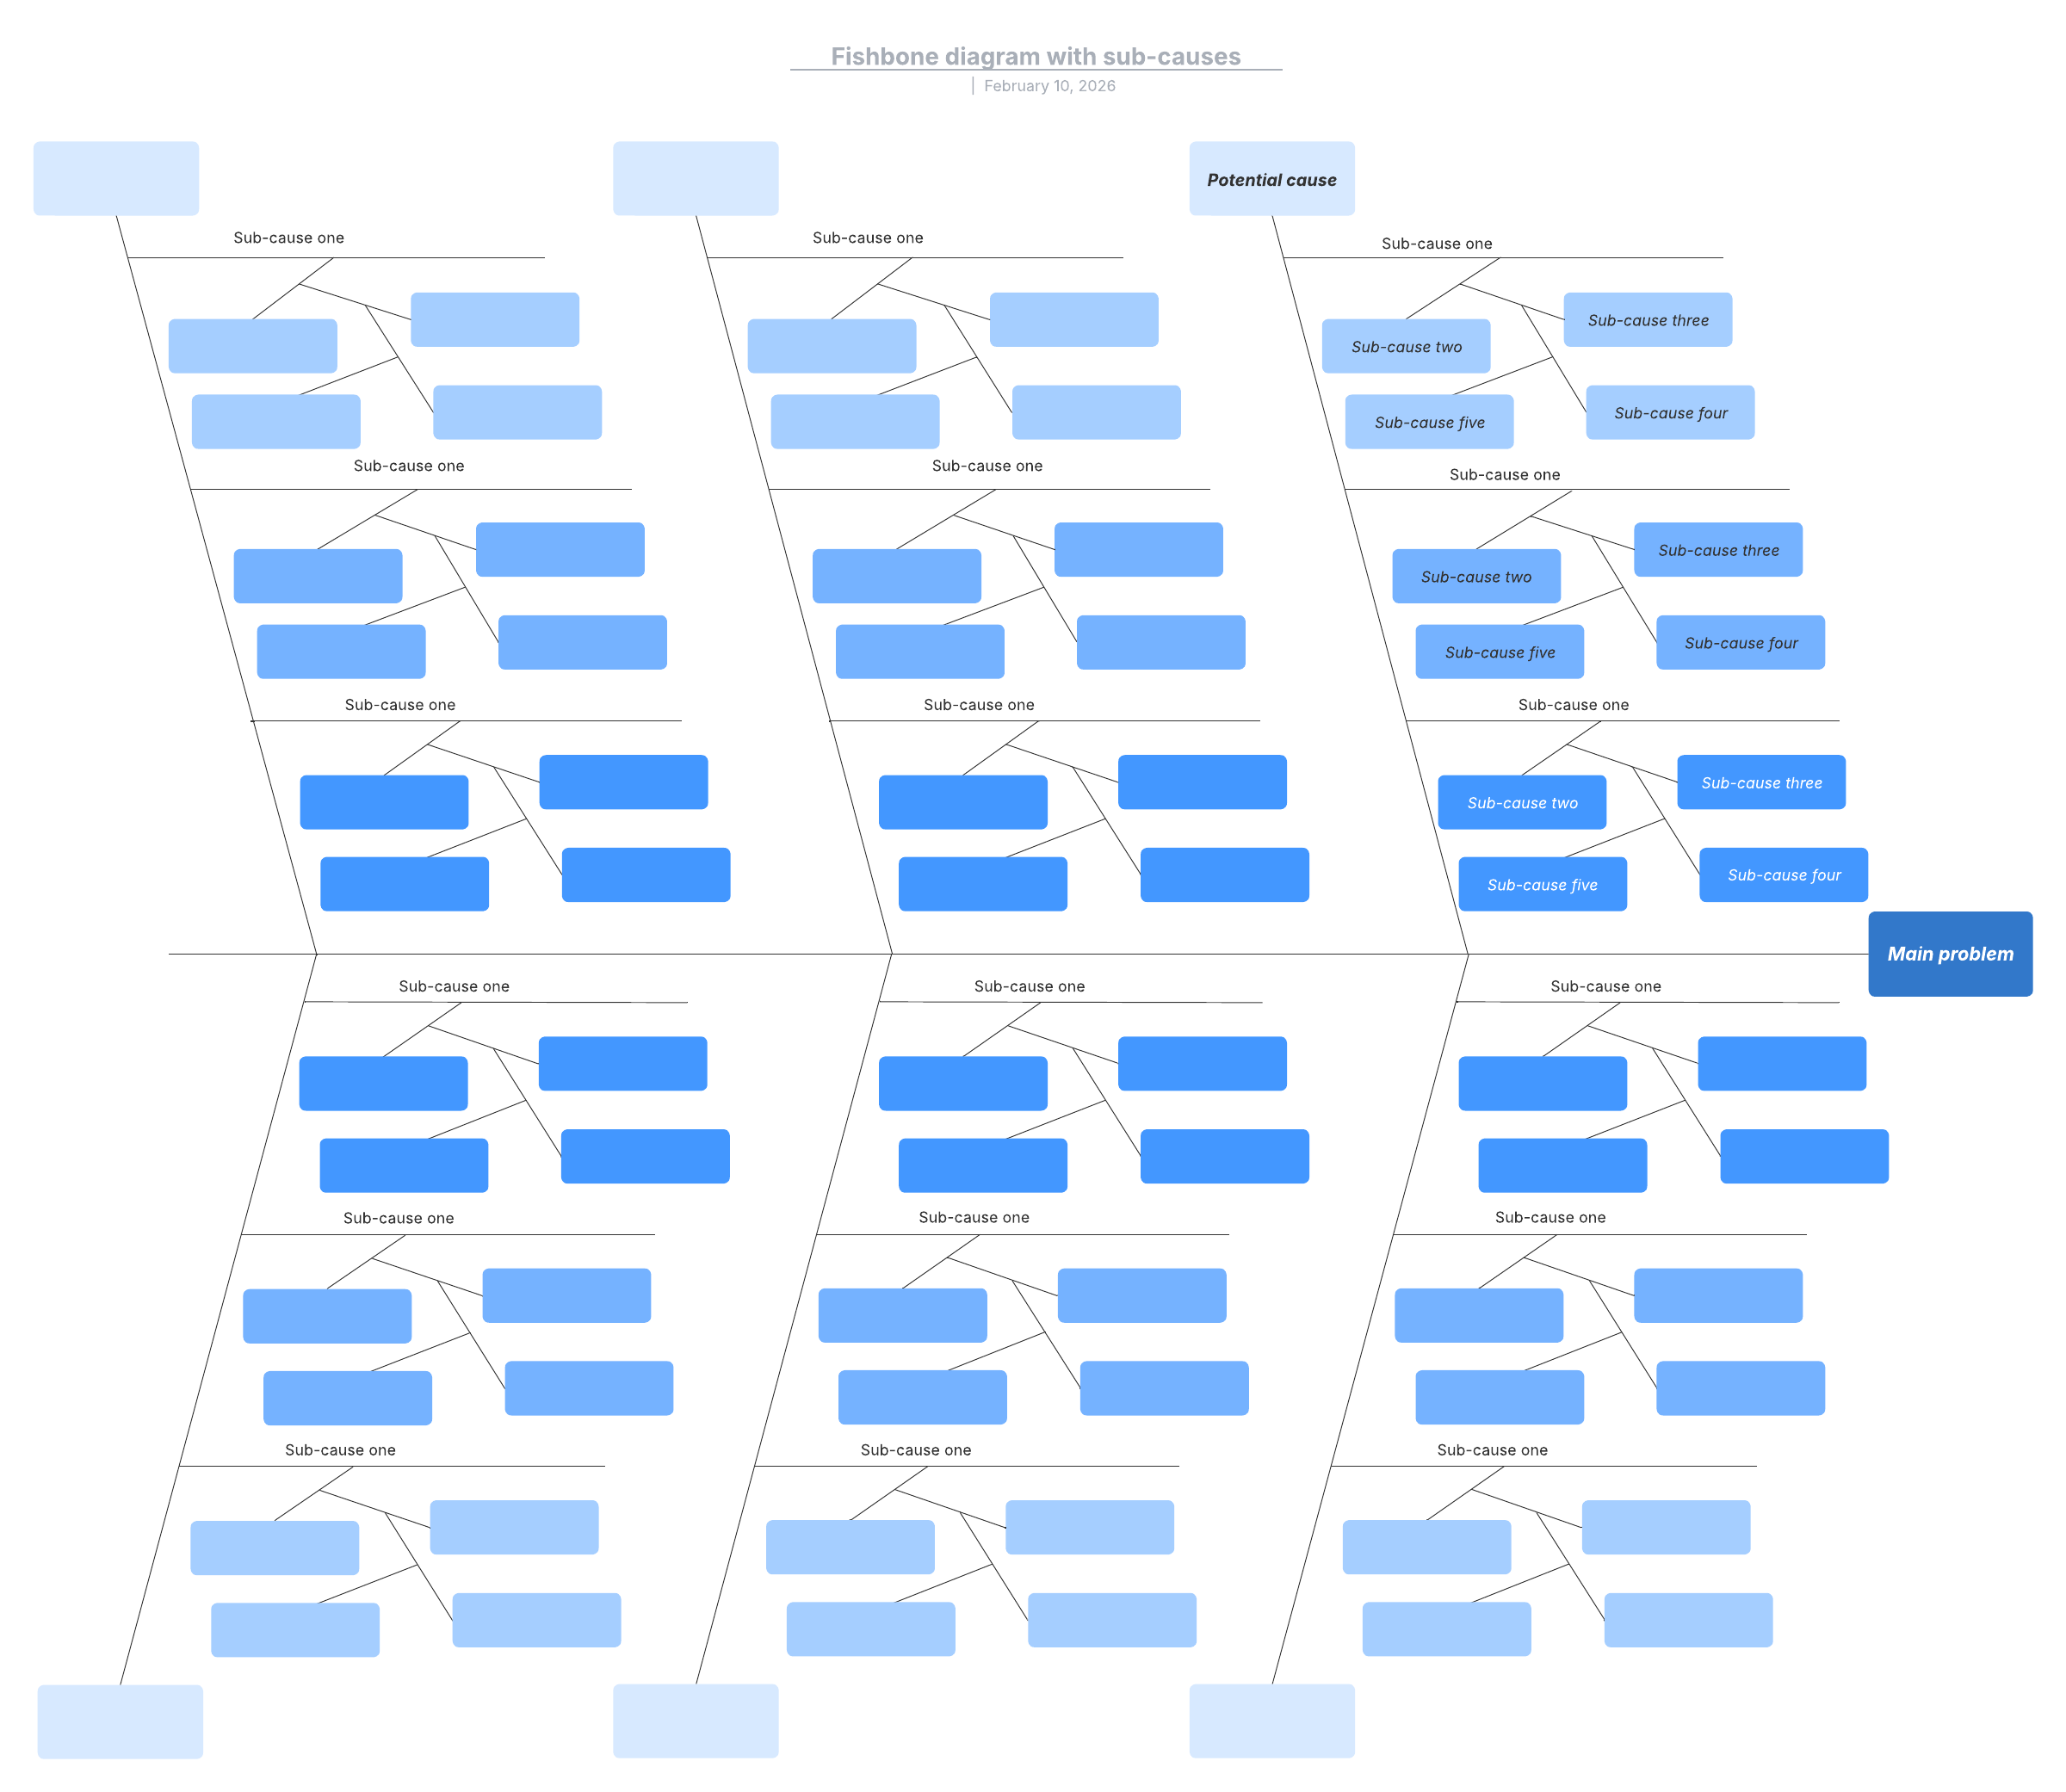
Fishbone diagram with sub-causes

This template works on the following products:

Lucidchart logo
Use this template

*For Team and Enterprise plans

This detailed fishbone diagram template can help you:

- Identify potential causes behind an observed effect.
- Categorize the potential causes you identify.
- Collaborate with colleagues.

Open this template and add content to customize this detailed fishbone diagram to your use case.
This detailed fishbone diagram template can help you:

  • Identify potential causes behind an observed effect.
  • Categorize the potential causes you identify.
  • Collaborate with colleagues.

Open this template and add content to customize this detailed fishbone diagram to your use case.

Related templates

Go to Nonprofit industry capability map template

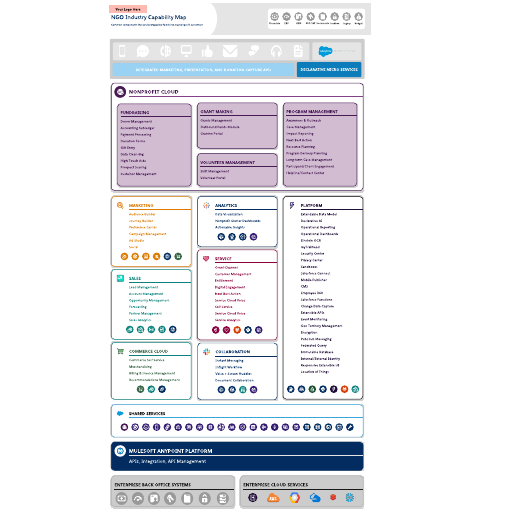
Nonprofit industry capability map

Used with:

Go to Nonprofit industry capability map template

Go to Tree chart worksheet template

Tree chart worksheet

Used with:

Go to Tree chart worksheet template

Go to Interrelationship diagram template

Interrelationship diagram

Used with:

Go to Interrelationship diagram template

Solutions

  • Digital transformation
  • Cloud migration
  • New product development
  • Efficiency through AI
  • View more

Company

  • About us
  • Newsroom
  • Careers
  • Customer stories
  • Contact us
  • Accessibility
PrivacyLegalCookie privacy choicesCookie policy
  • linkedin
  • twitter
  • instagram
  • facebook
  • youtube
  • glassdoor
  • tiktok

© 2025 Lucid Software Inc.