
Key takeaways
-
Intelligent visuals significantly elevate collaboration by promoting faster decision-making, saving time, surfacing insights, and more.
-
Lucid’s intelligence extends far beyond basic AI chatbots. By weaving context-aware AI together with data automation, Lucid can supercharge your entire operational workflow.
-
Visual collaboration has matured, naturally leading to workplace acceleration, where intelligence, alignment, and efficient workflows help teams move from understanding to action—all backed by dynamic visuals for deeper understanding.
Intelligence has taken the technology industry by storm. In fact, 92% of companies plan on increasing their investment in AI by 2028.
In the visual collaboration space, many companies are jumping on this trend in the form of generative AI. This technology is incredibly valuable during ideation, but it barely scratches the surface of what’s possible when introducing intelligence into collaboration.
Collaboration solutions only now experimenting with intelligence have missed opportunities to increase productivity, aid decision-making, and save time at every stage of work—beyond ideation.
Lucid is different. We’ve been building with intelligence in mind for over a decade. While other collaboration solutions only focused on simple sticky notes and arrows, Lucid was building advanced automation and data visualization capabilities. We know how vital intelligence is for moving into action, and now our solution delivers the most powerful combination of an easy-to-use interface with deep, technical capabilities.
Don’t get us wrong: We’re just as excited about the possibilities of generative AI as the next company. But we view it as an accelerant to our already intelligent foundation rather than simply a standalone feature. Let’s uncover what’s unique about Lucid’s intelligence and how it benefits teams across the business by leveling up how they create, collaborate, and collect insights.
Benefits: Why does intelligence matter in visual collaboration software?
Visuals are a powerful way to communicate ideas clearly and reach a shared understanding—and intelligent visuals are even more powerful. By adding automation and Lucid AI to visual collaboration, teams can unlock new insights and gain clarity faster than ever.
An intelligent visual collaboration solution:
-
Makes data more accessible across the organization: By taking data out of hard-to-understand formats like spreadsheets and turning it into visuals, teams across the business can easily make sense of complex information.
-
Saves time that can be spent on higher-impact activities: With an intelligent solution, teams can spend less time manually creating diagrams, writing project documentation, or interpreting visuals, and more time on collaborative work like problem-solving and creative brainstorming.
-
Helps teams continually innovate: Intelligence helps teams identify trends in their data, areas of concern or interest, and opportunities for improvement. By allowing AI to evaluate canvas content alongside dynamic visuals synced with a system of record (like Google Sheets, Jira, and more), teams can ensure they’re taking action based on the most up-to-date information.
-
Provides clarity around priorities: An intelligent visual collaboration solution takes the guesswork out of decision-making. It goes beyond human input to automatically flag friction points, find a consensus, and help teams identify trends and align around what’s most important to the business.
-
Helps with tool consolidation: Since intelligent solutions serve every team’s use cases—from brainstorming and planning to diagramming complex systems, processes, and architecture—businesses don’t have to purchase a separate platform for different needs. As a result, it’s easy to consolidate tools and reduce unnecessary spend.
What makes a visual collaboration solution “intelligent” anyway?
Artificial intelligence is a core element of what makes Lucid’s solution intelligent. But when we talk about Lucid’s intelligence, we’re talking more broadly about the ability to apply data and automation across the entire lifecycle of work—from overlaying data on processes to automatically aggregating opinions. Our platform is uniquely built to understand relationships between the content, text, and imported data living right inside your boards. By securely analyzing this context, we allow teams to unlock deep operational clarity without compromising data privacy. Here are a few examples of what you can do with Lucid’s intelligence.
Automatically create visuals from outside data sources
While basic diagramming tools offer visual creation, intelligent diagramming introduces the ability to link visuals to data—something Lucid supports with unmatched depth.
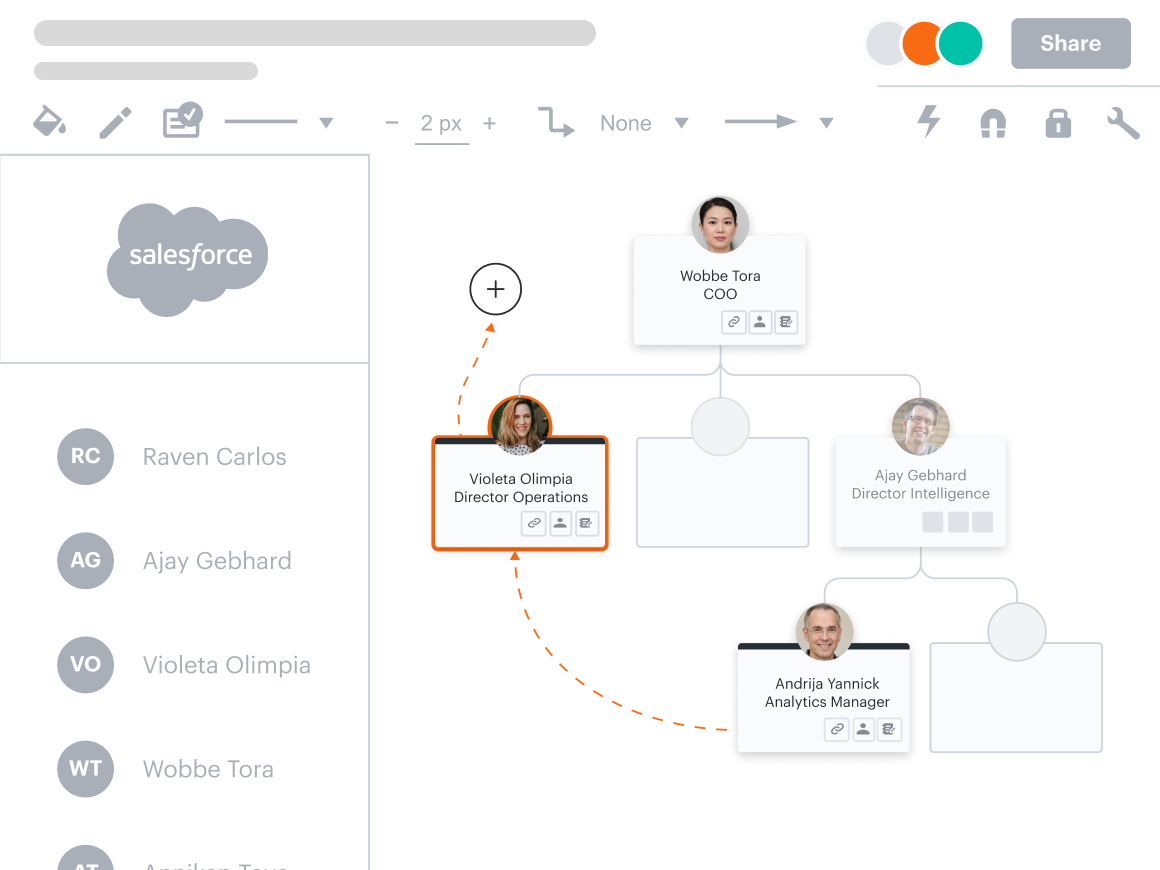
With Lucid, you can automatically import data directly from where it lives—whether that's static or cloud-based spreadsheets, CRMs like Salesforce, an HRIS, or another system of record—into Lucid to create diagrams nearly instantaneously. You can also use Lucid AI to generate diagrams based on prompts. A few of the most common (and useful) diagrams teams generate automatically in Lucid are:
-
Entity-relationship diagrams
-
Org charts
-
Salesforce account maps
-
UML sequence diagrams
-
Architecture diagrams (using the Cloud Accelerator to visualize AWS, GCP, Azure, or custom hybrid architectures)
With Lucid, it’s easy to keep the data in your visuals up to date. If your data comes from Google Sheets, any change you make to your spreadsheet will automatically sync to Lucid. If your data originates in a CSV file or Excel spreadsheet, you can simply replace the data set with the most recent data.
Interpret data by adding automation to your visuals
Not only can you use Lucid to automatically visualize your data, but you can also use it to automatically interpret your data. Lucid helps you glean valuable insights from your data through:
-
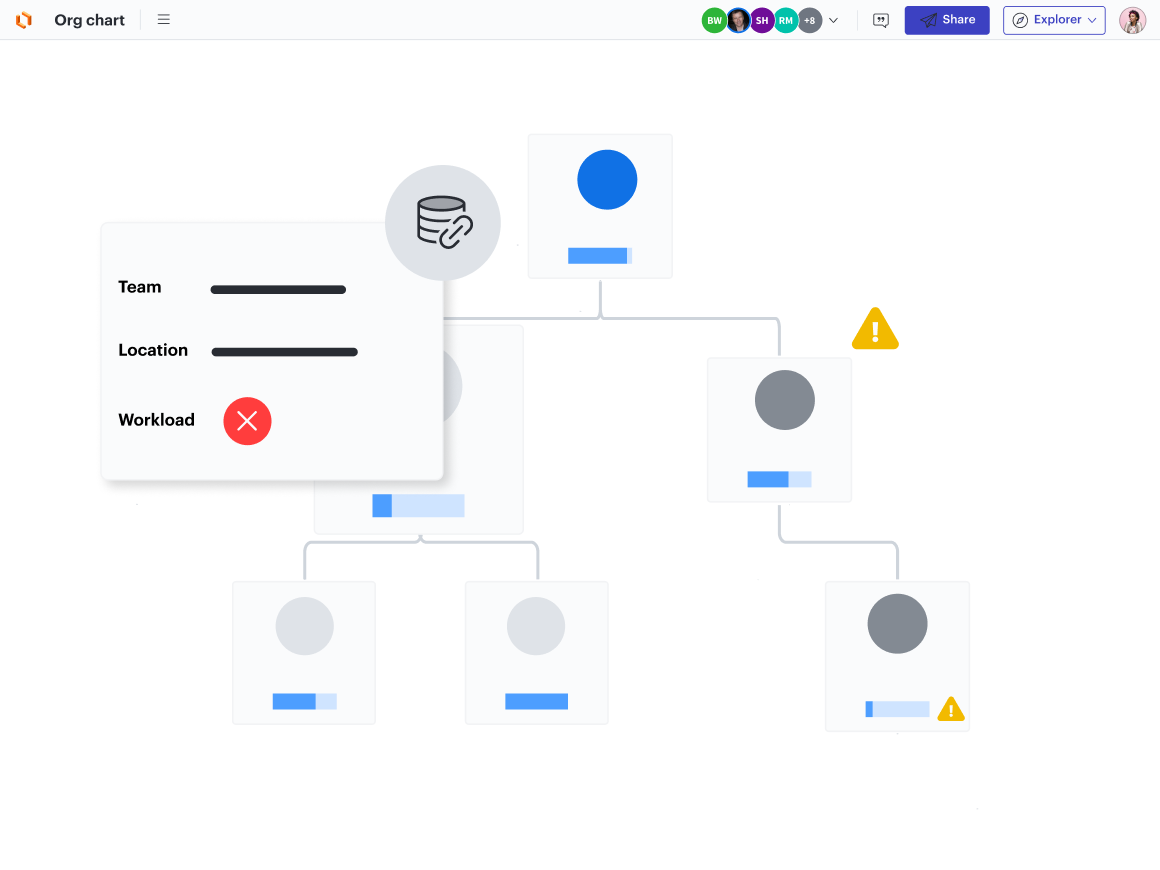
Conditional formatting: Create rules to automatically evaluate all shapes in your diagram against your designated criteria. Use this feature to identify patterns or differentiate areas needing attention in your diagram, such as inefficient steps in a process or certain roles in an org chart. You can also use Lucid AI to create and apply conditional formatting rules.
-
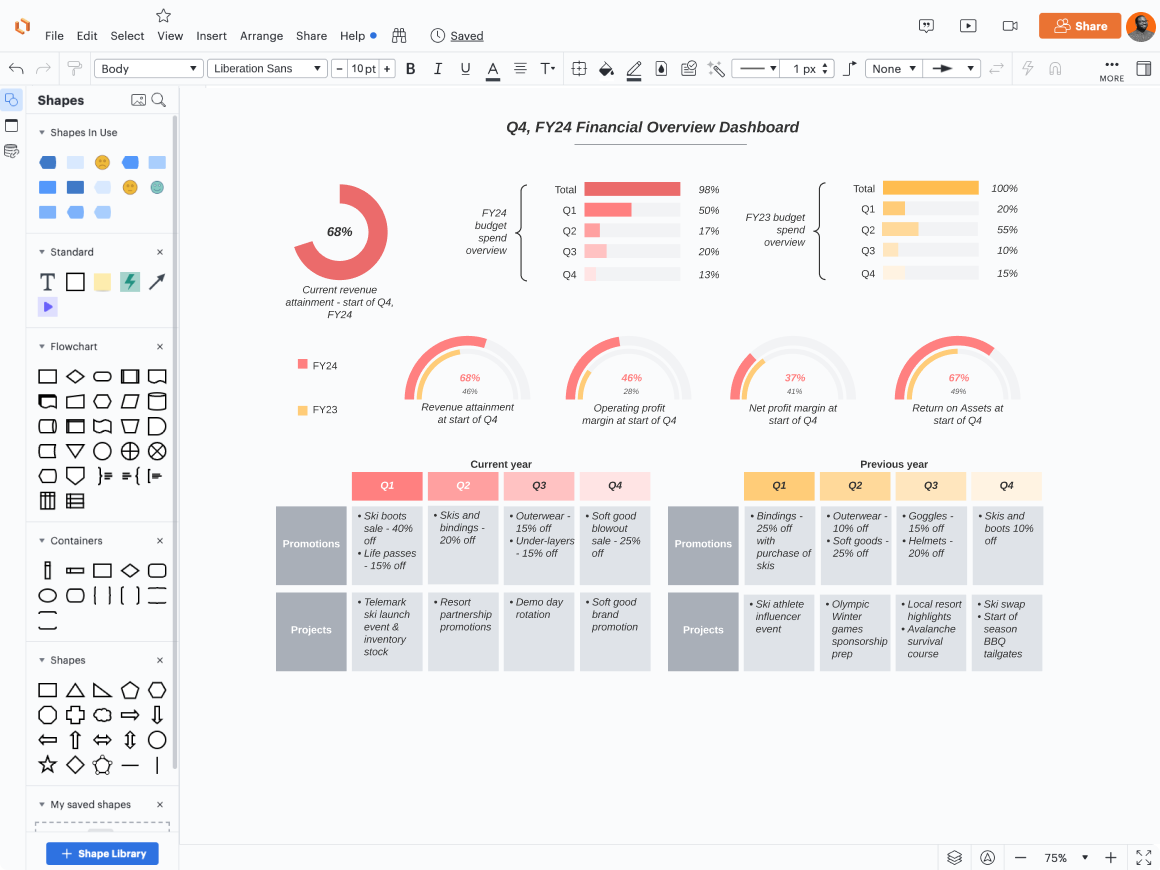
Dynamic shapes: Create data-driven shapes to quickly gauge details like progress towards goals, key metrics, or project completion. Add multiple dynamic shapes to a dashboard for a quick snapshot of important information.
-
Smart Containers: Group the data linked in your diagrams by unique attributes (such as status, priority, or team) to better understand it. For example, if your linked spreadsheet contains info on project status, you can use Smart Containers to automatically sort your diagram by the different statuses.
-
Data overlay: Add data on top of existing visuals—from org charts to process diagrams and dashboards—to bring together multiple data sources and easily update your visuals with the most relevant information.
Automatically aggregate input and ideas to drive data-backed decisions
Data doesn’t always look like numbers. Sometimes, the data we need to make sense of is qualitative: themes from a large brainstorm or leadership’s take on business priorities.
With Lucid’s Visual Activities, you can capture this kind of data and automatically aggregate the results to view trends, areas of consensus, or places of misalignment. Simply select an activity from our library of templates, invite participants to engage, and then view the results.
Teams can view the data in an activity in different formats with just the click of a button. Use this data to drive discussion and make informed decisions.
You can also use Lucid to automatically organize ideas after brainstorms. Simply tag sticky notes by criteria of your choosing—maybe priority, status, or topic—and then let Lucid sort ideas by these criteria so you can easily identify patterns and next steps. Or, use Lucid AI to help expand your brainstorm and identify key themes and takeaways.

Propel projects forward with AI-assisted ideation, synthesis, and diagramming
Because Lucid’s products are already data-backed, we’ve been able to incorporate AI quickly—and securely—into our solution.
With Lucid AI, teams can do far more in less time. Here’s how:
-
Create with AI: Use Lucid AI to instantly answer questions, transform text prompts into visuals, and automate documentation. Generate diagrams and boards, add conditional formatting, and build mind maps in seconds.
-
Collaborate with AI: Lucid AI can brainstorm, sort, and categorize ideas seamlessly, plus generate quick document summaries to keep everyone on the same page.
-
Collect insights with AI: Lucid AI can help you analyze data-backed diagrams and complex documentation. Then, it can proactively flag gaps or bottlenecks and answer direct questions about extensive documentation so you can extract actionable insights in seconds.
Plus, you can use Lucid’s AI-backed integrations to build, share, and summarize your diagrams directly inside ChatGPT+, Slack, Microsoft Graph Connector and Copilot, and more.
Use cases that only Lucid can fully support
Because Lucid is the solution with the most advanced automation and data capabilities, it can power some of the most critical business use cases for improving efficiency, making decisions, and driving alignment.
Optimizing processes
While most visual collaboration solutions can help you map processes, Lucid takes it a step further, allowing you to add data to your process diagrams—the kind of data needed to understand efficiency, uncover process gaps, and identify improvements.
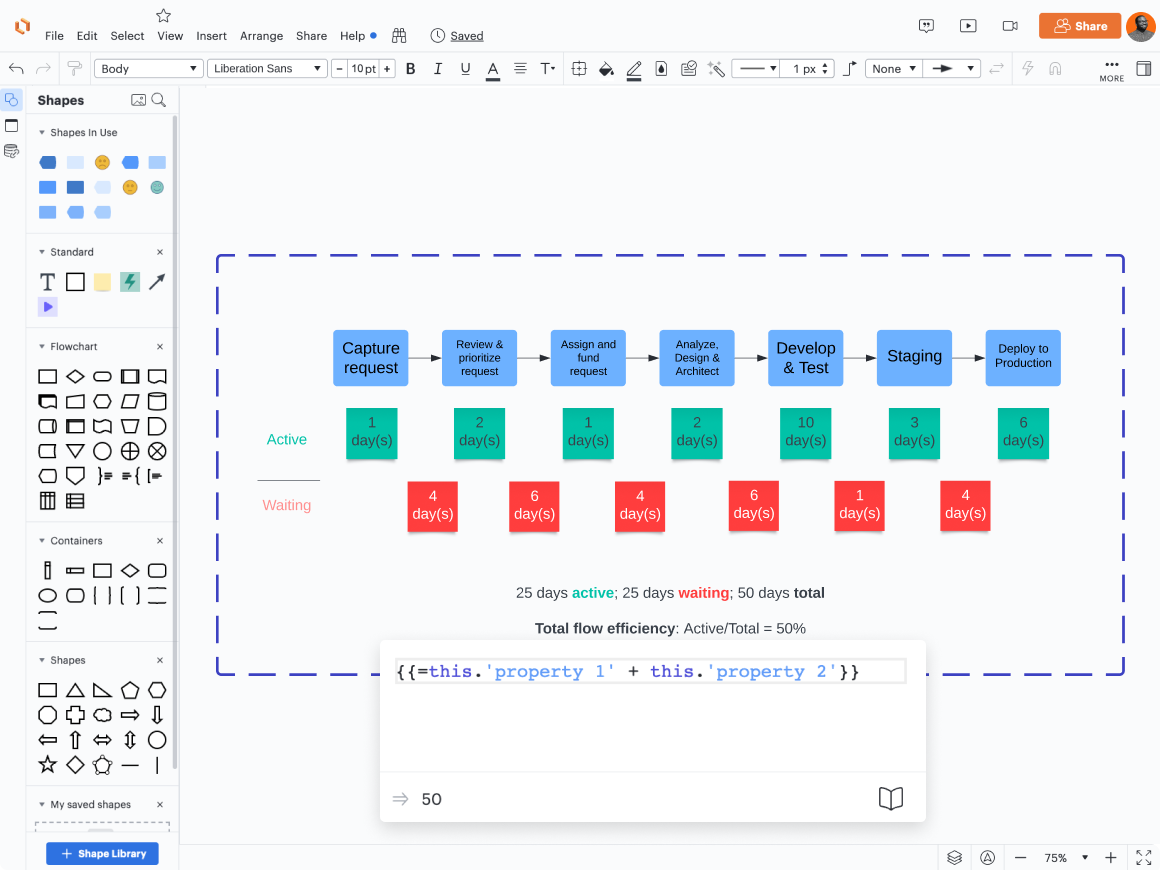
Connect process steps to actual data with data linking, or use formulas with custom data fields to make calculations. For example, teams may add data to a value stream map and use formulas to automatically calculate flow time and efficiency. This data can be used to identify roadblocks and risk and work towards improving the problem areas in a process.
Creating entity-relationship diagrams (ERDs)
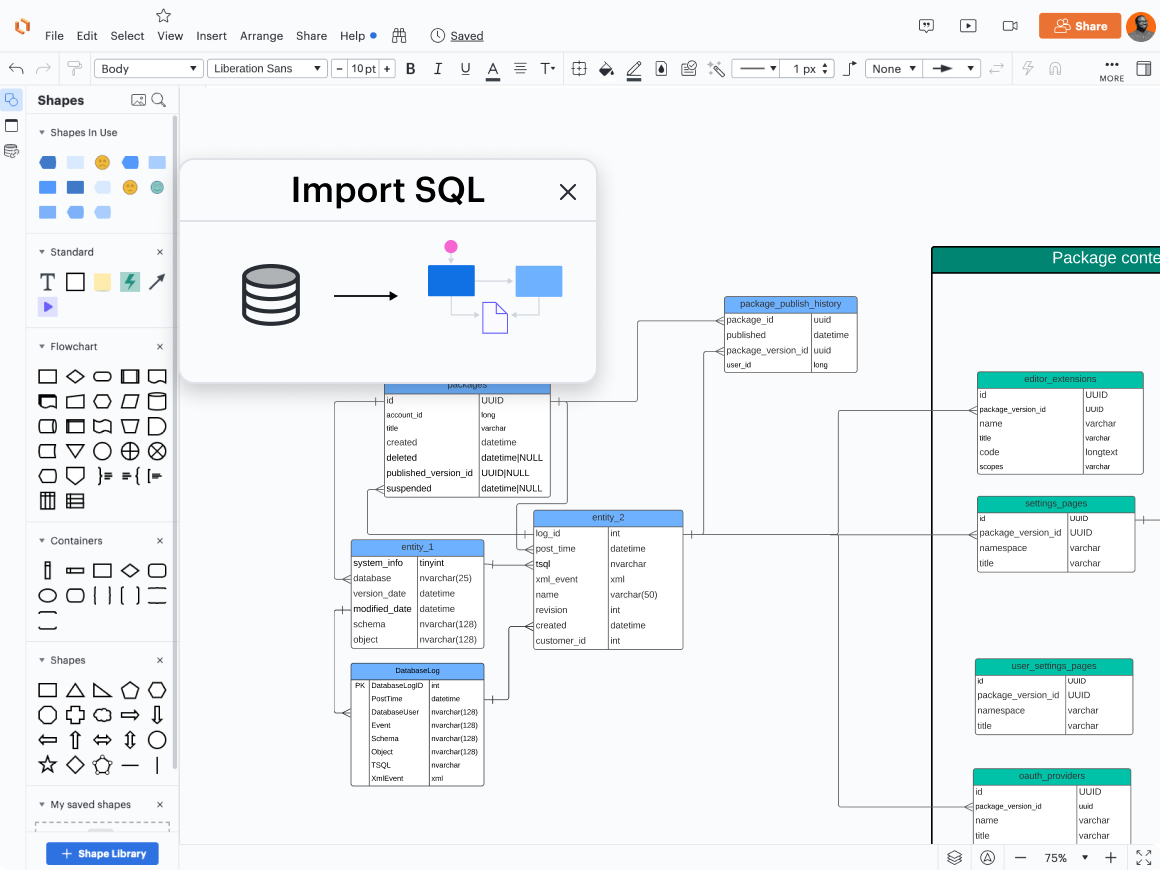
Using Lucid’s import from SQL functionality, teams can generate data-backed ERDs with automatically drawn connections. When a completed ERD is ready in Lucid, teams can then export their diagram to the DBMS of their choice—no manual building, updating, or editing needed. While other tools can visually represent this information, Lucid has the data-driven backend to automatically power ERD visualization in a stable and reliable way, saving teams time and effort.
Generating actionable org charts
With Lucid, you can generate an org chart automatically from a CSV, Google Sheets, Excel, or BambooHR, refresh that data when you need to update the diagram, and use the data-backed org chart to glean valuable insights.
Lucid’s unique org chart capabilities allow you to:
-
Create a group view to show employees grouped by a specific data field instead of a traditional, hierarchical view. Group views are valuable for Scrum team planning, creating cross-functional teams, or identifying staffing needs by role.
-
Add conditional formatting rules based on the advanced shape data to easily visualize compensation, performance, and other personnel details.
Account mapping
Lucid helps sales teams visualize key influencers, roadblocks, and internal relationships through account maps generated automatically from Salesforce. With a bi-directional sync, teams can create a single source of truth to improve alignment across account teams, resulting in decreased sales cycles and increased revenue.
Moving beyond visual collaboration
Building on the intelligence behind Lucid’s visual collaboration solution, we’ve created the world’s first end-to-end work acceleration platform. Now teams can ideate, plan, design, build, and launch game-changing solutions from a single, infinite canvas, giving them the clarity and connected workflows they need to see and build the future. By infusing this new era of work acceleration with context-aware AI and deep data automation, Lucid can help your team move not only faster but smarter.

See Lucid in action
Uncover just how Lucid’s intelligent solution can power your business’s most important initiatives.
Request a demo

