
Key takeaways
-
Current state maps are a visual blueprint of an organization’s operating model, capturing how teams, tools, and infrastructure interact across the company.
-
Current state maps break down cross-departmental silos, uncover costly software redundancies, prevent misalignment, and create a clear baseline for strategic change.
-
A complete current-state map spans several layers: cross-functional process workflows, business application portfolios, departmental tech stacks, and cloud architecture.
A current state map is generally thought of as a snapshot of the processes and methods your organization currently uses to produce products and complete services. But in a constantly changing business landscape, a current state map needs to include more than processes. It should include your business functions, capabilities, applications, and tech stack.
A current state map is important not only for showing you where you are but also for identifying where you could go next.
Benefits of current state maps
There are many reasons to use current state maps. They can help teams across essentially any industry in the following ways.
-
Improve processes: Identify and mitigate bottlenecks to optimize workflows and prepare your systems to grow.
-
Make better decisions: Quickly visualize and understand your organization’s current architecture to identify gaps and make improvements for the future.
-
Simplify training: Document your company’s architecture, structure, and processes so employees can step into new roles with ease.
-
Bridge the gap between cross-functional teams: Because visuals are easier to understand and retain, stakeholders at any level can better grasp complex technical information.
-
Ensure alignment: Maintain consistency across the organization as departments can work from a single, standardized source of truth.
In this article, we will walk you through the process of creating a visual current state map using Lucidchart.
Create your own current state map in Lucidchart
Start with a blank Lucidchart document. From there, analyze five elements of your business to create a complete current-state map: business functions, business capabilities, business applications, your tech stack, and your cloud architecture.
-
Map business functions
To get a full overview of your company’s current state, you need to document more than just your department or team. Bringing in stakeholders from sales and marketing, finance, human resources, IT, and research and development helps clarify who does what, where execution happens, and how operations connect across the organization.
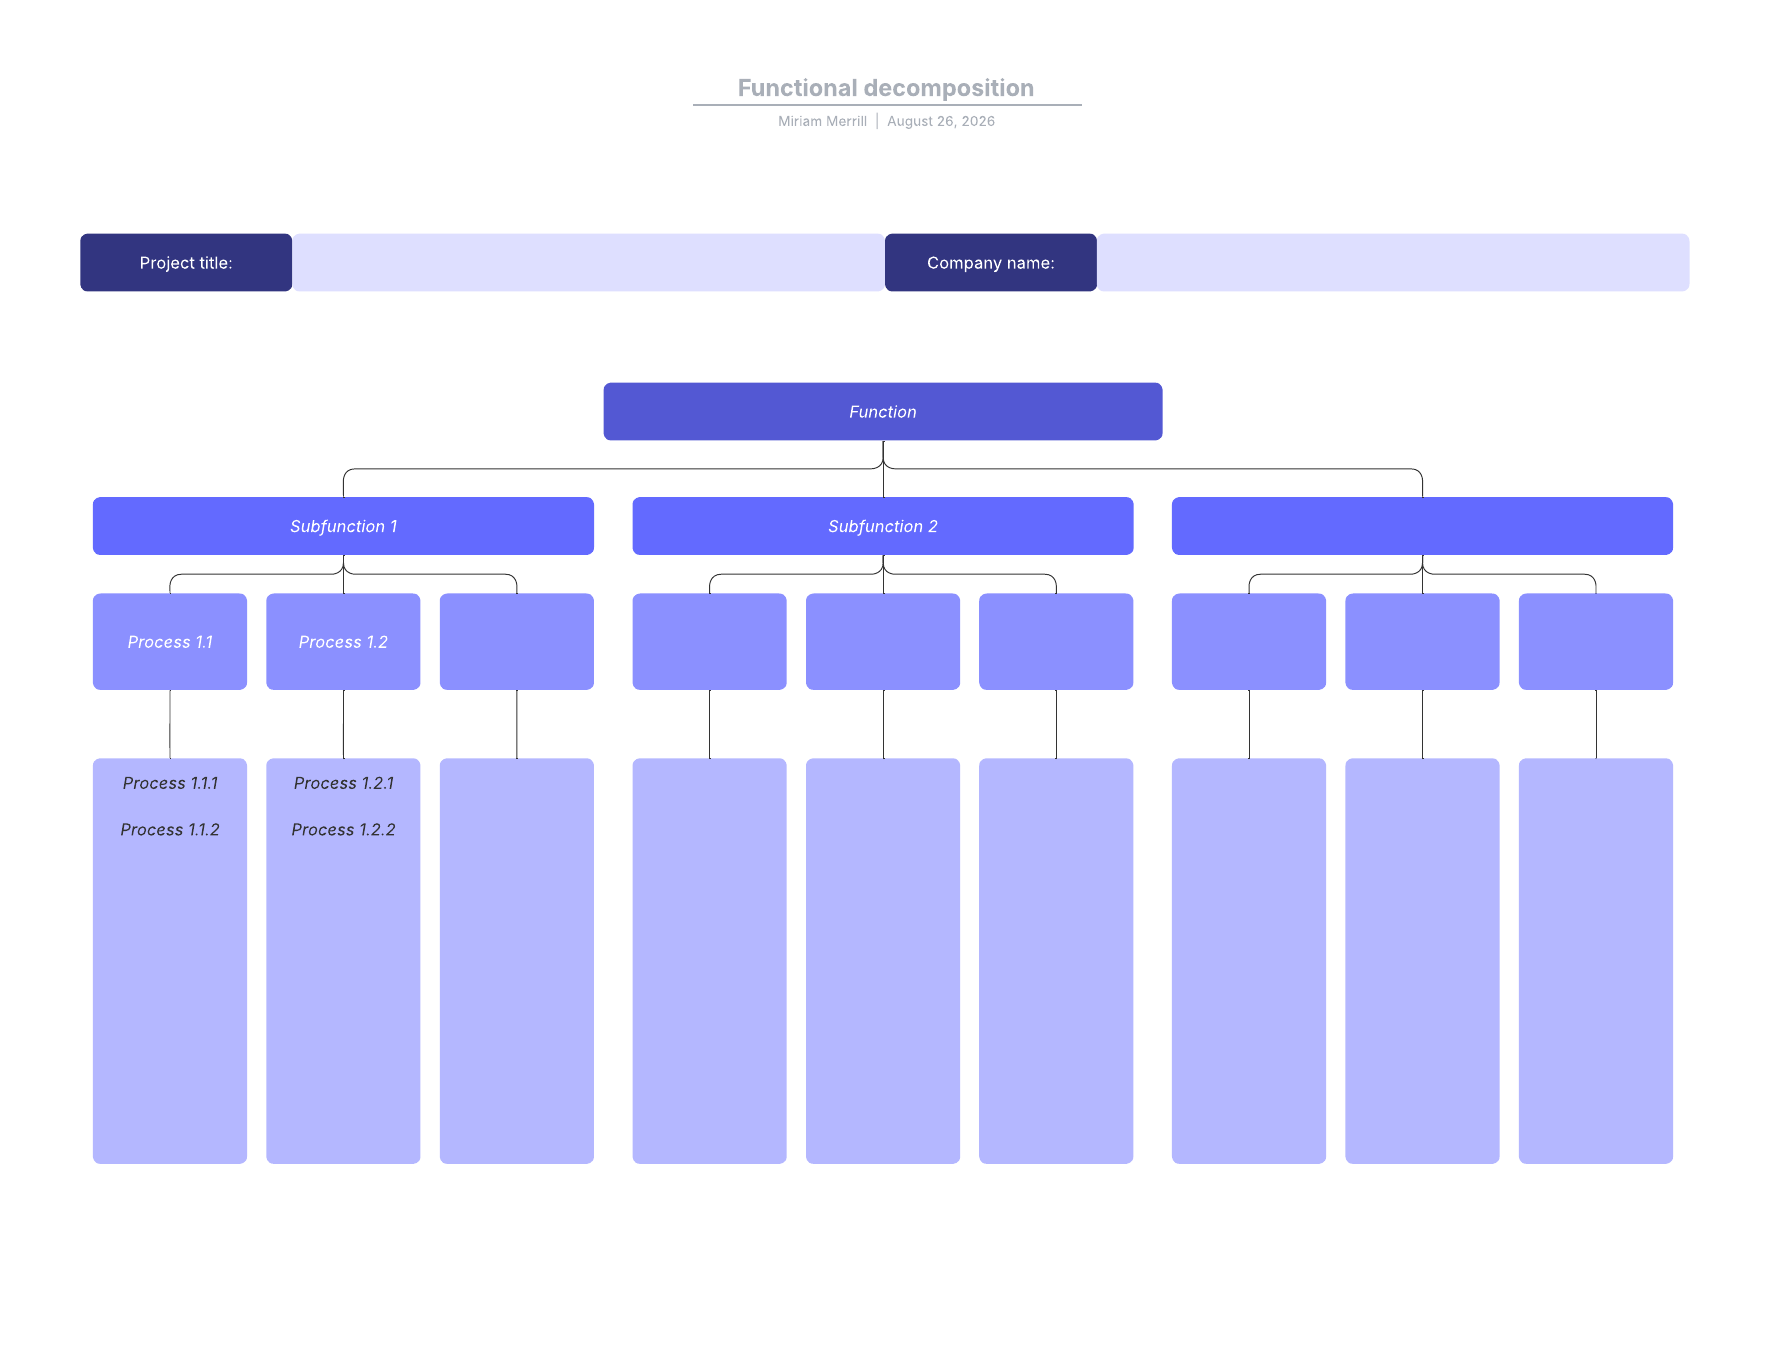
Using Lucid’s Process Accelerator streamlines this cross-functional effort by centralizing repositories and standardizing asset libraries. This allows every department to build diagrams using a shared visual language and publish them to a single, searchable source of truth, eliminating operational silos.
2: Map business capabilities
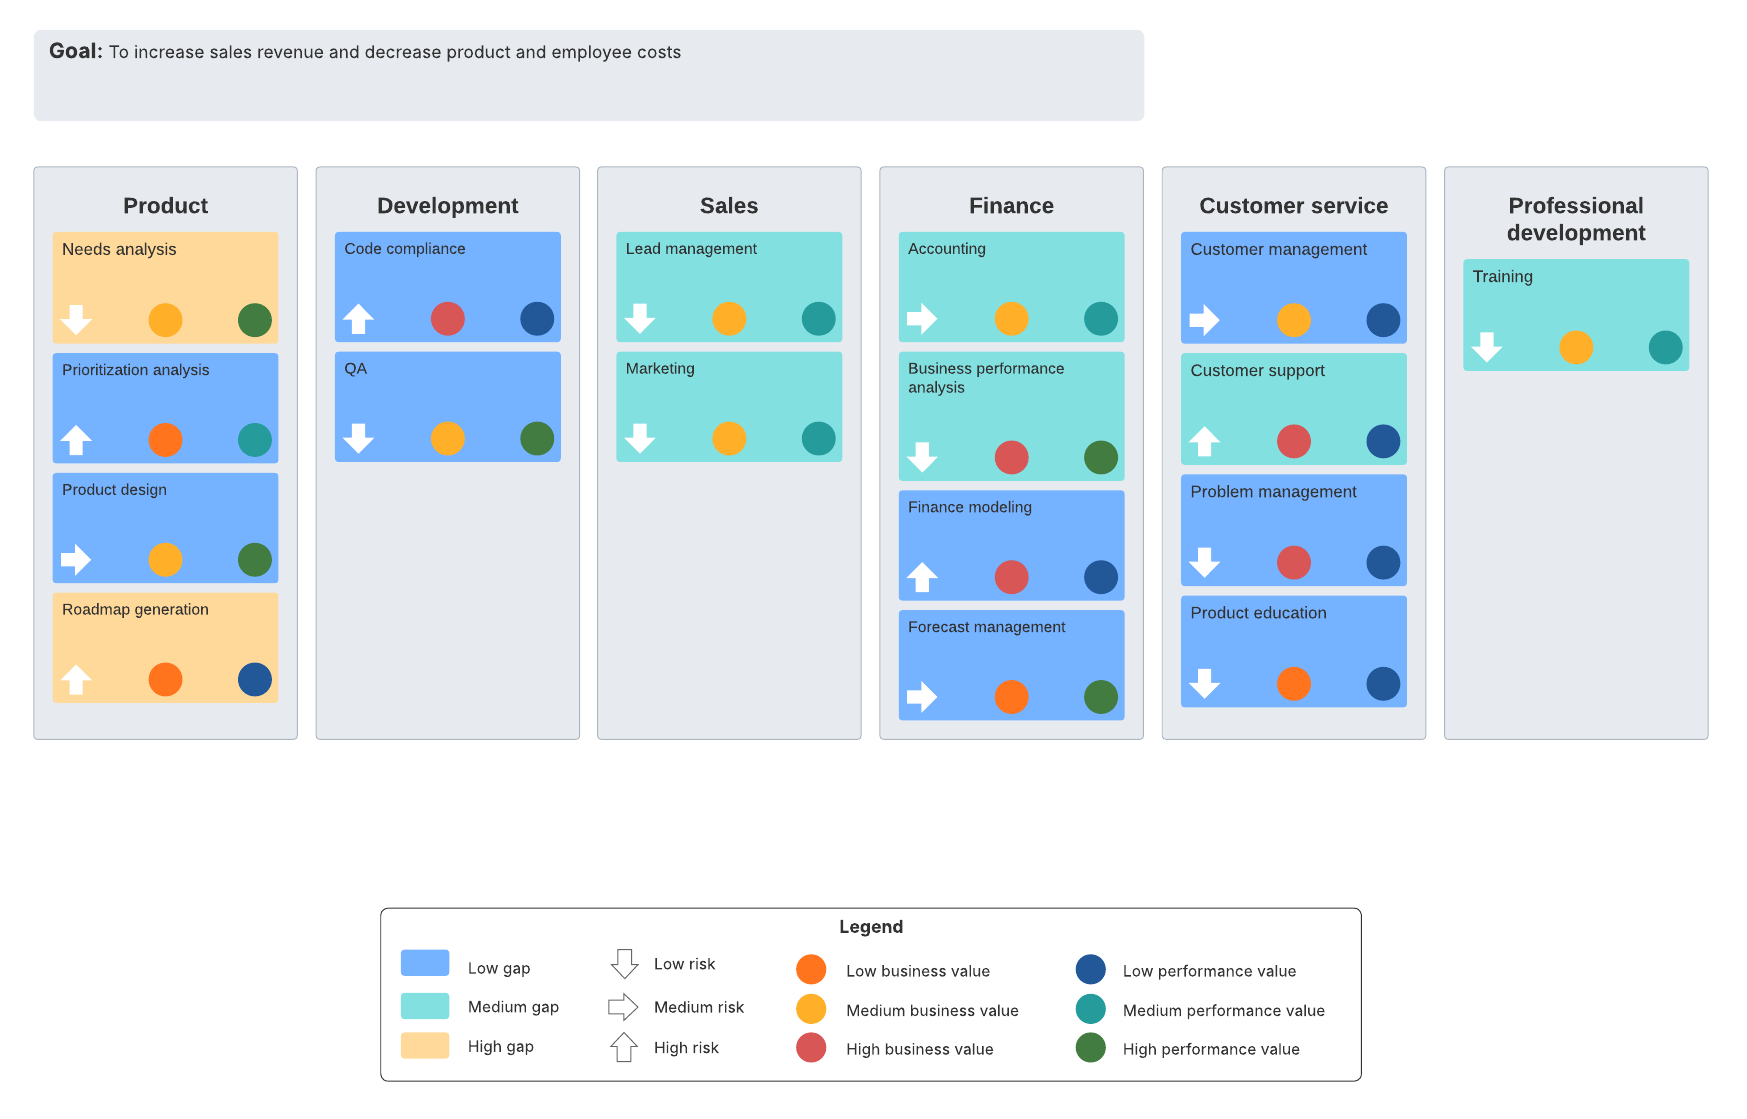
Mapping business capabilities helps you determine whether your company has the capacity to perform the work identified in the business functions. You will analyze employee abilities and expertise, equipment and materials on hand, and any other resources that you need to complete specific tasks.
A business capability is not mapped like a flowchart or a process. It is simply a visual representation of who knows how to do what and what is available or needed to help that person do that job. Business capability mapping can help you determine whether you need to hire more people, acquire more resources, or shift available resources and teams.
3: Map business applications
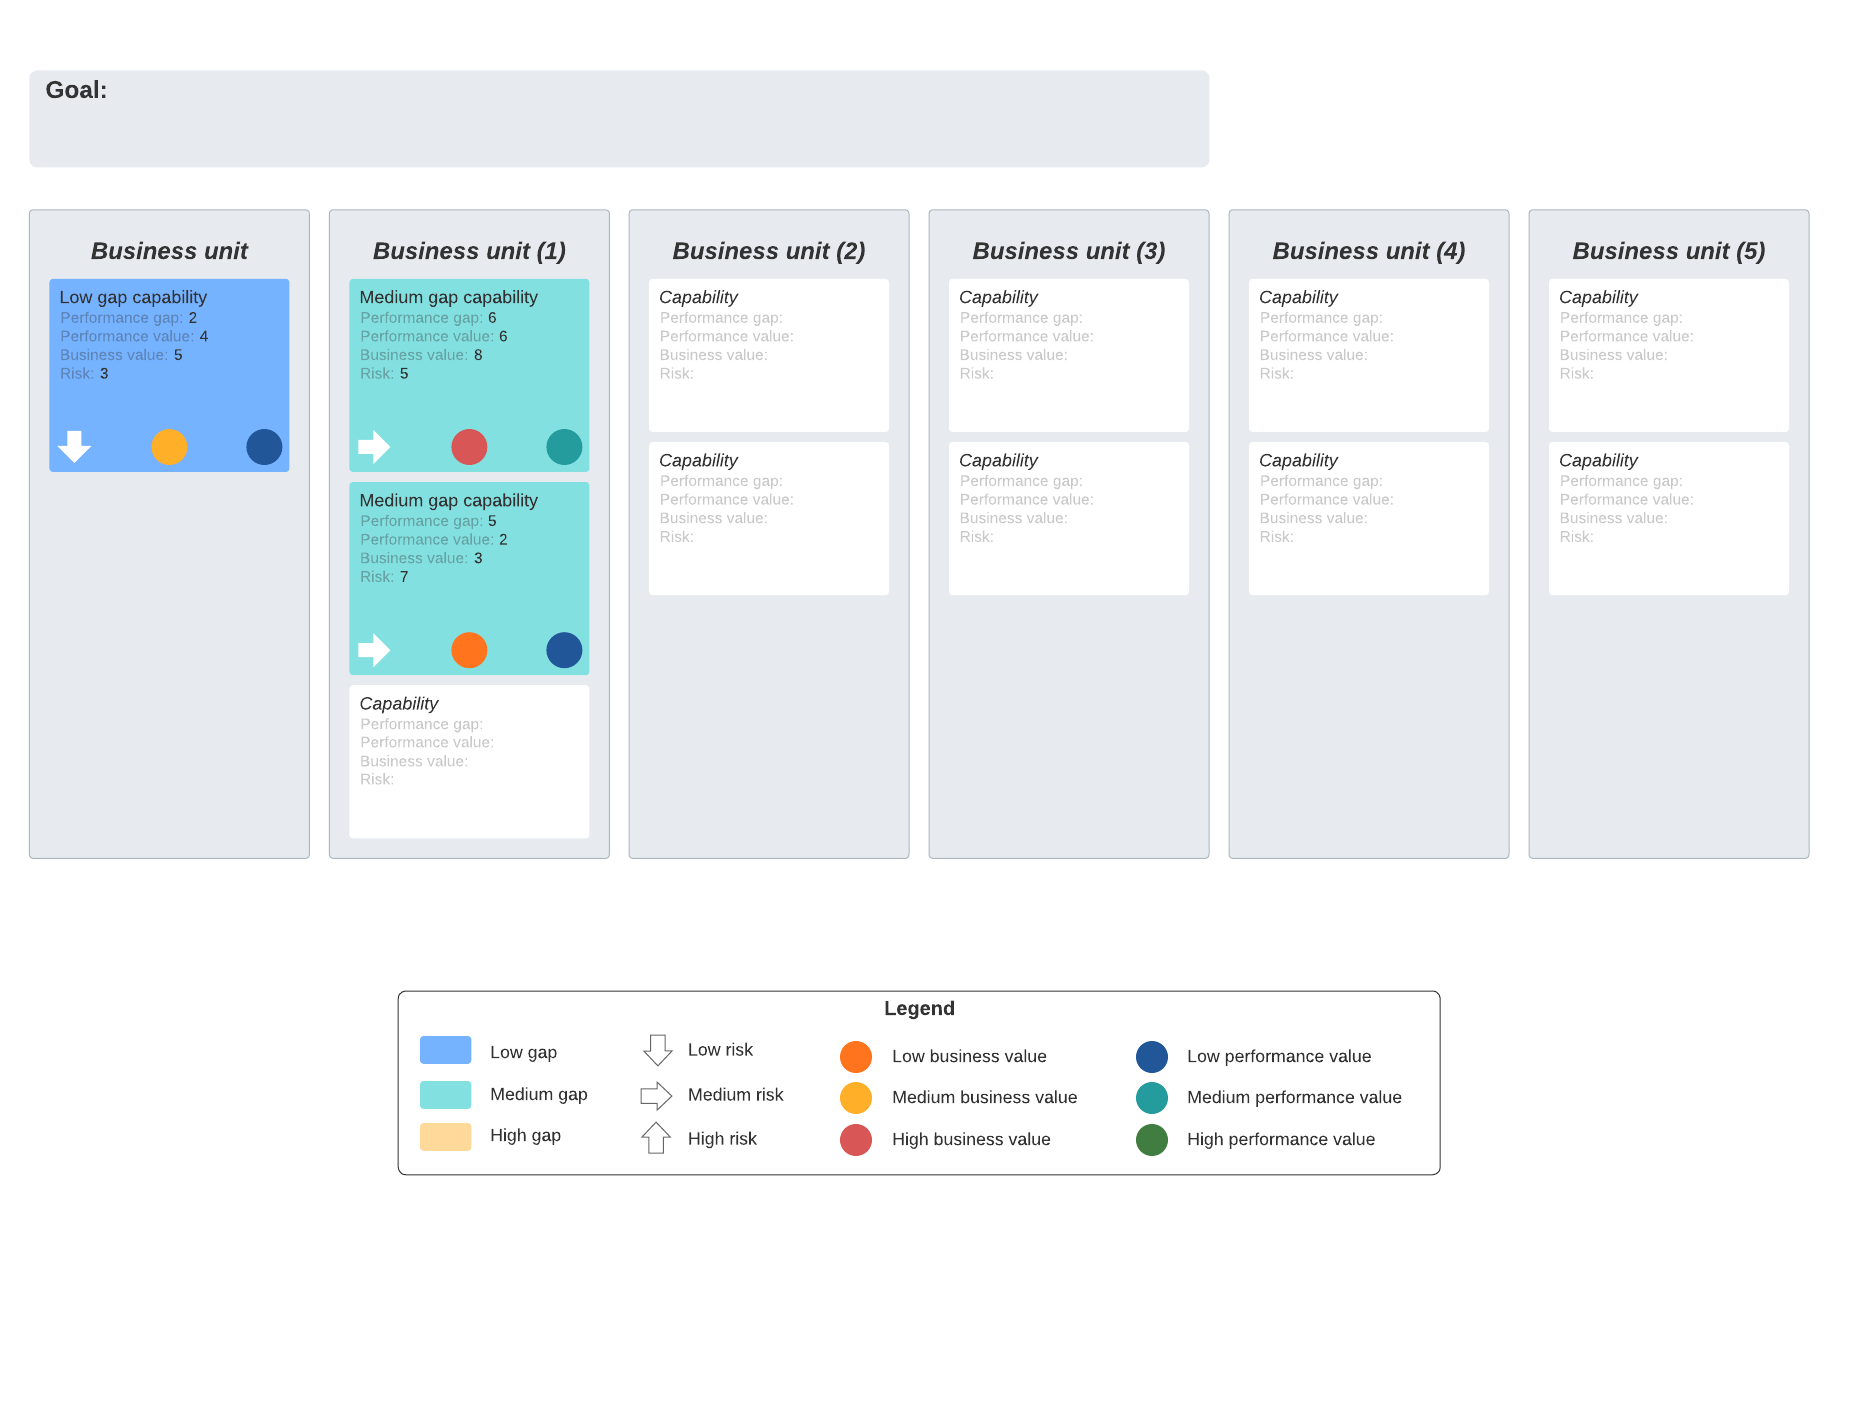
Mapping business applications is important because it provides an overview of what you already have, helping people throughout your organization manage specific business functions.
For example, sales and marketing might use CRM tools, and finance might use a set of accounting and payroll applications. Mapping this out will give you a better idea of what you need going forward. It also ensures that you aren’t paying for tools that you no longer use or that overlap in function with others.
To do this in your Lucidchart document, you can insert a template to visually map your applications by their frequency of use and adoption rate. This makes it instantly clear which tools are essential and which can be retired. Aldd cross-departmental stakeholders to get their input as well.
4: Map your tech stack
Mapping your tech stack is similar to mapping your business applications. The difference is that a tech stack is a list of not just software, but also frameworks, platforms, programming languages, architectures, and so on. The list represents all the technologies that a team needs to develop all the parts they are responsible for in the overall project. For example, the finance team might have a technology stack that includes a payroll app, employee time tracking software, accounting tools, project management software, and so on.
To map tech stacks in Lucid, start on a blank page or use this company high-level systems overview template. Because mapping tech stacks requires visualizing how databases, frameworks, and software interact, this template provides the perfect structure for laying out platforms by department and mapping the system connections between them.
5: Map your cloud architecture
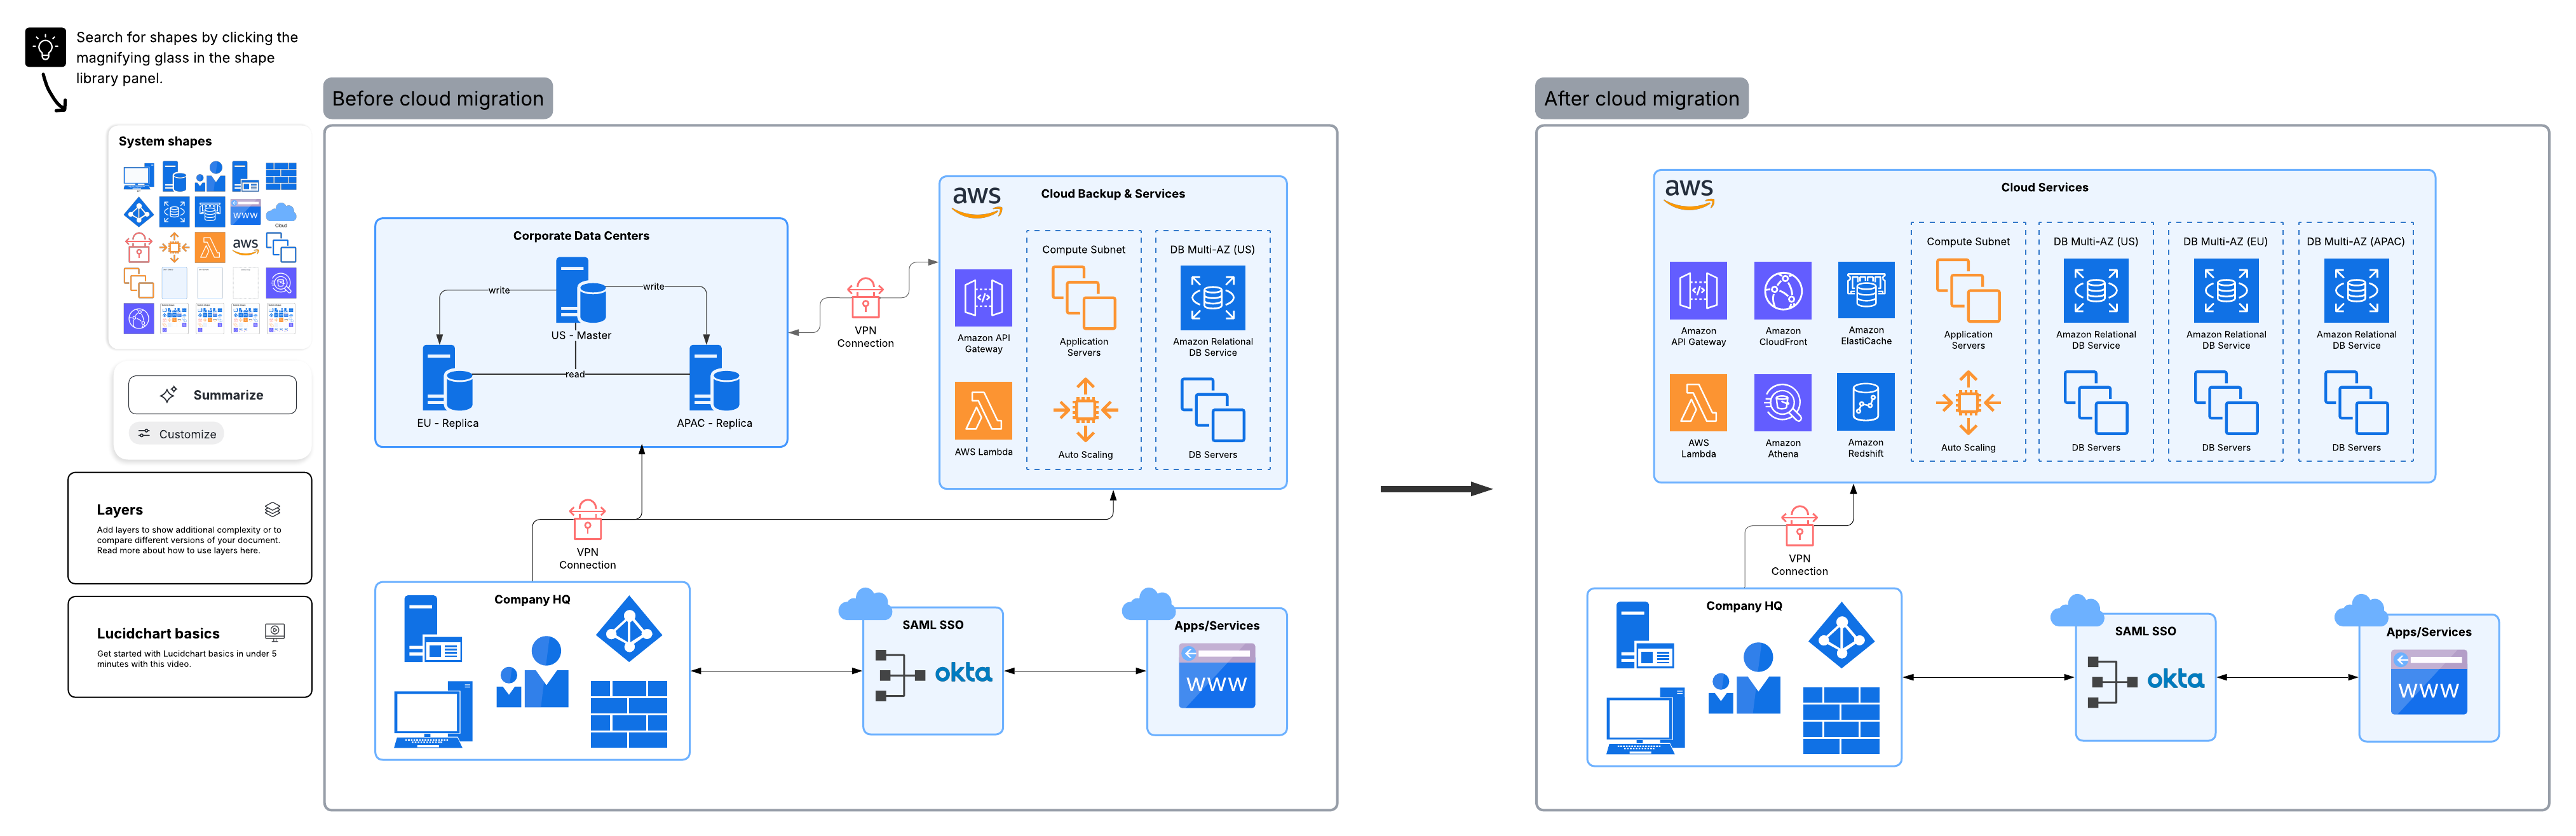
The last step toward a complete current state map is to map your cloud architecture. A cloud architecture diagram describes how different technologies integrate with each other to share scalable resources across a network. It provides a visual overview of your cloud environment, helping you understand all of the components, capabilities, and relationships required to run your applications while validating that your designs have been implemented correctly. Lucid offers a variety of cloud architecture diagram templates to help.
Cloud architectures can be complex, and so can manually creating and maintaining a cloud architecture map. Fortunately, you can leverage the Cloud Acclerator to automatically generate up-to-date infrastructure diagrams directly from your live AWS, Azure, or Google Cloud environments. The Cloud Accelerator goes beyond basic visualization by providing enterprise teams with shared cloud data sources, standardized blueprints, and version-tracking features to easily detect infrastructure drift.
Why Lucidchart?
Documenting your company’s current state isn’t a static, one-time project—it’s the foundation for every strategic transformation. As part of the Lucid Visual Collaboration Suite, Lucidchart bridges the gap between high-level ideation in Lucidspark and detailed execution on a single universal canvas. Supercharged by Lucid AI, you can generate diagrams, summarize visual ideas, and build out complex processes effortlessly.
Cloud-based, real-time collaboration ensures every department operates from the exact same up-to-date context, while extensive shape libraries and templates align teams across every level of your organization. From cross-functional process mapping to live multi-cloud architecture, Lucidchart gives your enterprise the unified, living source of truth you need to map your current state and confidently build for what’s next.

Get started mapping your current state with Lucidchart.
Go now