Context diagram
*For Team and Enterprise plans
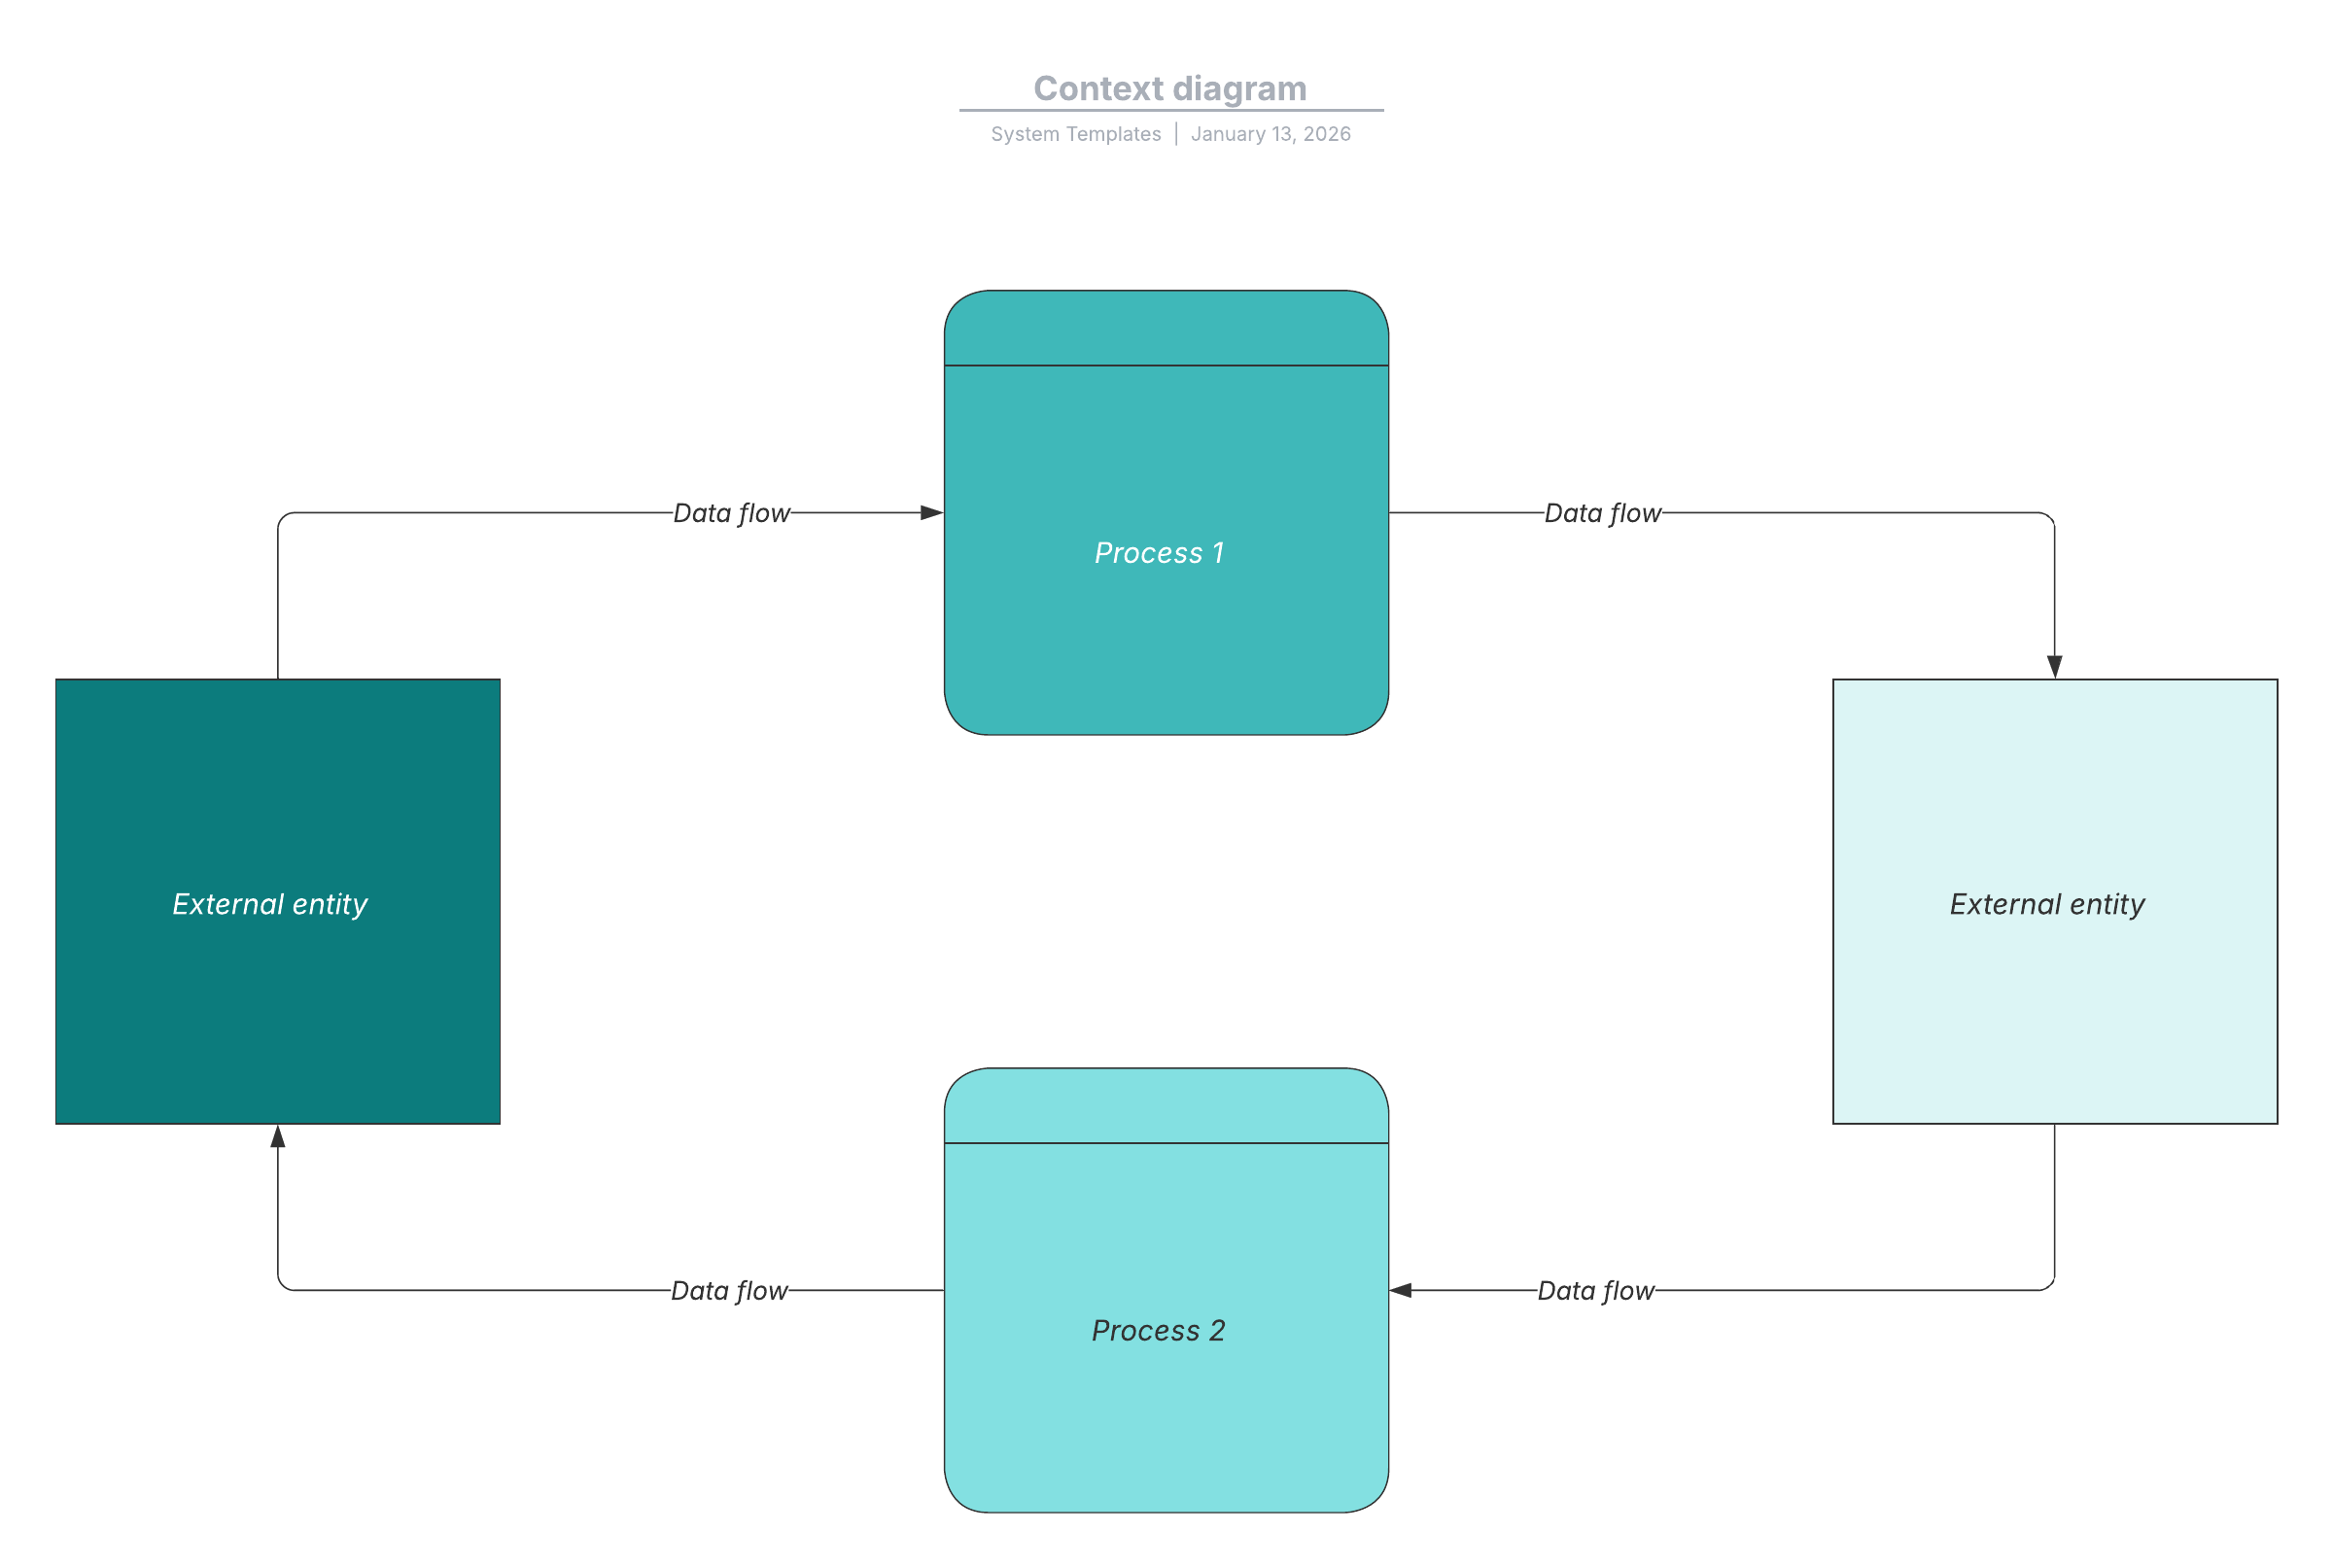
This context data flow diagram template can help you:
- Map out the flow of information for any process/system.
- Visualize a high-level overview of the whole system/process.
- Share this overview with stakeholders and developers.
Open this template and add content to customize this context data flow diagram diagram to your use case.
Improve any system or process with a context diagram
If you need to optimize a process or system, you might find tracking all the moving parts difficult. This may especially be the case when you have several systems working together. Fortunately, you can use a context diagram to help. Whether you are an engineer, developer, analyst, quality control specialist, or project stakeholder, a context diagram gives you a high-level overview of your entire system as it is or as you want it to be.
Lucidchart offers a context diagram template you can easily customize to your unique needs. Using the Lucidchart context diagram to visualize your system can help you identify errors and identify and seize opportunities for improvement. You can also easily share the template or collaborate on it with team members or other stakeholders.
Use the context diagram in Lucidchart
Customize this template using Lucidchart’s many tools and features. You can add or change:
The template is essentially a type of data flow diagram (DFD) and so it uses the standard DFD symbols. You can use symbols to represent each component of your system and how each component exchanges information and interacts with other components.
To learn how to edit Lucidchart templates or learn more about using DFD symbols, click on the tutorial buttons to the right of the template. To share the template, you can use Lucidchart’s convenient integrations with Microsoft Teams, Zoom, and Slack.