It is impossible to imagine modern web development without the use of Chrome DevTools. Thanks to a clean UI and continuous improvements to meet real-world needs, the tool has become the go-to live development environment that surpasses many contemporary IDEs in both functionality and performance. But how productive are you with the DevTools in your daily development workflow? I’d like to share some of my favorite shortcuts that will help you master the tool.
Instantly open the DevTools
You can quickly open the DevTools by simply hitting the F12 key. In most cases though, you also want to inspect an element on a page. There’s a special shortcut that gets you there even faster: hitting Ctrl+Shift+C will open the DevTools and invoke the inspector tool.Open the DevTools and jump straight to the inspector tool via Ctrl+Shift+CI don’t know about you, but every time I use this shortcut, I feel like a professional gunslinger!Source: Giphy
Disable cache to get back some sanity
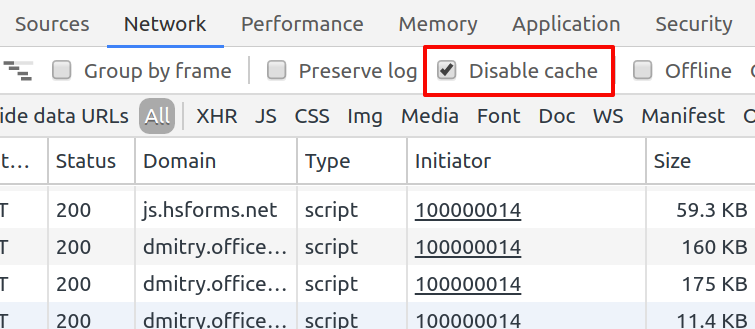
A typical development cycle consists of modifying files on your system and reloading the page to observe the results. How many times have you observed that your saved changes don’t show up, only to later realize that it was due to caching? Do yourself a favor and toggle one important option: "Disable cache" in the Network tab. Done. Productivity increased, confusions reduced.The "Disable cache" option in the Network panelAnd don’t worry, this option only applies to the current page and is only active when the DevTools are open.
Pull up the console on any tab
I find myself needing to use the console quite often for quickly manipulating the DOM elements, analyzing the current variables during debugging, or executing functions from the app. Thankfully, I can bring up the console without leaving the current DevTools tab by pressing ESC.Open the console from any DevTools panel by pressing ESC
Edit the page live
A great advantage of using the DevTools is the ability to edit the state of your app "live," which means you will immediately see your changes without having to reload the page. You can modify element attributes and content right from the Elements panel by double-clicking on the item you want to change. Edit element attributes from the Elements panel by double-clicking themNote that you can not only change the attribute values but also the attribute names or even element tag names. To add a new attribute, right-click on an element and select "Add attribute."Here are more tricks on the Elements panel for you to try:
Drag and drop elements to move them within the document.
Cut/copy/paste elements using the standard Ctrl+C, Ctrl+X, Ctrl+V.
Press Del or Backspace to delete the selected element.
Press H to show/hide the selected element.
Messed things up? Hit Ctrl+Z for undo, Ctrl+Y for redo.
Go to… anything!
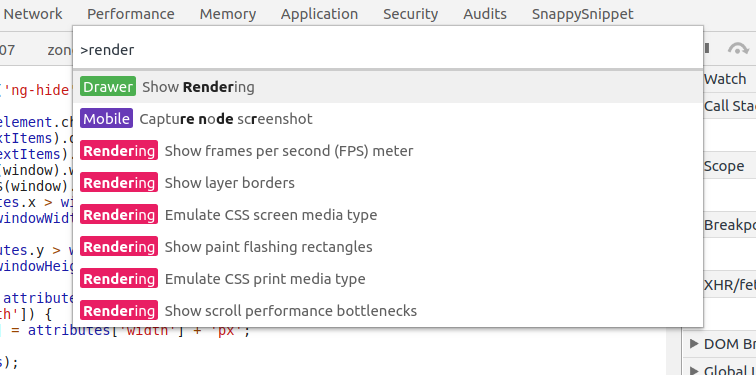
Over 10 years ago, the innovative text editor Sublime Text popularized the "Goto Anything" pattern. Combining a clean UI, fuzzy string searching, and keyboard shortcuts, it allowed users to instantly jump between files, symbols, projects, and lines or even invoke different commands. The feature proved to be so valuable that it was adopted by other software. Chrome DevTools was no exception, and hopefully you already know that you can quickly go to any source file by pressing Ctrl+O and typing a part of its name. You don’t even need to be on the Sources tab!Quickly go to any file via Ctrl+O shortcutBut did you know you can "go to" other things too?When viewing a source file, Ctrl+Shift+O lets you jump to a JavaScript function or a CSS rule, while Ctrl+G jumps to a specified line number in a file.A more recent addition is Ctrl+Shift+P, which allows you to switch between DevTools panels. Note that the list includes all panels: the standard ones like Elements, Network, and Console as well as the less visible ones like Rendering, Performance Monitor, Changes, Coverage, or Request Blocking. I find this shortcut very handy, as I can never remember how to open all these extra panels with a mouse. What? You had no idea these panels even existed? You’re welcome! Toggle any DevTools panel via Ctrl+Shift+P
Pretty print
I think pretty print is one of the most overlooked features of DevTools. As the name suggests, it will pretty-print compressed JavaScript or CSS files, which is useful when you need to debug production code or third-party libraries. What’s more, line numbers from exception stack traces will be automatically remapped to the pretty-printed version of the source file!Pretty print feature in Dev Tools
Find function definition
Having functions as first-class citizens enables powerful functional programming paradigms in JavaScript. But it can also make the code harder to debug, as functions dwell everywhere as arguments or properties of objects. Finding out in runtime where a certain function was originally defined used to be a non-trivial task until the team behind DevTools implemented "Show function definition." The feature can be accessed by right-clicking on any function value when inspecting an object in the console or in the debugger.Show function definition in DevTools
Reveal in Elements Panel
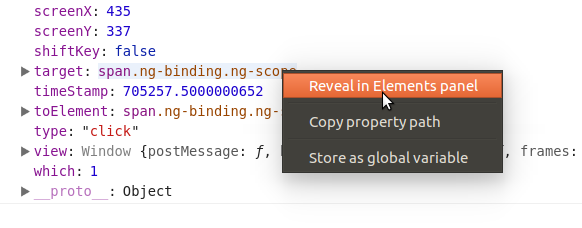
Similarly, when inspecting a reference to a DOM element, you might want to find out where that element lives on the page and what styles are applied to it. The "Reveal in Elements panel" feature does exactly that.Reveal in Elements panel in DevTools
Bonus: find out what’s new
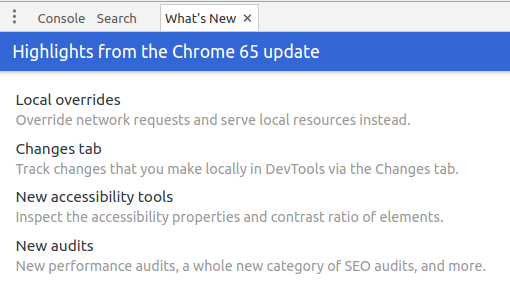
A new major stable version of Chrome comes out every 1-2 months, and each version comes with new features that both end users and developers can get excited about. It’s not easy to stay on top of all the latest and greatest with such a rapid release cycle, so recent versions of Chrome have been incorporating a handy "What’s New" panel in the DevTools that highlights a handful of important changes. The panel automatically pops up in the DevTools Drawer every time Chrome is updated to a major new version and stays there until you close it. If you close it accidentally, you can always reopen it via the Ctrl+Shift+P keyboard shortcut that you just learned!The "What's New" panel in DevToolsTo stay updated on the latest news in Chrome and Chrome DevTools, follow the Google Developers Web Fundamentals blog. What are your favorite DevTools tricks? Share in the comments.
About Lucid
Lucid Software is the leader in visual collaboration and work acceleration, helping teams see and build the future by turning ideas into reality. Its products include the Lucid Visual Collaboration Suite (Lucidchart and Lucidspark) and airfocus. The Lucid Visual Collaboration Suite, combined with powerful accelerators for cloud and process transformation, empowers organizations to streamline work, foster alignment, and drive business transformation at scale. airfocus, an AI-powered product management and roadmapping platform, extends these capabilities by helping teams prioritize work, define product strategy, and align execution with business goals. The most used work acceleration platform by the Fortune 500, Lucid's solutions are trusted by more than 100 million users across enterprises worldwide, including Google, GE, and NBC Universal. Lucid partners with leaders such as Google, Atlassian, and Microsoft, and has received numerous awards for its products, growth, and workplace culture.