Symplexity
Symplexity demonstrates the versatility of Lucidchart as they provide documentation for internal employees and clients.
Key benefits
- DIAGRAMMING NETWORKS
- Lucidchart allows Symplexity employees to easily and quickly create network diagrams that can be presented to clients and provide the necessary level of detail to help them understand.
- SIMPLIFYING THE COMPLEX
- Lucidchart helps employees explain complex details to less technical audiences.
- EDUCATING INTERNALLY
- Lucidchart is key for helping Symplexity employees understand their own inner company workings. Visual documentation helps keep everyone on the same page.
SIZE: Medium (101-2,500 employees)
Symplexity is a Managed Security and IT services provider with clients across finance, healthcare, and manufacturing industries. Symplexity is the trusted partner for many reputable companies, safeguarding their networks and valuable corporate data with the regions only in-house Security Operations Center, as well as a Help Desk and Engineering team with over 400 certifications.

Symplexity’s slogan is “simplifying the complex”—we didn’t need to hear much more to realize they are a golden customer. The Managed IT Security Provider helps protect organizations from cyber threats, which requires clear communication about complicated topics. Lucidchart is focused on helping customers communicate complex ideas and information, so Symplexity’s mission hit close to home.
Symplexity has an in-house Security Operations Center, or SOC, that monitors hundreds of thousands of events every day through a Security Information and Event Management System. If the system recognizes someone trying to access the network from a country where it does not provide services, the system can immediately disable the account as a precautionary measure and notify the SOC for proper resolution. If Internet connectivity fails for an organization the system notifies Symplexity and action can be taken immediately, often times prior to the customer even realizing there's an issue. These are just two examples of alerts that Symplexity responds to on a daily basis.
As Symplexity strives to provide simplicity in an industry of overly complex design and production, there is a great deal of emphasis on documentation for the benefit of both internal employees and clients. That’s where Lucidchart comes in.
While some companies have a single use case for Lucidchart, Symplexity truly demonstrates Lucidchart’s versatility. T.J. Patterson is a network engineer at Symplexity, and he walked us through the many different use cases he and his team have for Lucidchart.
Diagramming networks
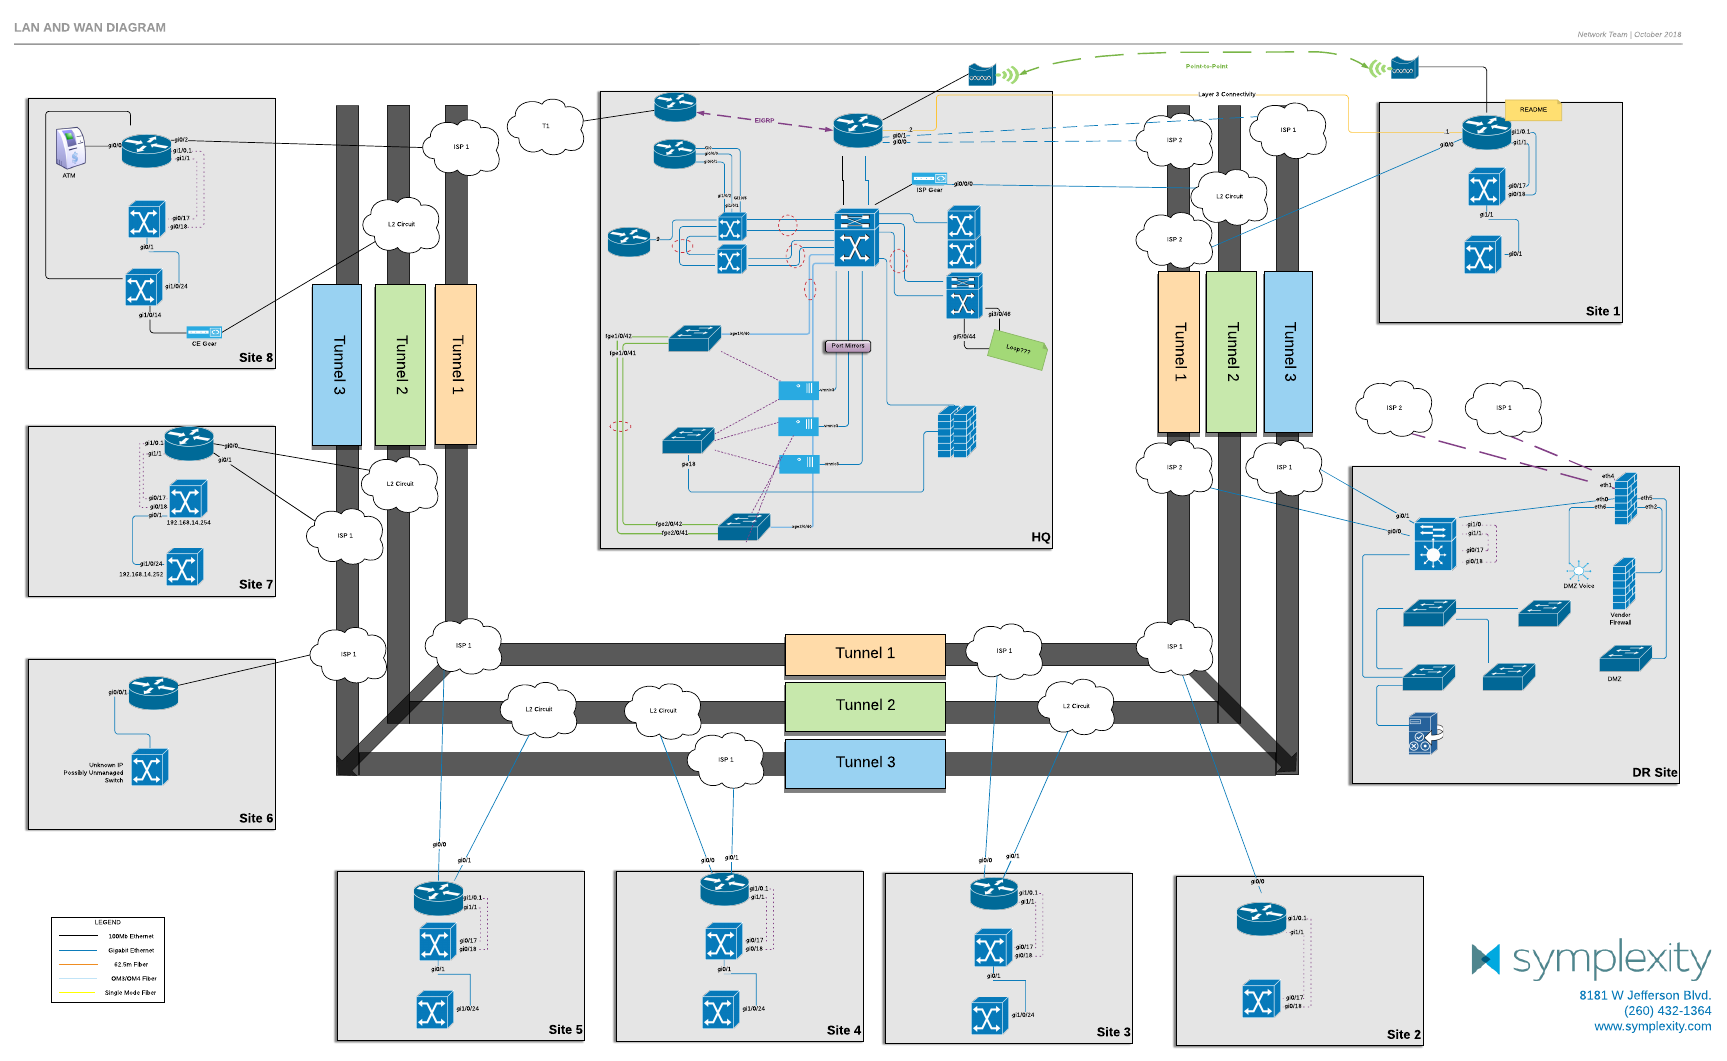
One of Symplexity’s primary use cases is mapping out what a network looks like. The secret to creating these diagrams is to provide all the details of a network while keeping the visual itself as simple as possible. In order to do so, the Symplexity team draws an overview of the network architecture but hyperlink to assets in the company’s web-based document management system so viewers can still get the nitty-gritty details.
T.J. describes, “If anybody is looking at a diagram and wants to know more about a specific device, they can click on that link from Lucidchart, and it directs them straight to the asset documentation with all the detail they need.”
Recently, T.J. worked with a client looking to set up outdoor wireless in a parking lot. Instead of having to go onsite, T.J. took a screenshot of the venue on Google Maps, inserted it into Lucidchart, and drew on top of the image. He then shared the diagram with the client and walked through it in real time over the phone.
“I asked the customer to tell me how the fiber runs from point A to B, and we had a visual representation and could pull everything together over a live call. That actually helped a ton because we didn’t have to go out there and get an explanation or rely on pen and paper,” T.J. explains.

As they build these network diagrams, Symplexity relies on the shape libraries already available in Lucidchart, which makes diagram creation faster and cleaner and creates consistency across the org.
Mapping out applications
The team often finds themselves trying to explain the complex details of how an application works to someone “a little less technical.” They’ve found that Lucidchart helps simplify complex concepts to fit any audience.
Recently, a client was experiencing performance issues with their core banking application, and the Symplexity team was trying to help both an onsite IT employee and a C-level executive understand all the different components required for the application to function successfully. Using Lucidchart, the team clearly mapped out all the components in the flow of the application, showing where breaks can occur and cause outages to the client’s actual operation. The visual has helped educate the client on how performance can be improved.

Visualizing office floor plans and technology
Lucidchart is key for internal documentation at Symplexity as well. For example, their tools team relies on Lucidchart to map out the physical infrastructure of the company’s headquarters. There are 20-30 large LED screens throughout the building that display various data. The physical building layout outlines the host name of each device so that when one TV is out, someone can identify the device and resolve it quickly.

Educating internally
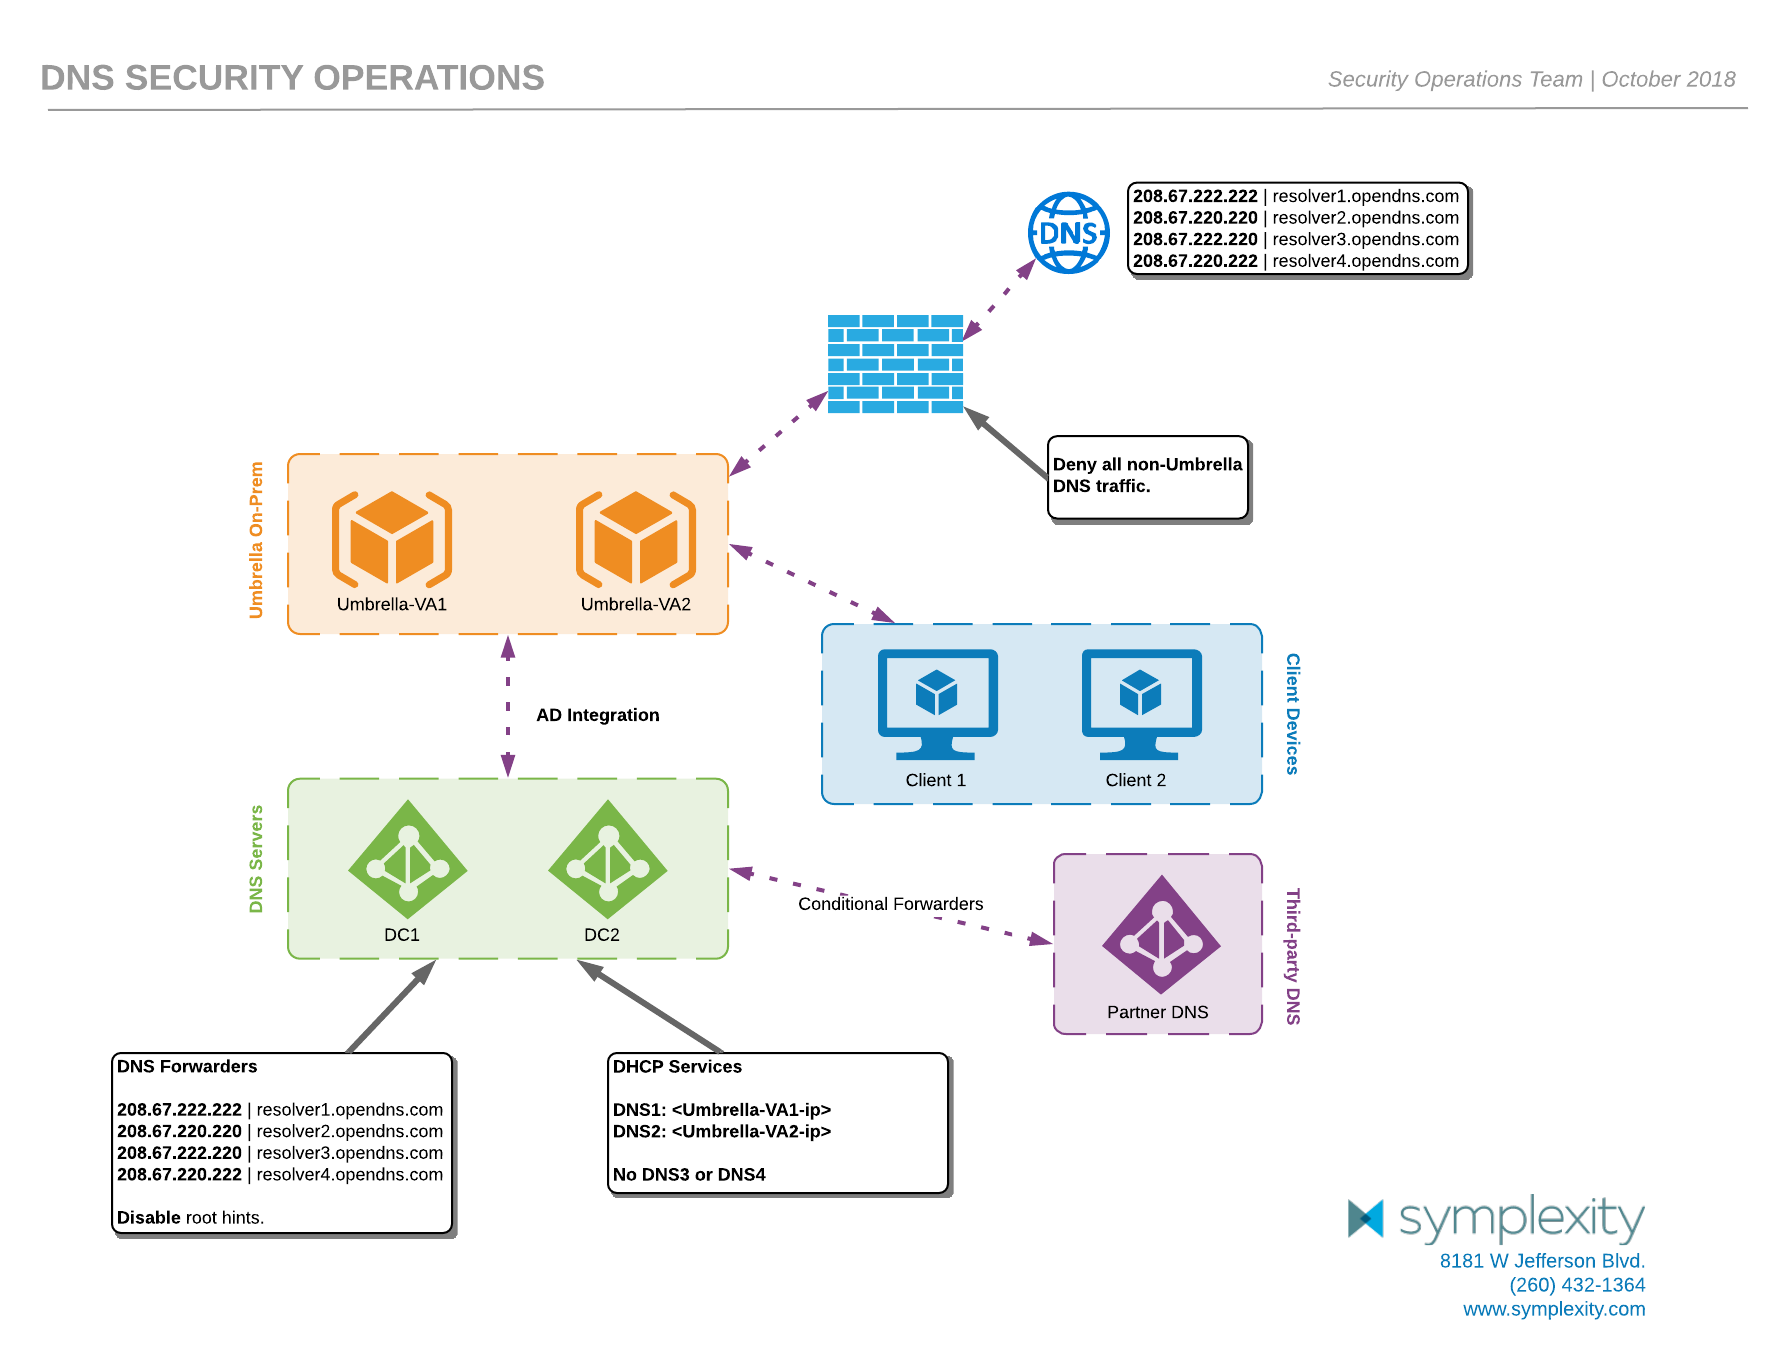
In addition to helping clients understand their applications and systems, Lucidchart helps Symplexity employees understand their own inner company workings. For example, the security team has focused on developing documentation and monitoring strategies with the security, tools, and onboarding teams by using Lucidchart to visualize Symplexity’s DNS security platform to help employees better understand how it to troubleshoot at scale.

“We have so many hands in the pot supporting and deploying, and I want to make sure that when someone runs into that weird issue, they can go to a central place, look at this somewhat simple diagram, and say, ‘Oh, now I understand why this is done this way. Now I understand how I need to troubleshoot .’”
Symplexity’s various technical teams create rack, LAN, and WAN diagrams that help other internal teams provide quicker support. According to T.J., creating all of these different diagrams is much faster with Lucidchart than it is with Visio. And in addition to being more efficient, it helps the team create diagrams that feel polished and professional.

Seeing results
“Over the last year, I have heard comments such as ‘That extra detailed diagram actually helped me do XYZ.’ Based on this feedback and my own experience, I know we are benefiting from Lucidchart. It has become more mission critical with the amount of network diagrams we build and the growing number of clients we support.”
Whether they’re mapping out business applications for MSPs, explaining highly technical concepts to C-level execs, or creating highly detailed network diagrams, Symplexity partners with Lucidchart to deliver security at scale while maintaining clarity and simplicity, both inside and outside the organization.